

1 Introduction
The Ebro foreland basin, located on the northeastern region of the Iberian plate, has been extensively studied during the last decades as a natural example that enables analysing the links between thrust belt kinematics, orogenic loading, flexural subsidence and basin erosion (Desegaulx and Moretti, 1988; García-Castellanos and Larrasoaña, 2015; García-Castellanos et al., 2003; Gaspar-Escribano et al., 2001; Hoth et al., 2008; Jones et al., 2004; Millán et al., 1995; Vergés et al., 1998; Zoetemeijer et al., 1990). Despite the multivergent character of the tectonic loading of the Ebro foreland basin (coming from the Pyrenees, Iberian and Catalan Coastal Ranges, e.g., Desegaulx and Moretti, 1988; García-Castellanos et al., 2003), its basement mainly dips northwards indicating the Pyrenees as the main contributor to tectonic load (Gaspar-Escribano et al., 2001; Millán et al., 1995). Subsurface data show the existence of several structures affecting the Paleozoic and Mesozoic sequences below the Cenozoic horizontal deposits outcropping in the Ebro basin (Arlegui and Simón, 2001), which were still active during the Early Miocene (Klimowitz, 1992). These structures have been interpreted as accommodation structures (i.e. forced folds, primary salt welds, and salt collapses) related to the Late Jurassic–Early Cretaceous rifting that occurred in the northern Iberian plate and the presence of Triassic evaporites (Butillé et al., 2012). Through the Cenozoic, in response to the African–Iberian–European convergence, a sequential evolution in the main deformational stage existed from the Pyrenees, where the main stage of thrusting occurred during Late Eocene–Early Oligocene to intraplate mountain belts as the Iberian Ranges, where the maximum tectonic activity occurred during the Late Eocene–Early Miocene, coinciding with the decline of activity in the Pyrenees (Casas-Sainz and Faccenna, 2001).
The Anisostropy of Magnetic Susceptibility (AMS) is a recognized indicator of deformation, even in very subtle deformed rocks (e.g., Kissel et al., 1986). AMS analysis has been applied during the last decades to characterize deformation in fold-and-thrusts belts and/or sedimentary basins (e.g., Cifelli et al., 2004; Mattei et al., 1997; Parés, 2015; Soto et al., 2007 and references therein). Despite that it has not been extensively used in foreland basins, several works have demonstrated the potential of AMS to detect very weak tectonic magnetic fabrics in the Ebro foreland basin (Oliván et al., 2008; Parés et al., 1999; Pueyo-Anchuela et al., 2010; Sans et al., 2003; Soto et al., 2009) and in the northern Chinese Tarim basin (Charreau et al., 2006; Huang et al., 2006, 2010). The origin of the preferred orientations of magnetic grains in these scenarios has been related to the existence of compressive tectonic strain at the foreland basin and/or layer parallel shortening extending well beyond the deformation front of the orogen. In the Tarim basin, AMS data are complemented with magnetostratigraphic studies that have permitted to constrain accurately the age of the tectonic imprint recorded in rocks and to relate it to the Late Cenozoic Tian Shan uplift (Charreau et al., 2006; Huang et al., 2006). In this work, a total of 19 sites were sampled on Lower to Middle Miocene (20.4 to 13.7 Ma) lacustrine mudstones outcropping at the central part of the Ebro foreland basin. An accurate chronology for these mudrocks has been established by means of magnetostratigraphic analyses (Pérez-Rivarés et al., 2002). The goal of this work is to analyse late compressional deformation recorded in sediments apparently undeformed from the Ebro foreland basin and to give clues regarding the origin of tectonic magnetic fabrics in foreland basins.
2 Geological setting
The triangular-shaped Ebro basin, located in the northeastern Iberian Peninsula, constitutes the foreland basin of three Alpine ranges: the Pyrenees to the north, the Iberian Chain to the south, and the Catalan Coastal Ranges to the east (Fig. 1). Its formation started during the Palaeocene by flexural subsidence related to the growth of these ranges. Between the Late Eocene and the Late Miocene, the Ebro basin constituted an internally drained depression (Alonso-Zarza et al., 2002; Costa et al., 2010; García-Castellanos et al., 2003), which resulted in the accumulation of a continuous sequence of Latest Eocene, Oligocene and Miocene continental sediments (Alonso-Zarza et al., 2002; Arenas et al., 2001). From the Late Miocene times onwards, its internal drainage opened to the Mediterranean, being its lithosphere erosionally unloaded and uplifted (Fitzgerald et al., 1999; García-Castellanos and Larrasoaña, 2015; Gaspar-Escribano et al., 2001; Vergés et al., 1998). In the Pyrenees, the main orogenic period occurred between the Eocene–Early Oligocene (Muñoz, 1992), and the latest tectonic pulses have been dated by means of tectonic–sedimentary relationships (mainly based on biostratigraphic and magnetostratigraphic studies) as Late Oligocene–Early Miocene at its southern deformation front (Arenas et al., 2001; García Senz and Zamorano, 1992). A few very young (Middle Miocene) thermochronology data (AFT and AHe ages) have been interpreted as recording late out-of-sequence thrusting in two massifs from the internal part of the chain (Gibson et al., 2007; Jolivet et al., 2007). In the Iberian Range, most compressional structures formed between the Late Eocene and the Early Miocene, as dated also by tectonic–sedimentary relationships (Casas-Sainz and Faccenna, 2001).
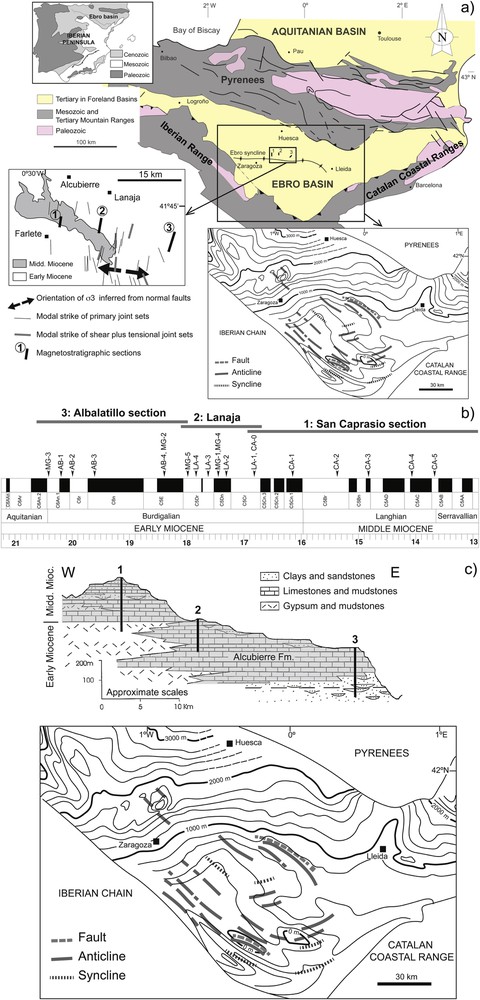
(a) Geological sketch of Northeast Iberia showing the study area in the central part of the Ebro basin. Detailed geological map of the study area and orientation of mesostructures (taken from Soto et al., 2009) (small rectangle). Contour map of the base of the Cenozoic sequence (modified from ITGE, 1990) and major structures in the Paleozoic, Mesozoic and Paleogene deduced from Klimowitz (1992). (b) Geomagnetic polarity time scale (GPTS) (Gradstein et al., 2004) of the studied interval (Early–Middle Miocene) with the position of sites taking into account the three dated magnetostratigraphic sections by Pérez-Rivarés et al. (2002). (c) Magnetostratigraphic sections in relation with the Alcubierre Formation (in grey) showing their synthetic sedimentological characteristics (modified from Pérez-Rivarés et al., 2002).
The margins of the Ebro basin display thick conglomerate sequences recording the main tectonic events of the Pyrenees, Iberian and Coastal Ranges. Toward the central part of the basin, conglomerates grade to sandstones and mudstones of alluvial and fluvial origin. Such fluvial systems converged into the internal sector of the basin, where palustrine areas and extensive freshwater and saline lake systems developed depending on climate conditions (Alonso-Zarza et al., 2002; Arenas et al., 2001; Pardo et al., 2004). With the exception of its westernmost sector, where the Ebro basin displays a symmetric filling coming from its northern and southern margins (Muñoz-Jiménez and Casas-Sainz, 1997), its sedimentary thickness reaches more than 5500 m at its northern (Pyrenean) margin, in contrast with up to 3000 m at its southern (Iberian) margin (Alonso-Zarza et al., 2002; Pardo et al., 2004). This sedimentary asymmetry, together with the northward dipping of its basement, have traditionally led to consider the flexural subsidence of the Ebro basin mainly formed in response to the loading of the Pyrenees (Gaspar-Escribano et al., 2001; Millán et al., 1995; Muñoz, 1992; Naylor and Sinclair, 2008).
In the Ebro foreland basin, deformation associated with thrusting and folding in the autochthonous Cenozoic series is only visible at surface at its margins. This deformation varies from thin- to thick-skinned deformation in the northern (Pyrenean) and southern (Iberian and Catalan) margins, respectively. In the central part of the Ebro basin, the Oligocene and Miocene materials define a very gentle syncline, the Ebro syncline (Arlegui, 1996; Quirantes, 1978), oriented N110E (Fig. 1), and whose wide hinge coincides with the studied area. This syncline has been interpreted as a bending fold created to accommodate the subtle reactivation of WNW–ESE basement faults in response to the lithosphere flexure of the Ebro basin linked to isostatic rebound (Arlegui and Simón, 2001). In the Ebro basin, by the Late Miocene, sedimentation diminished drastically and large erosion surfaces developed at its central part (Soriano, 1990). Thermochronology and numerical modelling data also support a Late Miocene onset of the erosion of the Ebro basin infill (Fillon et al., 2013; García-Castellanos and Larrasoaña, 2015). Several works have reported up to 2 km of surface uplift in internal areas of the Pyrenees since the Late Miocene (Lacan and Orduño, 2012, for details) related to isostatic forces linked to erosion (Lacan, 2008) and/or partial loss of the subducted lithosphere (Gunnell et al., 2008), which could involve the Ebro basin due to the rigidity of the lithosphere (Brunet, 1986). In the Ebro basin, subsurface data show the Paleozoic and Mesozoic series affected by normal faults and associated deformation related to the Late Jurassic–Early Cretaceous rifting occurred in the northern Iberian plate (Arlegui and Simón, 2001; Butillé et al., 2012). These structures also deform Paleogene deposits by several subtle structures (mainly forced folds) in the southern margin of the Ebro basin (Butillé et al., 2012), which can even affect Lower Miocene rocks (Klimowitz, 1992). These structures are parallel to the Iberian and Catalan deformation fronts, oriented NW–SE and NE–SW, respectively (Fig. 1).
In the studied area, structural analysis of mesostructures in Miocene rocks indicates the presence of a dominant set of north–south-striking joints (tensional and shear plus tensional joints) interpreted as resulting from the superposition of north-south intraplate compression and east–west to WNW–ESE rifting-induced tension (Arlegui and Simón, 2001) and NE–SW-trending normal faults related to a WNW–ESE extension (Arlegui and Simón, 1998, 2001; Simón et al., 1999; Soto et al., 2009) (Fig. 1a). This structural scenario has been linked to the convergence between Europe, Iberia and Africa that coexisted since the Middle Miocene with a WNW–ESE extension related to the opening of the Valencia trough at the eastern Iberian margin (Arlegui and Simón, 1998, 2001; Simón and Paricio, 1986; Simón et al., 1999). The studied area is also characterized by a dominant set of NW–SE to WNW–ESE tectolineaments identified on aerial photographs and satellite images that mainly correspond to normal faults with metre-scale offsets (Arlegui and Soriano, 1998; Arlegui et al., 1994).
3 Sampling and methods
Nineteen sites were drilled in subhorizontal Lower–Middle Miocene lacustrine mudstones outcropping at the central part of the Ebro foreland basin (Alcubierre Formation; Arenas and Pardo, 1999) (Fig. 1). This kind of lithology was chosen taking into account the previous AMS work done in the same area by Soto et al. (2009) in order to avoid the effect of palaeocurrents and minimise the content of ferromagnetic (sensu lato) minerals. An average of twelve cores with different orientations was obtained in each site with a portable, water-cooled rock drill and oriented in situ with a magnetic compass. Samples were collected at the same location as magnetostratigraphic samples taken by Pérez-Rivarés et al. (2002) to accurately clarify their age, which spans from ∼20.4 to ∼13.7 Ma (Upper Aquitanian to Serravallian).
Measurement of low-field AMS at room temperature was carried out with a static KLY-2 kappabridge susceptibility meter (AGICO) at the Paleomagnetic Laboratory of Barcelona CCiTUB-ICTJA CSIC. The AMS at room temperature in rocks depends mostly on the crystallographic preferred orientation, the shape of the grains, their composition, and sometimes the distribution interaction of magnetic minerals (Tarling and Hrouda, 1993). Three axes define the susceptibility ellipsoid: maximum (kmax), intermediate (kint), and minimum (kmin). The orientations of these axes correspond to the eigenvectors of the susceptibility tensors and characterize the magnetic fabric. The statistical procedure to obtain the directional and tensor data was based on Jelinek's method (Jelinek, 1977) using Anisoft 4.2 (Chadima and Jelinek, 2009). The magnetic fabrics have been described using the parameters defined by Jelinek (1981): (1) the corrected anisotropy degree, P′, which provides a first indication of rock deformation and preferred mineral orientation, and (2) the shape parameter, T, ranging from −1 (prolate ellipsoid) to +1 (oblate ellipsoid).
Additionally, in order to control the ferromagnetic (s.l.) minerals that contribute to the magnetic susceptibility of the samples, K–T curves from powders of representative samples were recorded to analyse the variation of magnetic susceptibility with temperature using a KLY-3 susceptibility meter combined with a CS-L/CS-3 cryostat and furnace apparatus (AGICO) at the University of Zaragoza.
4 Results
4.1 Magnetic properties
The bulk susceptibility of the studied rocks is rather uniform, with most specimens ranging between 100 and 200 × 10−6 SI (Table 1), confirming their homogeneous composition, already analysed by Soto et al. (2009). The corrected anisotropy degree Pj of all samples is low (Table 1), with values typical of weakly deformed sediments (Pj < 1.1). Most T values range between 0.5 and 1, showing 73% of sites a clearly oblate (T > 0.7) magnetic ellipsoid (Fig. 2). The graph in Fig. 2 shows narrow ranges of both Km and Pj values, indicating slight changes on the mineralogy and anisotropy degree. In order to check the meaning of these small variations, magnetic scalar parameters (Km, Pj, and T) were plotted against the age (Fig. 3). T values remain approximately constant through time, but Km and Pj values show similar slight progressive decreases with age, probably due to small mineralogy changes related to changes in sedimentary conditions (Fig. 1c) (e.g., a progressive decrease in the phyllosilicate content).
Summary of magnetic scalar data.
| # | Site | Age | Age (Ma) | n | K m | Std | P j | Std | T | Std | D, I (Kmax) In situ |
E11.1 (e12/e13) |
Magnetic fabric Type |
| 1 | CA5 | Middle Mioc. (Langhian) | 13.7 | 12 | 139.1 | 14.7 | 1.012 | 0.005 | 0.263 | 0.360 | 118,14 | 40.4/10.9 | 1 |
| 2 | CA4 | Middle Mioc. (Langhian) | 14.1 | 10 | 153.4 | 14.0 | 1.047 | 0.005 | 0.770 | 0.080 | 314,10 | 20.7/5.9 | 2 |
| 3 | CA3 | Middle Mioc. (Langhian) | 14.8 | 12 | 169.7 | 22.4 | 1.028 | 0.004 | 0.726 | 0.107 | 131,1 | 34.2/5.8 | 1 |
| 4 | CA2 | Middle Mioc. (Langhian) | 15.4 | 12 | 113.6 | 20.4 | 1.050 | 0.009 | 0.841 | 0.057 | 188,0 | 29.6/4.3 | 2 |
| 5 | CA1 | Early Mioc. (Burdigalian) | 16.2 | 11 | 98.6 | 42.1 | 1.045 | 0.008 | 0.756 | 0.154 | 201,2 | 19.9/5.8 | 2 |
| 6 | CA0 | Early Mioc. (Burdigalian) | 16.8 | 13 | 204.9 | 45.4 | 1.039 | 0.024 | 0.645 | 0.253 | 253,4 | 50.8/12.0 | 1 |
| 7 | LA1 | Early Mioc. (Burdigalian) | 16.8 | 13 | 192.1 | 42.5 | 1.017 | 0.003 | 0.345 | 0.319 | 064,8 | 11.1/0.6 | 3 |
| 8 | LA2 | Early Mioc. (Burdigalian) | 17.3 | 12 | 157.1 | 12.0 | 1.016 | 0.004 | 0.361 | 0.202 | 263,2 | 18.1/8.7 | 2 |
| 9 | MG1 | Early Mioc. (Burdigalian) | 17.4 | 15 | 148.4 | 5.8 | 1.017 | 0.003 | 0.563 | 0.177 | 112,4 | 12.8/5.0 | 3 |
| 10 | MG4 | Early Mioc. (Burdigalian) | 17.4 | 15 | 114.3 | 10.0 | 1.031 | 0.005 | 0.772 | 0.109 | 330,2 | 39.3/4.2 | 1 |
| 11 | LA3 | Early Mioc. (Burdigalian) | 17.6 | 12 | 92.5 | 2.2 | 1.063 | 0.023 | 0.706 | 0.266 | 173,2 | 69.8/7.3 | 1 |
| 12 | LA4 | Early Mioc. (Burdigalian) | 17.8 | 10 | 152.7 | 9.4 | 1.055 | 0.013 | 0.864 | 0.080 | 134,2 | 67.5/6.1 | 1 |
| 13 | MG5 | Early Mioc. (Burdigalian) | 18.0 | 15 | 140.3 | 31.3 | 1.025 | 0.006 | 0.791 | 0.084 | 084,1 | 32.6/5.8 | 1 |
| 14 | MG2 | Early Mioc. (Burdigalian) | 18.4 | 15 | 188.2 | 20.1 | 1.054 | 0.010 | 0.789 | 0.083 | 60,6 | 27.4/4.5 | 2 |
| 15 | AB4 | Early Mioc. (Burdigalian) | 18.4 | 12 | 175.4 | 44.5 | 1.044 | 0.008 | 0.831 | 0.084 | 162,2 | 30.5/4.8 | 2 |
| 16 | AB3 | Early Mioc. (Burdigalian) | 19.6 | 12 | 281.0 | 41.7 | 1.061 | 0.013 | 0.907 | 0.064 | 135,7 | 27.4/2.5 | 2 |
| 17 | AB2 | Early Mioc. (Burdigalian) | 20.0 | 11 | 213.6 | 14.2 | 1.044 | 0.004 | 0.847 | 0.071 | 259,4 | 19.6/3.3 | 2 |
| 18 | AB1 | Early Mioc. (Burdigalian) | 20.2 | 9 | 214.1 | 48.3 | 1.066 | 0.021 | 0.853 | 0.090 | 197,5 | 59.4/7.7 | 1 |
| 19 | MG3 | Early Mioc. (Burdigalian) | 20.4 | 15 | 115.9 | 6.9 | 1.045 | 0.002 | 0.810 | 0.094 | 99,0 | 30.7/5.7 | 2 |

Degree of anisotropy P′ vs. shape parameter T and mean susceptibility Km vs. Pj of all studied specimens.
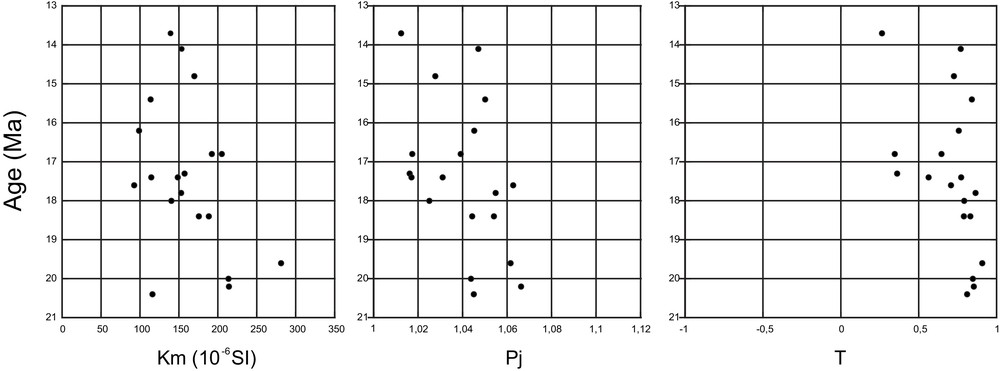
Variations of Km, Pj and T (site means) with time. T values remain approximately constant through time, but Km and Pj values show similar slight progressive decreases with age, probably related to changes in sedimentary conditions.
As observed by Soto et al. (2009), the paramagnetic contribution to the magnetic anisotropy in the studied mudstones represents more than 90%, being the phyllosilicate (illite and chlorite) grains the principal AMS carriers. The temperature-dependent susceptibility curves (K–T curves) of these rocks show a continuous decreasing characteristic of a high contribution of paramagnetic minerals (Fig. 4). Creation of magnetite can be observed after heating at ∼480–500 °C. Both the high contribution of paramagnetic minerals and the creation of new magnetite mask a clear Curie temperature in the thermomagnetic curves (Fig. 4) and avoid the possibility of distinguishing which ferromagnetic s.l. minerals dominate in our samples. Magnetic mineralogy experiments (i.e. IRM and subsequent thermal demagnetization curves) done in similar lacustrine mudstones by Pérez-Rivarés et al. (2002) point to magnetite as the main ferromagnetic s.l. mineral.
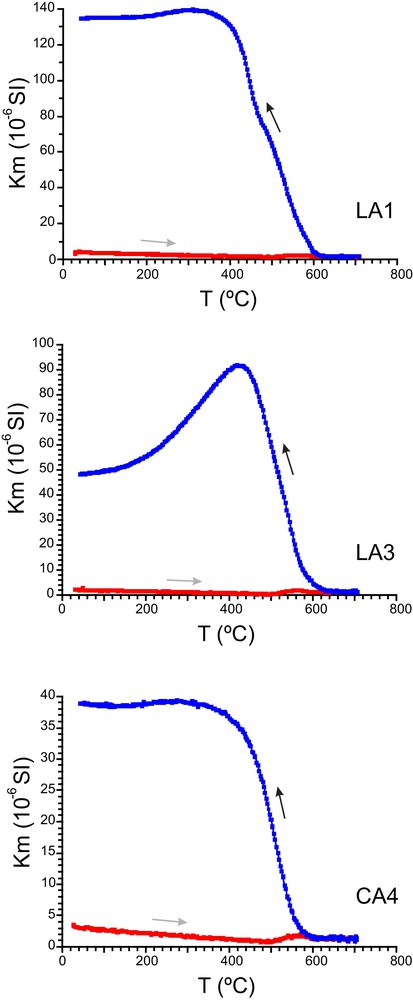
Thermomagnetic curves (K–T). Heating and cooling curves are distinguished by grey and black arrows, respectively. All curves show a continuous decrease during heating, characteristic of a high contribution of paramagnetic minerals.
4.2 Magnetic fabric
The magnetic fabric of the studied mudrocks displays three types of magnetic ellipsoids according to their directional properties (Fig. 5 and Table 1). Forty-two percent of sites show an oblate magnetic ellipsoid (Type 1) representative of a sedimentary fabric related to compaction: the minimum susceptibility axes are perpendicular to the bedding plane and the maximum and intermediate susceptibility axes are scattered within the bedding plane, being the semi-angle (ɛ12) of the confidence ellipse around the kmax axes in the kmax – kint plane larger than 30°. These sites do not present a defined magnetic lineation and therefore, do not register any tectonic imprint. The second magnetic fabric type (Type 2) is a triaxial to clearly oblate susceptibility ellipsoid where all three principal susceptibility axes are well grouped and distinct. They show kmin axes around the bedding pole and kmax and kint scattered throughout the bedding plane, although their grouping is slightly improved with respect to Type 1, as indicated by smaller ɛ12 values (15° < ɛ12 ≤ 30°). Although weak, a magnetic lineation can be defined in these sites. Finally, in Type 3, magnetic ellipsoids are characterized by well-grouped kmax and kint axes, showing smaller ɛ12 values (ɛ12 < 15°) and a well-defined magnetic lineation. 47 and 11% of sites show Type-2 and -3 magnetic fabrics, respectively. These weak and well-defined magnetic lineations have been interpreted as resulting from a subtle tectonic overprint as the effect of palaeocurrents and/or magnetic mineralogy artefacts can be discarded (see § Discussion and Soto et al., 2009 for details). The magnetic lineation of sites showing both a weak (Type-3 magnetic fabric) and well-defined (Type-2 magnetic fabric) magnetic lineation is plotted in Fig. 6. Kmax axes of magnetic fabric Type-2 ellipsoids are dispersed, although a roughly east–west orientation can be distinguished. Both the stereoplot and density plot of the well-defined magnetic lineations display two maxima, with roughly N090E and N110E directions (Fig. 6).
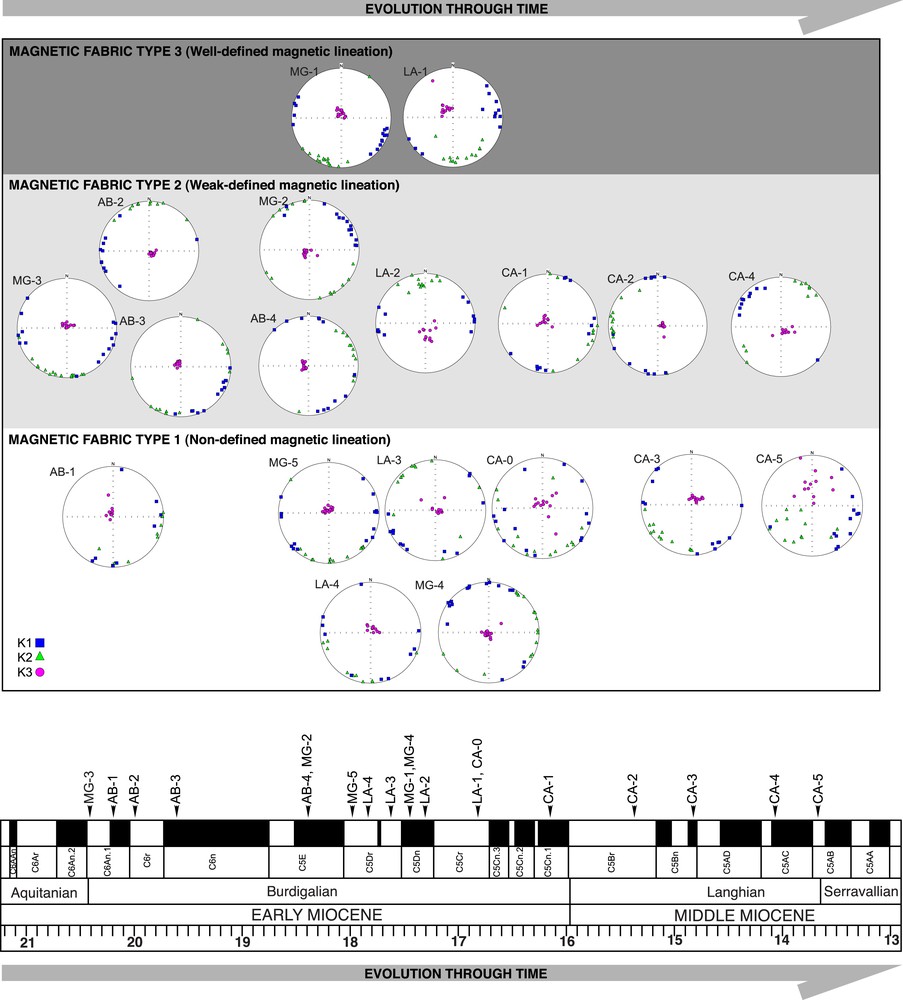
Lower-hemisphere equal-area stereoplots of all sites as a function of the magnetic fabric type and its position through time in the GPTS scale.
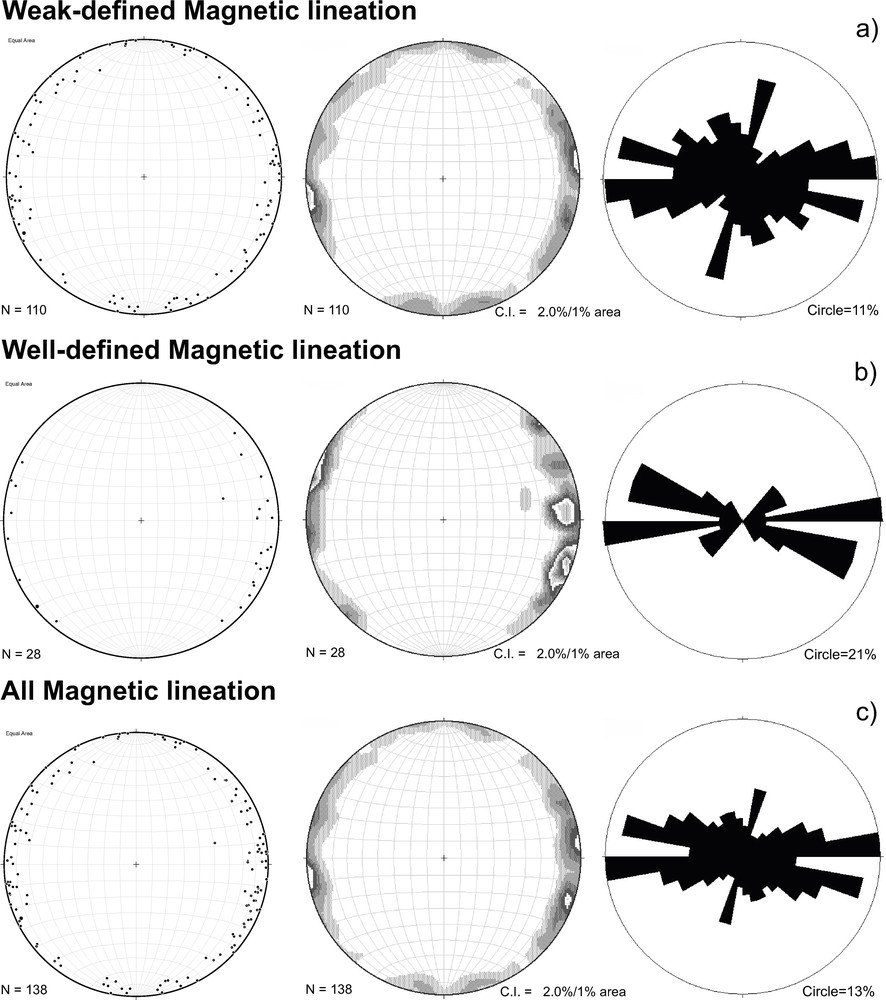
Lower-hemisphere equal-area stereoplots, density plots and rose diagrams of kmax. Only for sites with (a) weak-defined, (b) well-defined and (c) weak-defined and well-defined magnetic lineation. N indicates the number of data represented.
Fig. 5 shows how the obtained magnetic ellipsoids evolve through time. The distribution of the different magnetic ellipsoids (i.e. magnetic fabric types) does not have any tendency with time. Despite the density plot of magnetic ellipsoids showing weak and well-defined magnetic lineation displaying two maxima around a unique east-west direction, a detailed analysis of every magnetic ellipsoid evidences a high variability on the orientation of magnetic lineations (Fig. 5). We interpret such a high variability as being linked to very weak deformation occurring in the study area during the Early–Middle Miocene (between the Burdigalian and Langhian). Such very weak deformation would be able to reorient some sedimentary magnetic ellipsoids with different degrees of clustering of k1 (i.e. weak and well-defined magnetic lineation). This tectonic overprint is compatible with the roughly north–south compression linked to the convergence between Europe, Iberia and Africa during the Early–Middle Miocene.
5 Discussion
Both weak and well-defined magnetic lineations observed in the central part of the Ebro foreland basin have been interpreted as the result of a subtle tectonic overprint that occurred during or shortly after deposition of the rocks (i.e. during the Early and Middle Miocene). Magnetic fabrics of weakly deformed mudrocks are blocked during the earliest diagenesis and can remain locked (Larrasoaña et al., 2004; Parés, 2004; Parés et al., 1999), recording the prevailing stress conditions during a short period (i.e. after deposition and before the consolidation of material), if subsequent tectonic stages do not occur (Mattei et al., 1997). The possibility of paleocurrent influence has been discarded, as only lacustrine mudstones accumulated in very low-energy environments were sampled. Our results coincide with previous works by Soto et al. (2009) and Pueyo-Anchuela et al. (2010) that were carried out close to the studied area in the “non-deformed” sediments of the Ebro foreland basin. In the first case, Soto et al. (2009) sampled a similar lithology, compared the results of AMS with palaeostress analysis and related them with the regional Early–Middle Miocene north–south compression linked to the convergence between Europe, Iberia, and Africa. Pueyo-Anchuela et al. (2010) sampled a wider variety of rocks (sandstones, mudstones and carbonatic rocks) in two north–south cross-sections from the South Pyrenean frontal thrust and related the obtained WNW–ESE-trending magnetic lineation with layer parallel shortening extending well beyond the Pyrenean deformation front.
In our work, despite the obtained magnetic ellipsoids are similar to those found in weakly deformed mudrocks with incipient tectonic deformation (Kissel et al., 1986; Larrasoaña et al., 2004; Mattei et al., 1997; Parés et al., 1999), only 11% of the sites show well-defined magnetic lineation (Type-3 magnetic fabric) and 42% of the sites show a sedimentary fabric (Type-1 magnetic fabric). Statistically, the roughly east–west weak and well-defined magnetic lineation has a coherent tectonic significance. However, looking at every magnetic ellipsoid, the magnetic lineation presents a high variability, without a clear trend through time (Fig. 5 and Table 1). These results contrast with other AMS results obtained in weakly deformed rocks from fold-and-thrust belts (e.g., Apennines, Zagros, Pyrenees, Sevier thrust belt, Tian Shan) (Bakhtari et al., 1998; Parés et al., 1999; Sagnotti et al., 1998; Tang et al., 2012; Weil and Yonkee, 2010) or deformed autochthonous foreland sediments (northern Ebro basin; Oliván et al., 2008; Parés et al., 1999; Sans et al., 2003) (northern Tarim basin; Charreau et al., 2006; Huang et al., 2006, 2010), where most magnetic ellipsoids present a weak and/or well-defined magnetic lineation trending parallel to existing thrust and/or folds, and sedimentary fabrics (i.e. oblate magnetic ellipsoids with the maximum and intermediate susceptibility axes scattered within the bedding plane) represent a minority group. We interpret the obtained magnetic ellipsoids resulting from a very weak tectonic overprint able only to reorient some of them.
In terms of deformation, the central part of the Ebro basin is deformed by: 1) a very subtle syncline, the Ebro syncline (Arlegui, 1996; Quirantes, 1978) (Fig. 1a), and tectolineaments corresponding to normal faults of metre-scale offsets (Arlegui and Simón, 2001; Arlegui and Soriano, 1998) interpreted as Late Miocene and linked to the onset of uplift related to the isostatic rebound of the Pyrenees (Arlegui and Simón, 2001), 2) a dominant set of north–south-striking joints (Fig. 1a) interpreted as resulted from the superposition of north–south intraplate compression and east–west to WNW–ESE rifting-induced tension related to the opening of the Valencia trough in the eastern Iberian margin (Arlegui and Simón, 1998, 2001), 3) NE–SW-trending normal faults related to the above-mentioned rifting (Arlegui and Simón, 1998, 2001; Simón et al., 1999; Soto et al., 2009), and 4) subtle NW–SE structures (mainly forced folds) (Fig. 1a) that can even affect Lower Miocene rocks towards the southern half of the Ebro basin (Klimowitz, 1992), which have been interpreted as structures to accommodate basement normal faults in the presence of important thicknesses of Triassic evaporites (Arlegui and Simón, 2001; Butillé et al., 2012). In the northeastern Iberian plate, from the Uppermost Cretaceous to the Late Miocene times, convergence between Europe, Iberia and Africa resulted in an overall north–south compression. Extensional faults related to the opening of the Valencia trough formed during the Late Oligocene–Aquitanian and have been active throughout the entire Neogene (Roca et al., 1999). In the study area, based on the analysis of a large number of mesostructures and their timing relationships, the transition from a dominantly compressional to a dominantly extensional regime occurred by the Middle Miocene (Arlegui and Simón, 2001; Simón and Paricio, 1986). Among the two feasible stress regimes considered for the development of our magnetic fabric, a compressive origin is interpreted by the following observations. Both the magnetic ellipsoids (magnetic fabric type and/or orientation of the magnetic lineation) and scalar parameters (Km, Pj, and T) do not show a clear tendency or variation throughout time suggesting a change from a dominant compressional regime in the Early Miocene to an extensional one. In equivalent positions in the Bardenas Reales area (to the west of the study area), where compressional structures (i.e. reverse faults) are present, magnetic ellipsoids show similar characteristics (Soto et al., 2009), even though Type-3 magnetic ellipsoids (i.e. showing well-defined magnetic lineation) dominate. Therefore, during the Early–Middle Miocene (i.e. from the Burdigalian to the Langhian), we interpret, based on structural and AMS data, that the Ebro basin underwent a very subtle compressive deformation, able to reorient some sedimentary magnetic ellipsoids with different degrees of clustering of k1.
6 Conclusions
Magnetic fabrics from 19 sites sampled on Lower to Middle Miocene (20.4 to 13.7 Ma) horizontal mudstones outcropping at the central part of the Ebro foreland basin show magnetic ellipsoids with a sedimentary fabric (42% of sites) and also magnetic ellipsoids showing a weak (47% of sites) and well-defined (11% of sites) magnetic lineation. The observed magnetic lineation, roughly oriented east–west, is interpreted as representing subtle compressive tectonic conditions governing the study area during the Early–Middle Miocene, linked to the convergence between Europe, Iberia, and Africa. The degree of anisotropy Pj and the shape parameter T seem to reflect Km variations through time, probably related to different magnetic mineralogy contents linked to changes in the sedimentary conditions.
Acknowledgements
Funding for this work came from project CGL2013-42670-P (Ministry of Economy and Competitiveness, Spain) and a JAE-Doc Postdoctoral (CSIC, Spain) contract for the first author. The authors are thankful to the Paleomagnetic Laboratory of Barcelona CCiTUB-ICTJA CSIC and the Magnetic Fabric Laboratory at the University of Zaragoza where the AMS and rock-mag analyses were carried out. We are very grateful to F. Christophoul and D. Frizon de Lamotte for their comments that helped to improve the first version of the manuscript.