

1 Introduction
Long-term storage of CO2 in deep geologic formations has been proposed to face the rising of atmospheric CO2 concentrations due to fossils fuel consumption (Hitchon, 1996; Metz et al., 2005). In the Paris Basin potential target formations for aquifer storage (Bloomfield et al., 2003; Bonijoly et al., 2003) were porous, permeable, and saturated with saline groundwater, brines, hydrocarbons or a combination (Brosse et al., 2010; Vidal-Gilbert et al., 2009). The storage capacity of the Bathonian Oolithe Blanche Formation (saline aquifer/reservoir of the Paris Basin), estimated from its geometry, porosity, and a “storage efficiency” factor for suitable strata, is ca. 4Gt of CO2 (Brosse et al., 2010). The Oolithe Blanche Formation is a deep saline aquifer with temperature between 55 and 80 °C, confined above and below by two aquitards (very low permeability formations). Because of warm temperatures and favourable hydraulic properties in the centre of the basin, the Oolithe Blanche Formation also serves as an ideal reservoir for geothermal energy.
Carbonate reservoirs and deep reservoirs are ubiquitously known to be more or less heterogeneous (e.g., Davis et al., 2006; Dou et al., 2011; Lucia, 1999; Moore, 2001; Westphal et al., 2004). The degree of heterogeneity of carbonate formations is largely explained by the intrinsic complexity of lateral facies variations inherited from sedimentation (Ehrenberg et al., 2006). Furthermore, during burial, the chemical and physical processes of diagenesis of carbonate sediments (e.g., precipitation of cements, dissolution processes, and fracturing) can have a major impact on their geochemical, petrophysical and hydraulic properties (Palciauskas and Domenico, 1976; Rong et al., 2012; Wilson and Evans, 2002).
Porosity and permeability have a fundamental control on modern patterns and rates of fluid migration, and exerted a major control on palaeo-flow fields throughout geological time. Therefore, constraining the diagenetic processes and fluid flow history of the Bathonian reservoir formations of the Paris Basin is fundamental to understand both modern geothermal resources and the impacts of carbon sequestration. Several concepts have been proposed for the cementation of the sediments in the Paris Basin, and one way to test these hypotheses is with mathematical models, through numerical codes. One other major step is to check, with process modelling, the robustness of the hypotheses, which differ from one author to another (e.g., André, 2003; Brigaud et al., 2009a, b; Carpentier et al., 2014; Gonçalvès et al., 2003, 2004a, 2010; Vincent et al., 2007; see Table 1 for synthesis). The aim of our approach is to explain the present-day petrophysical setting and to provide first quantitative elements of the diagenetic events involved within the Bathonian carbonate formation. Therefore, we investigate the impact on the evolution of petrophysical characteristics of physical processes, fluid nature and origin meteoric water recharge versus deep fluids, timing and duration of groundwater flow, precipitation/dissolution processes (i.e. at least a reduction of 10% of porosity as observed).
Conceptual models and hydrogeologic venues of the different phases of fluid circulation, compiled from the mentioned articles. The fluid flow circulation phases do not necessarily match between the different studies because it is time relative.
| Cretaceous fluid circulation | Tertiary fluid circulation | ||||||||
| Age | 1st phase origin | Recharge zone | Age | 2nd phase origin | Recharge zone | Age | Origin | Recharge zone | |
| Vincent (2001) | Early to Late Cretaceous | North | |||||||
| André (2003) | Early Cretaceous | Meteoric | Cretaceous chalk erosion | Meteoric | East and Southeast | ||||
| Gonçalvès et al. (2003) | Hauterivian (136 Myr) | Marine | Southeast | Aptian (112 to 121 Myr) | Meteoric | Northwest | K/Pg (65 to 50 Myr) |
Meteoric | Northwest |
| Vincent et al. (2007) | Berriasian (LCU) |
Meteoric | North | Aptian/Albian boundary (LAU) | Meteoric | North | |||
| Brigaud et al. (2009b) | Berriasian (LCU) |
Mixed fluids | North | Aptian/Albian boundary (LAU) | Mixed fluids | North | Oligocene (33 to 23 Myr) | Vertical migration of meteoric fluids | No recharge zone |
| Gonçalvès et al. (2010) | Eocene (50 Myr) | Mixing (meteoric + deep brine) | |||||||
| Carpentier et al. (2014) | Berriasian (LCU) |
Mixed fluids | Northwest | Aptian/Albian boundary (LAU) | Mixed fluids | Northwest | Late Cretaceous to Early Oligocene | Mixed fluids | No recharge zone |
In this paper, we test one of the most classical hypotheses, i.e. the cementation of the oolitic limestone formation by deep lateral meteoric groundwater recharge. To achieve this goal, we perform numerical simulations of reactive transport, constrained by available data. These simulations have been performed at the scales of both the geological formation and the sedimentary basin.
2 Geological setting of the Paris Basin and Oolithe Blanche Formation
2.1 The Paris Basin
The present-day Paris Basin is a sub-circular intracratonic sag basin (Fig. 1) that covers a broad part of northern France. The structural origin and evolution of the basin was described in detail by Pomerol (1978), and more recently by Guillocheau et al. (2000). Its dimensions are roughly of 500 × 600 km and in geological section it has a bowl shape that reaches a depth of 3000 m. The Paris Basin is bounded on its edges by several uplifted massifs: the Armorican Massif to the west, the French Massif Central and Morvan to the south, the Vosges Mountains to the east, and the Ardennes to the northeast. The crystalline basement is comprised of Variscan granites and Palaeozoic formations. This basement structure and topology is strongly controlled by faults (e.g., the Bray, Seine, Sennely, Saint-Martin-de-Bossenay, and Vittel faults) that propagated into the sedimentary cover throughout the Meso-Cenozoic history of the basin. The Paris Basin was located on a subsiding crust from Middle Triassic (Bourquin and Guillocheau, 1993, 1996, Bourquin et al., 1997) to Late Jurassic. The opening of the Tethys (Early Triassic; Dercourt et al., 2000) and the early stage of the central Atlantic Ocean (Aalenian) are well recorded in the sediments of those ages (Guillocheau et al., 2000). The Paris Basin became fully developed as a passive margin during the Callovian (164.7–161.2 My ± 4.0). The opening of the Bay of Biscay (Early Cretaceous) is coeval with NE–SW compression in the Paris Basin. The Late Cimmerian Unconformity (LCU) and the Late Aptian Unconformities (LAU), which both occurred simultaneously with a major uplift of northern massifs, marked the Lower Cretaceous. The Albian (112.0 My ± 1.0) to Turonian (93.5 My ± 0.8) interval was characterised by extension, while a NE–SW compression resumed during the Late Cretaceous. During the Tertiary, concomitantly with the formation of the West European Graben, the Alpine orogeny event applied a north–south compression to the Paris Basin (Michon and Merle, 2000). The Tertiary is characterized by low subsidence and compression. Finally, the overall inversion of the basin occurred during the Pleistocene (Guillocheau et al., 2000).
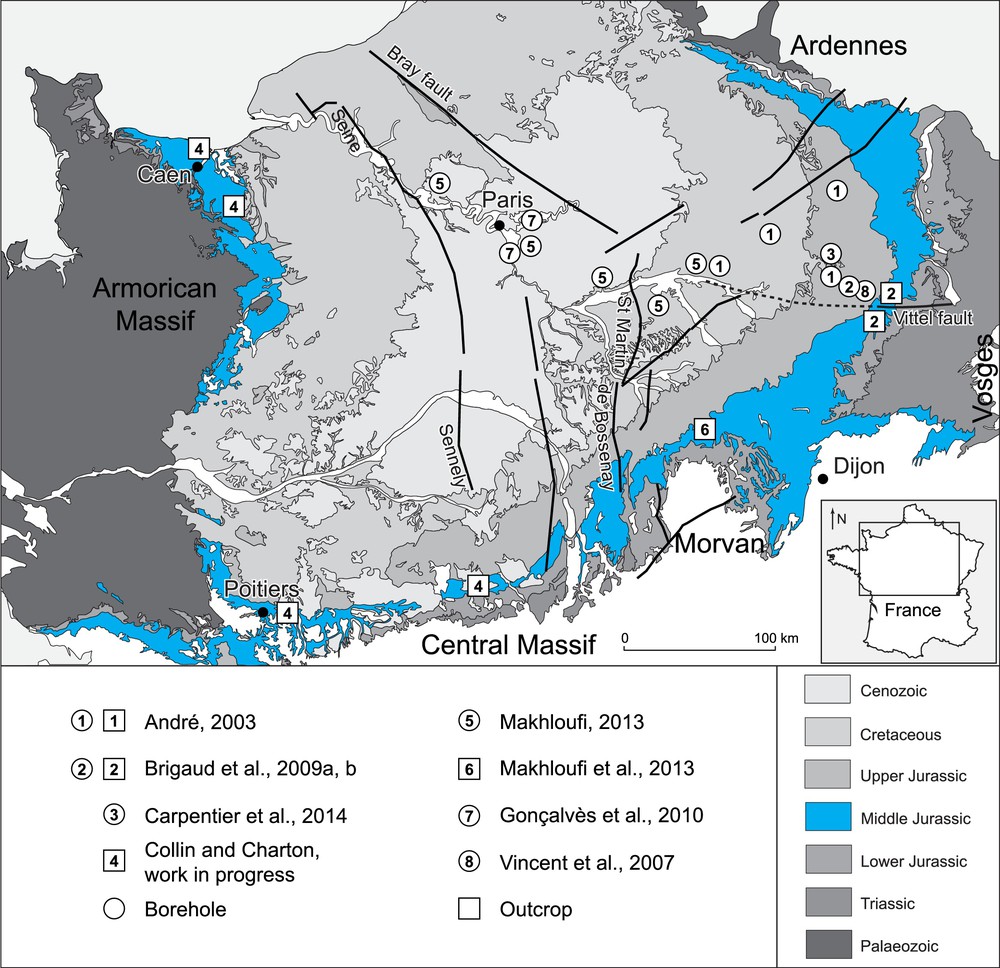
Geological map of northern France (modified from the 1/100,000 geological map of France, BRGM), location of the Dogger and of the sites studied in the works mentioned in the legend.
Most authors (see Table 1 for references and details) put in evidence a strong correlation between the different geodynamic events and palaeo-fluids flows in the basin, in particular, periods of aquifer recharge with meteoric water related to uplift and emersion events.
2.2 The Oolithe Blanche Formation
The Oolithe Blanche Formation is a Bathonian (167.7 My ± 3.5–164.7 My ± 4.0) carbonate formation that extends across the entire Paris Basin, at depths of up to 2 km. It crops out in the western, northwestern, Southeastern, eastern, and northeastern rims. Its thickness varies from 50 to 100 m (50 m in the centre, 80 to 100 m at the eastern edge; Casteleyn et al., 2010; Makhloufi, 2013; Makhloufi et al., 2013). From Bajocian to Callovian times, the basin was located in subtropical latitudes and was connected to the Tethys and northern oceans (Thierry and Barrier, 2000). Thus the Bathonian carbonate formation reviewed here was deposited at palaeo-latitudes of 25 to 30°N. The Bathonian Oolithe Blanche Formation was deposited at palaeo-latitudes of 25 to 30°N and is comprised of the accumulation of ooids (60 to 100% of the grains), peloids, and bioclasts. The main texture is grainstone, very rarely packstone. It was deposited in a shallow, warm and agitated marine environment in a platform setting (Brigaud et al., 2009a, b; Purser, 1975), and three facies are distinguished in the outcrops, showing subtle differences related to the hydrodynamic processes of deposition (see Makhloufi et al., 2013, for details). These facies have been also recognized in the drilled cores (Makhloufi, 2013).
The diagenetic chronology reconstitution reveals a complex history from the basin centre towards its borders. As a result, this formation possesses heterogeneous characteristics in terms of physical and hydraulic properties (porosity and permeability Makhloufi, 2013; Rojas et al., 1990). The basin centre shows better reservoir properties (Makhloufi, 2013) with mean values of porosity of 11% (min = 7% and max = 20%) and mean values of permeability of 0.7 mD (min = 0.001 mD and max = 89 mD), with intercalated levels where the permeability could be of several tens of millidarcys. This results in better transmissivity in this part of the basin. Towards the borders of the basin (to the east or to the southeast in our study case), the reservoir properties of the aquifer are less good, with higher mean values of porosity of 18% (min = 8% and max = 27%), but with poorer mean values of permeability of 0.1 mD (min = 0.001 mD and max = 9 mD).
3 Method
Wood and Hewett (1982), Hewett (1986) and Phillips (1991) have extensively analyzed the general problem of 1-D reactive transport in a homogeneous and isotropic formation. Nevertheless, their analytical solution is constrained by the precipitation/dissolution of quartz, with a very simple chemistry (only one degree of freedom). In the calcite case, the chemistry is controlled by three degrees of freedom (calcium, carbonate, and pH), and the mass action law introduces a non-linearity in the system. The solution would necessarily be more complex than that described by Wood and Hewett, and this justifies the use of a numerical approach.
Based on a literature review and on our knowledge of the spatial distribution of the reservoir properties of the studied aquifer, a data synthesis is proposed (Table 2) and will serve as main constraint of the numerical simulations. Modelling is performed with the software HYTEC – see van der Lee (1998) and van der Lee et al. (2003) for details on physical concepts and their numerical translation.
Data and constraints for the reactive transport simulations. Parameter values serve as data; variable values serve as a constraint.
| Sector 1 - CPB | Sector 2 - MPB | Sector 3 - SEPB | ||
| Distance from recharge zone ∼ 60 km | Distance from recharge zone ∼ 70 km | Distance from recharge zone ∼ 130 km | ||
| t3 Recent |
ϕ = 15% Fluid [NaCl] = 27 g/l Tf = 71.2 °C Depth = 2000–2055 m |
ϕ = 17% Fluid [NaCl] = 27 g/l Tf = 46 °C Depth = 1433–1553 m |
ϕ = 16% Fluid [NaCl] = 27 g/l Tf = 10 °C Depth = 0 m |
|
| t2 112 Myr Aptian Albian boundary (LAU) |
ϕ = 20% Fluids = Fluid F2 [NaCl] (t1) + flush F1 water CO2 concentration of the past enriched water with CaCO3 Tf = 55 °C Depth = 1600 m |
ϕ = 20% Fluids = Fluid F2 [NaCl] (t1) + flush F1 water CO2 concentration of the past enriched water with CaCO3 Tf = 42 °C Depth = 1200 m |
ϕ = 20% Fluids = Fluid F2 [NaCl] (t1) + flush F1 water CO2 concentration of the past enriched water with CaCO3 Tf = 38 °C Depth = 950 m |
Related cementation phase: Blocky calcite 2 (Bc 2) |
| t1 145–140 Myr Jurassic/Cretaceous boundary (LCU) |
ϕ = 0% Fluids = Fluid F2 [NaCl] (t0) + flush F1 water CO2 concentration of the past enriched water with CaCO3 Tf = 50 °C Depth = 1300 m |
ϕ = 30% Fluids = Fluid F2 [NaCl] (t0) + flush F1 water CO2 concentration of the past enriched water with CaCO3 Tf = 38 °C Depth = 950 m |
ϕ = 30% Fluids = Fluid F2 [NaCl] (t0) + flush F1 water CO2 concentration of the past enriched water with CaCO3 Tf = 30 °C Depth = 750 m |
Related cementation phase: Blocky calcite 1 (Bc 1) |
| t0 | ϕ = 20% | ϕ = 20% | ϕ = 20% | |
| 162 Myr | Fluid [NaCl] (t1) = 38 g/l | Fluid [NaCl] (t1) = 38 g/l | Fluid [NaCl] (t1) = 38 g/l | |
| Tf = 22 °C | Tf = 22 °C | Tf = 22 °C | ||
| Depth = 10 m | Depth = 10 m | Depth = 10 m |
The simulation objective is to test the hypothesis that calcite cementation of the Oolithe Blanche Formation resulted from meteoric groundwater recharge of areas near the basin margin. To construct the simulations, the reactive transport model is based on a steady-state fluid flow along a 1-D representative flow line, which depends on the location in the basin (CPB: centre of the Paris Basin; MPB: median part of the basin; SEPB: southeastern part of the basin). Sensitivity tests are performed on several model parameters, including the length of the flow path and the duration of the diagenetic event.
3.1 Data constraints
To fully understand the palaeo-hydrodynamics and geochemistry of fluid migrations, one needs to know the spatial and temporal origin of the basinal fluids, the forces driving their flow in the subsurface, and the sources and nature of recharge and other boundary conditions. The geochemistry of the fluids and the formation mineralogy also need to be considered, as does the temperature field.
From our literature review, two end-members of fluids are likely responsible for the porosity reduction of the Oolithe Blanche Formation: 1) a seawater source (here called F1) during the sedimentation period, in chemical equilibrium with carbonates, slowly rising in temperature without calcite precipitation until the Cretaceous, under burial and compaction (i.e. burial scenario) and, 2) CO2 rich meteoric water (here called F2) coming from the north (Brigaud et al., 2009b; Vincent et al., 2007), or from the northwest at the LCU (145–140 My), and then from the north at the LAU (121–112 My) (Gonçalvès et al., 2003, 2004a) (i.e. meteoric scenario). For the burial scenario, 3-D basin modelling along the 248 My of the Paris Basin's geological history suggests that until the end of the Oolithe Blanche deposition, the leaky brine flow coming from Triassic formations was limited to a compaction-driven-flow process (Gonçalvès et al., 2003, 2004a; Violette, 2014).
For the meteoric scenario, the simulation of meteoric water action on carbonates needs to take into account CO2 concentrations in the atmosphere at the time of the diagenetic event. According to the literature, these CO2 concentrations in the Early Cretaceous atmosphere were very high, ranging from 1200 (Bergman et al., 2004) to 3300 ppm (Berner and Kothavala, 2001).
Present-day temperature, porosity, depth, and salinity are available from borehole data (Table 2). Palaeo-temperature of fluids at depth (Tf) and formation depths come from Gonçalvès et al. (2003). T1 is the meteoric water temperature at the surface. Te is the temperature of the matrix at the exposure location (outcrops). The distance towards the recharge areas has been estimated from the geodynamic scenario proposed by Guillocheau et al. (2000). The proposed petrophysical values at times t0 (162 My), t1 (145–140 My), and t.2 (112 My), are based on thin section analyses (Makhloufi, 2013; Makhloufi et al., 2013). As we consider only cementation phases relative to t1 and t2, the porosity values of times t0 and t3 (recent) cannot be implemented directly as simulation constraints.
3.2 Numerical tool & conceptual model
HYTEC, developed at MINES ParisTech (van der Lee et al., 2003), is used for flow and reactive transport simulations. In this coupled program, the hydrodynamic part (flow, heat transport, multicomponent transport) is solved by a finite-volume approach on unstructured grids based on Voronoi polygons. Considering laminar and isothermal flows in saturated porous media, the velocity field U can be obtained from the permeability field k and Darcy's law (Darcy, 1856):
| (1) |
| (2) |
where is the permeability tensor [L2], μ is the fluid viscosity [ML−1T−1], ρ the density [ML–3], g the gravity acceleration [LT–2] and h the hydraulic head [L].
The advective dispersive heat equation is solved in stationary state:
| (3) |
where λ is the thermal conductivity [ML−1T−3°K−1] and T the temperature.
Solute transport in a saturated porous media by advection, diffusion and dispersion is described by the following equation:
| (3.2.4) |
The chemistry of the reactive fluids is evaluated by CHESS, also developed at MINES ParisTech (van der Lee, 1998). It determines aqueous speciation, ionic exchange, surface complexation, mineral precipitation and dissolution, assuming either local equilibrium or a dynamic mixed status of equilibrium/kinetics. Following the basis component formalism, the reactive transport equation becomes:
| (3.2.5) |
where (resp. ) is the total fixed (resp. mobile) concentration of the basis component i.
Porosity changes are calculated through the mineral volume, and updated implicitly within the transport – reaction sequential iterative loop (Lagneau and van der Lee, 2010). The porosity – permeability model is irrelevant in the scenarios simulated in this study, due to the choice of boundary conditions. The model domain is considered as a 1-D flow line in a homogeneous and isotropic carbonate formation (Fig. 2). Its mineralogical description is here limited to its calcite content. Initial water conditions in the aquifer are at equilibrium with calcite. The boundary conditions at the inlet represent the contact with the atmosphere: imposed flow velocity (mean annual precipitation), imposed temperature (mean annual temperature), water equilibrated with the atmosphere (CO2(g) fugacity). At the outlet, the temperature is prescribed to represent the burial scenario; flow and transport conditions are free outlet conditions. Stationary flow and heat are considered, which result, for this scenario, in a uniform Darcy velocity (independent of the permeability value) and a constant gradient temperature. The reactive transport problem is solved over the duration of the scenario. The simulation is based on the hypothesis that calcite dissolution/precipitation is at thermodynamic equilibrium along the flow line, which is consistent with the time frame and water velocity. The amount of calcite content of the fluid is calculated at each node of the 500 m resolution grid over the duration of the simulation. Thus, the amount of dissolved or precipitated matter is quantified for a total simulation duration of 5 My (plausible duration of the outcrop exposure during the LCU and LAU). Along the flow line, the reactive transport is constrained by the (temperature-dependent) local solubility of calcite and the composition of the reactive fluids, initial aquifer water composition F1 (pCO2, salinity and equilibrium with calcite [CaCO3]) and meteoric water composition F2 (pCO2 and salinity), and the tested host rock (calcite mineral). The influence of the Darcy velocity (U), which is poorly constrained, will be tested. Under hydrodynamic equilibrium conditions, we assume that the fluids are at the same temperature as the host rock.

Conceptual reactive transport model solved by HYTEC (van der Lee et al., 2003). F1: Meteoric fluid which infiltrates from the recharge area, [CaCO3] = 0, with temperature T1 and pCO2. F2: Calcite-rich host rock fluid (Oolithe Blanche formation) with a connected porosity Ф and Darcy velocity U (m·s−1). T2(x): Temperature of the interstitial fluid depending of the distance to the recharge, Te: temperature of the Ootithe Blanche formation at the input (Te = T1), Tf: maximal temperature, with T2(L) = Tf, L, length of the flow line.
4 Results of reactive transport modelling
Simulation results show calcite dissolution at the inlet, as the rainwater equilibrates with calcite. Farther downstream along the flow line as temperature increases, the retrograde solubility of calcite allows for the precipitation of excess calcium and bicarbonate along the flow line. Under the equilibrium assumption, water–rock interaction processes in the first cell of the grid equilibrate water, independently of the cell size. Different grid sizes will “dilute” or “concentrate” calcite dissolution in this cell, leading to a faster decrease in the calcite concentration in the first cell for a smaller grid size. However, the amount of dissolved calcium and of carbonate exported to the aquifer remains the same, whatever the grid size is. As a result, in our simulations, the evolution of the calcite profile in the aquifer (excluding the first cell) is independent of the grid resolution. This has been verified by comparing the simulation results for Δx from 1000 m down to 50 m.
Nevertheless, the simulations of calcite dissolution/precipitation processes show that the precipitated calcite volume decreases when temperature increases because the solubility coefficient is not linearly dependent on the temperature increase (Fig. 3). Moreover, whatever the constraints (Tfluids and pCO2), a positive porosity variation occurs only in the first kilometre (i.e. recharge area) and a porosity order of magnitude is of 10−3 to 10−4 (note that it is an average value calculated over the first cell of the simulated domain, i.e. 1 km), thus two orders of magnitude lower than what we expected, namely 10−1 (Fig. 4). Along the flow line (after the recharge area to the deeper and warmer aquifer zone), the temperature increases and calcite solubility decreases accordingly, thus precipitation of calcite occurs. Nevertheless, the porosity decrease is–10−3, two orders of magnitude less than that expected, i.e.–10−1. The parameters of these simulations are U = 1 m/y, Tf = 50 °C and pCO2 = 3300 ppm and are relatively weakly constrained; therefore a sensitivity analysis of these parameters (Darcy velocity, temperature gradient and length of the flow line) is warranted.

Calcite solubility as a function of temperature for constant pCO2 = 3300 ppm. Along the flow line in the aquifer, the temperature gradient due to depth favours the precipitation of a mass of calcite per litre of water equal to the solubility difference between those two temperatures (shown in grey) and the retrograde solubility of calcite.

Porosity variation ΔФ along the flow line after 5 My as a function of the distance from the recharge area (x = 0), for different temperature gradients (difference between Te = 20 °C and Tf = 30 °C or 50 °C), different partial pressures of CO2 in the assigned input (pCO2 = 1700 or 3300 ppm), and an assumed constant Darcy velocity along the flow line (U = 1 m/y).
Parameter sensitivity study
The porosity variation is proportional to the velocity at any location (x) of the flow line (Fig. 5). Thus, if we consider similar flow condition as those previously mentioned (Tf = 50 °C, pCO2 = 3300 ppm, L = 100 km, t = 5 My), but a Darcy velocity of 100 m/y instead of 1 m/y, then the calculated porosity variation will be two orders of magnitude higher than previously calculated, i.e. 1%. This value remains lower than the expected one based on petrologic data (Casteleyn et al., 2010). To reach the 10% value, the Darcy velocity should be about 1000 m/y, yet this high value seems unrealistic for a deep fluid flow.
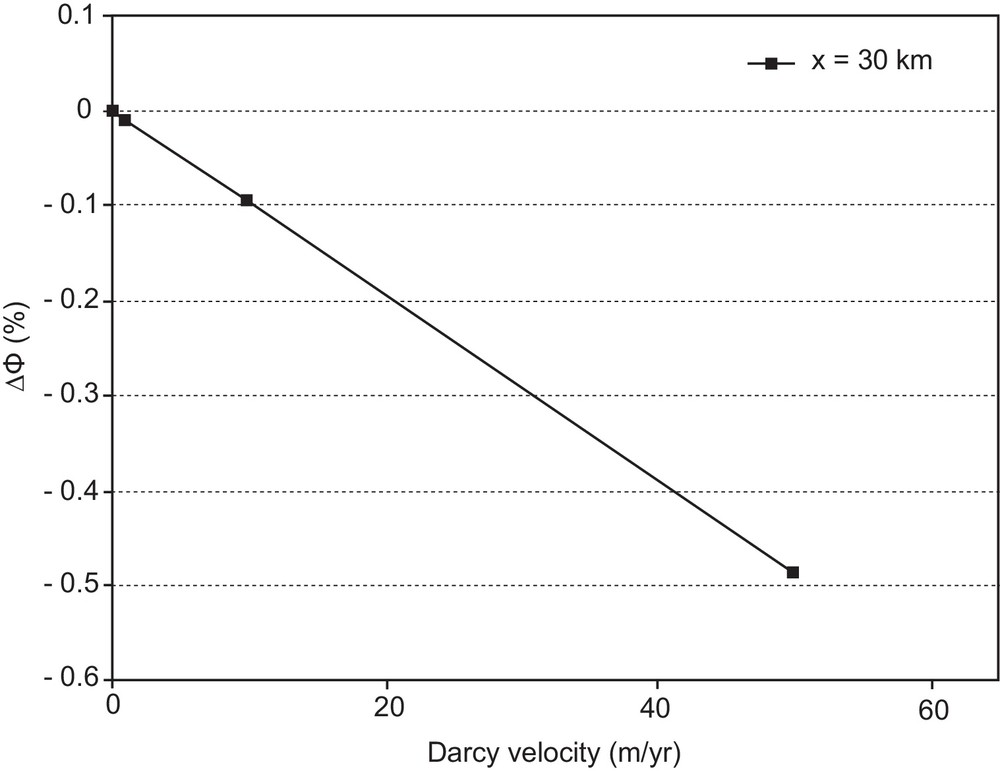
Porosity variation ΔФ along the flow line after 5 My as a function of Darcy velocity, U (1, 2, 10 and 50 m/y), for different locations x (30, 50, 80, and 100 km). Maximum length L = 100 km, final temperature Tf = 50 °C and partial pressure of CO2 = 3300 ppm. The same results are obtained at any location, and the lines are superimposed on the graph.
Higher-temperature gradients dT/dL ([Tf–Te]/L) could help explain the larger change in the observed porosity. This relation is, however, not linear (Fig. 6). If the final temperature is doubled (i.e. 100 °C instead of 50 °C), then the porosity variation is multiplied by a factor 2.3. But the calculated value remains too small (Δϕ = –2.3 × 10⁻⁴).
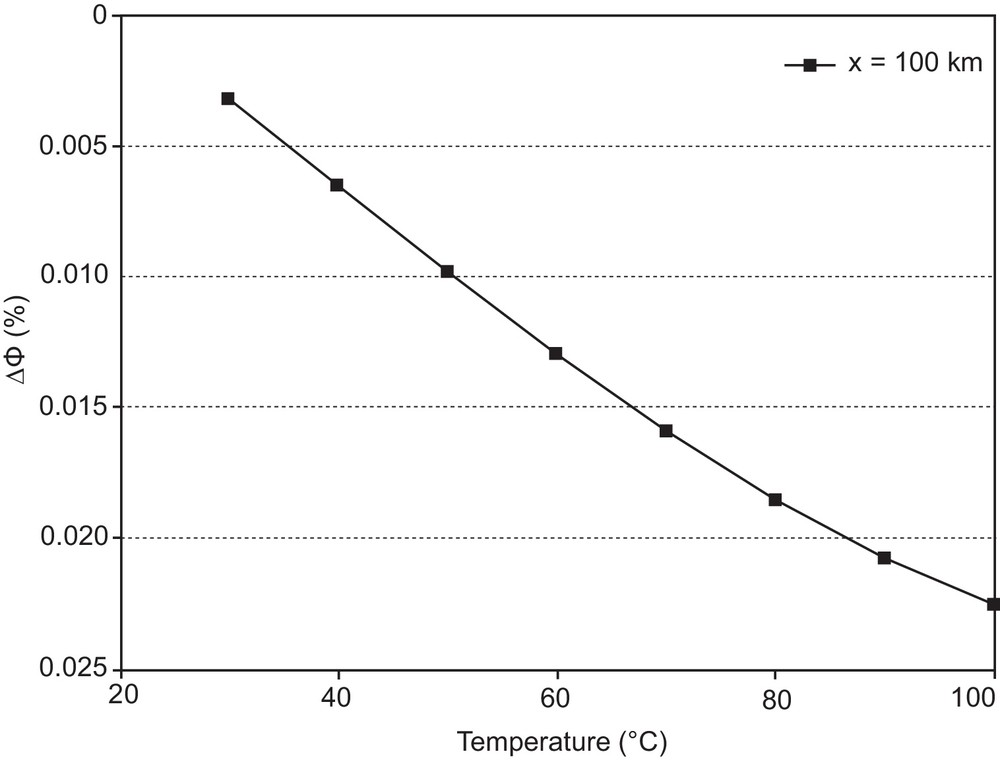
Porosity variation ΔФ along the flow line after 5 My as a function of the final temperature (Tf = 30, 40, 50, 60, 70, 80, 90, and 100 °C), for x = 100 km, maximum length L = 100 km, Darcy velocity U = 1 m/y and partial pressure of CO2 = 3300 ppm.
Increasing the maximum length of the flow line decreases the porosity variation (Fig. 7). Logically, the reduction of the flow line length increases the temperature gradient, if the temperature Tf is preserved. Thus for the same temperature variation, the volume of precipitated calcite per litre of water, due to the retrograde of calcite solubility, will be spread over a shorter distance. Locally, the reduction of porosity will increase. If we consider the estimated flow line lengths of the sectors CPB (L = 60 km) and MPB (L = 70 km), the porosity variation is multiplied by a factor of 1.69 and 1.44, respectively.

Porosity variation ΔФ along the flow line after 5 My as a function of the maximum length x = L. Darcy velocity U = 1 m/y, partial pressure of CO2 = 3300 ppm and final temperature Tf = 50 °C.
The porosity variation is also flow duration dependent. Simulations have been performed for a duration of 5 My. But a maximum duration of the flow conditions could be maintained during 33 My, which corresponds to the period of time between the LCU and LAU (145–122 = 33 My, Table 2). The calculated porosity variation for Tf = 50–55 °C and a duration of 30 My, with a Darcy velocity of 1 m/y, is equal to −0.001 (Fig. 8). Because the porosity variation is linearly dependent on the Darcy velocity, plus if this Darcy velocity is 100 m/y, and the other parameters of the simulation are unchanged (Tf = 50–55 °C, pCO2 = 3300 ppm), then for a simulation duration of 30 My, the porosity reduction is of the order of the observed value, i.e. 10%.
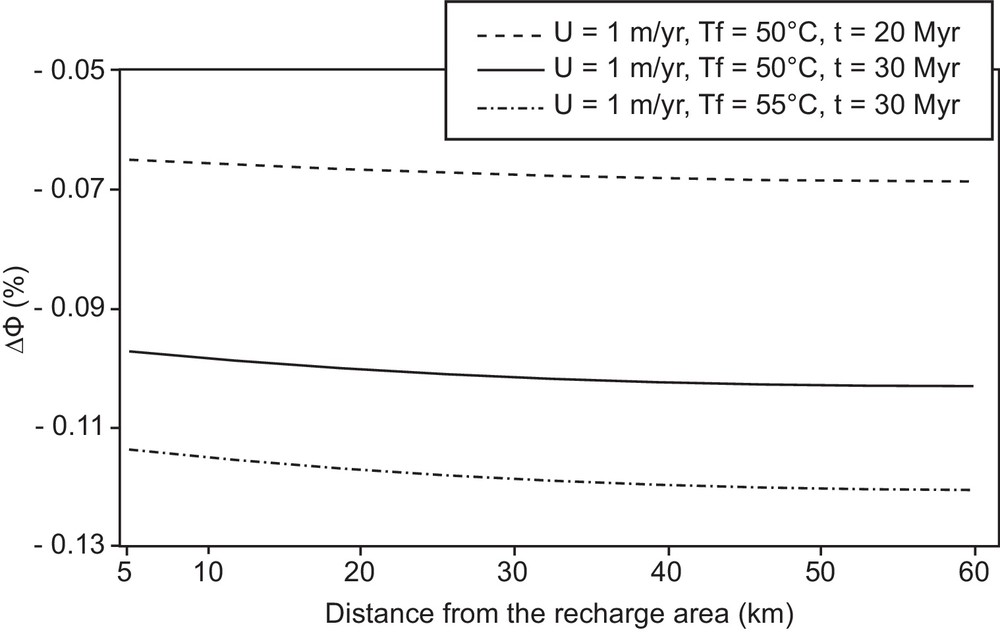
Porosity variation ΔФ along the flow line as a function of the distance to the recharge area (x = 0), for different assigned temperature ranges (Tf, 30 and 55 °C), and flow durations t (20 and 30 My). Total distance L = 60 km (representative of sector CPB, No. 1), with pCO2 = 3300 ppm, U = 1 m/y.
Parameter optimisation
As previously determined, porosity reduction by calcite cementation:
- • increases with the augmentation of pCO2 in the atmospheric recharge;
- • is proportional to fluid flow velocity, U, at any location;
- • increases with the augmentation of temperature change, ΔT;
- • decreases with the total length of the flow line, L;
- • increases with the augmentation of the flow duration, t.
For the site CPB, a 10% reduction of porosity is obtained, when all the conditions are maximized: pCO2 (3300 ppm), U = 100 m/y, ΔT = 50–55 °C and t = 30 My, except the flow line distance (L = 60 km). As flow line distances are higher for the locations MPB (L = 70 km) and SEPB (L = 130 km) than for the location CPB and temperature gradients are smaller, the Darcy velocity would need to be higher than 100 m/y for the same time duration (30 My). To obtain the expected 10% porosity reduction, Darcy velocities are increased to 170 m/y and 672 m/y for MPB and SEPB, respectively (Fig. 9). This range of high groundwater flow rates is not plausible, based on earlier studies of the basin palaeo-hydrogeology. According to basin modelling results (Gonçalvès, 2002), the maximum calculated Darcy velocity is expected to be about 50 m/y in the most permeable layers at the most suitable time of their geological history. At the present day, the average Darcy velocity obtained by flow simulation and constrained by tracers (NaCl or noble gas) on the Dogger Aquifer is about a few tens of centimetres per year (Castro et al., 1998; Dewonck, 2000; Gonçalvès, 2002; Wei et al., 1990).
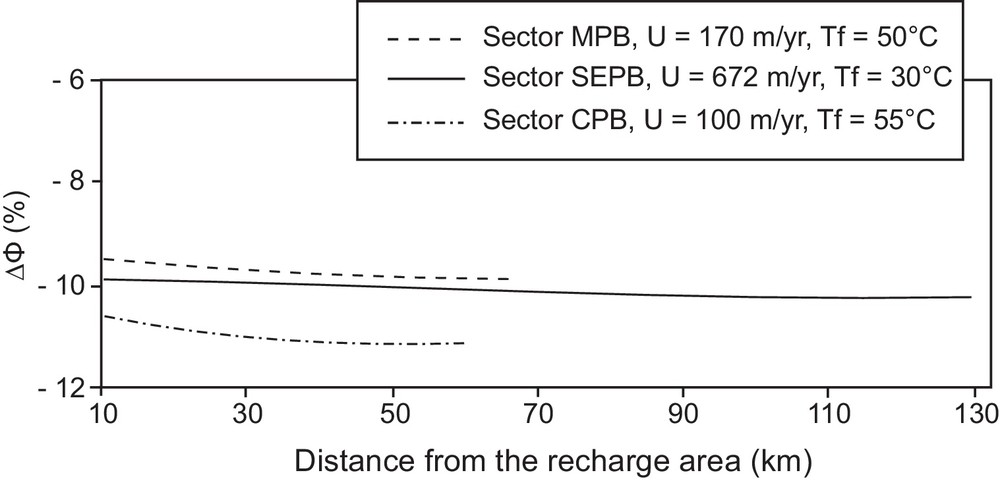
Porosity variation ΔФ along the flow line as a function of the distance to the recharge area (x = 0), for different total distances associated with different representative sectors (L = 60 km for sector CPB, n°1; L = 70 km for sector MPB, No. 2; L = 130 km, for sector SEPB, No. 3). Different values of the Darcy velocity U and of the temperature range Tf are assigned to each sector. pCO2 = 3300 ppm and time duration t = 30 My.
Our results show that carbonate precipitation reactions associated with the gradual heating of meteoric groundwater (recharged at the outcrop belt) cannot explain the observed 10% reduction in porosity. Other processes must be at play, which are not represented by our simplified 1-D model.
5 Discussion
Basin flow models (hydro-thermo-mechanical basin model, e.g., NEWBAS, Belmouhoub, 1996: Bruel et al., 1999) proposed a plausible renderings of heat flow, thermal evolution, porosity, and fluid flow (Gonçalvès et al., 2003, 2004a, 2004b, 2010). In computational models, fundamental inputs are the geometry, lithology, facies and geological history (scenario). In terms of hydrogeologic systems, two main models with different concepts or scenarios have been proposed for the deep Bathonian saline aquifer of the Paris Basin. The aim of such modelling studies is to understand the origin and the path of fluids that allowed them to precipitate as cements. These fluids are not yet completely constrained because this needs multi-proxies and multi-sites studies. And even so, Triassic fluid migration, clay barriers, fault activities, compaction, have to be taken into account in the modelling of the Paris Basin fluid palaeo-circulation. Two basic models are agreed upon here, the first one being proposed by Vincent (2001), Vincent et al. (2007) and Brigaud et al. (2009b), while the second one is proposed by André (2003) and Gonçalvès et al. (2003, 2004a). For both models, two stages are recognized: one with lateral and downward circulation through limestone aquifers directly connected to surface water and the other one with vertical upward flow focused within major fault zones water (Buschaert et al., 2004). Table 1 reviews the venue assumptions of the proposed fluid palaeo-circulation.
For the Cretaceous fluid palaeo-hydrogeologic circulation model, meteoric water recharge for the grainstone cement precipitation are associated with the geodynamic history. Some cement may have precipitated from Oxfordian infiltrated fluids. During the Late Tithonian, the eastern Paris Basin was likely emerged. The meteoric fluid recharge, from which most of the cements are precipitated, would have formed at this period (Vincent, 2001). Between the Early and Late Cretaceous, the basin is once again emerged, but this time in the northern part (Ardennes). This emergent basin margin prevailed for the LCU (Guillocheau et al., 2000; Berriasian, Early Cretaceous), which corresponds to the uplift of the London–Brabant massif. This unconformity is the first sub-aerial exposure, and the result was soil development and karstification of Jurassic carbonates that are present over a broad geographical area on the northern Paris Basin margin. This suggests a recharge zone location in the North of the Paris Basin for the Oxfordian and Kimmeridgian carbonates (Vincent et al., 2007). Brigaud et al. (2009b) used carbon and oxygen stable isotopes to characterize the nature of the palaeo-hydrological circulation and confirms the palaeo-hydrogeologic conceptual model proposed by Vincent et al. (2007), and it can be extended to the Dogger Limestones. They proposed a second uplift event that occurred in the Early Cretaceous (LAU) and affected the same formation. The recharge zone is localised in the North of the Paris Basin, as suggested by Vincent's et al. (2007) results.
For the Tertiary fluid palaeo-circulation model, the study of André (2003) was partly based on δ18O analyses in crystallised gashes or hydrothermal veins. The assumption of common parent fluid for both fracture mineralisation and sediment cements is needed here. During or right after the erosion of the Cretaceous chalk, meteoric recharge occurred at the eastern and southeastern rims of the Paris Basin. While the fluids are moving towards the west, their isotopic composition is reequilibrated. Tectonic faults or deformation could locally influence this palaeo-circulation. The model of Gonçalvès et al. (2003, 2004a) takes into account the modification of the fluid path in the Dogger triggered by salt and heat transport (migration from Keuper formations) and by the hydrodynamic role of the Bray fault. The major diagenetic event (maximal burial) likely occurred at the transition between the Late Cretaceous and the Early Tertiary (Gonçalvès et al., 2003), whereas it was previously suggested that it occurred during the Early Cretaceous. Therefore the subsequent erosion of the chalk occurred in the Tertiary. The recharge of meteoric fluids, which was synchronous with the Tertiary erosion (karstification), was located in the northwest. The model obtained from fluid inclusion analyses suggests an age of 50 My (Early Eocene) for the Dogger calcite cements (Gonçalvès et al., 2010).
Our results from 1-D reactive transport simulations along a flow line and parameter sensitivity analysis suggest that diagenesis processes driven by meteoric water recharge cannot exclusively cause the 10% decrease of porosity and that the models proposed in the literature related to the processes of cementation of the Oolithe Blanche Formation and its reservoir properties cannot be retained. Other processes might be involved, such as: (i) infiltration of meteoric water along the main active fault at this time (e.g., Bray Fault, Saint-Martin de Bossenay Fault, Fig. 1); (ii) Upward migration of deeper and warm fluids from Triassic formations along faults during the immersion period in between LCU and LAU; (iii) convergence of 3-D flow lines towards the centre of the basin and coming from the basin perimeter outcrops; and (iv) diagenetic processes driven by pressure-solution process (Elsworth and Yasuhara, 2010; Gillon et al., 2010).
6 Conclusion
In the Paris Basin, the reservoir properties of the Oolithe Blanche Formation and their distribution are now better known and are related to diagenetic events (variability of cementation) and palaeo-fluid flow circulation phases. Modelling the diagenetic processes and fluid flow history of the Bathonian reservoir formations of the Paris Basin is now fundamental to better understand the repartition and the origin of the reservoir properties of this deep saline aquifer. Several concepts have been proposed in the literature for diagenesis (cementation) of the studied formation, and our main objective was to test these hypotheses with mathematical models, as represented by numerical codes. Our results from 1-D reactive transport simulations along a flow line and our parameter sensitivity analysis suggest that the hypothesis proposed in the literature and related to the processes of cementation of the Oolithe Blanche Formation could be reconsidered, and that other processes must be involved. Understanding the reaction kinetics of calcite, in particular under the conditions of the recharge zone, may be a future work avenue.
Acknowledgments
This work was partly funded by the CNRS INSU-CESUR project and was supported by the French Geological Survey (BRGM, “Bureau de recherches géologiques et minières”, Orléans, France). We would like to thank P. Audigane and E. Lasseur for their support. We acknowledge the two reviewers, Grant Garven and Étienne Brosse, for their constructive comments.