

1 Introduction
This study shows the method of using effective reflection coefficients (ERC) to recognise geophysical complexes at great depths. Data processing was aimed at finding a possibility to improve the correlation of seismic reflection boundaries. For this purpose, profile GB1-III-86/89 was selected (Białek et al., 1991) in A project of deep regional reflection seismic surveys (GBS) using extended recording time to 18s. That project includes the following profiles: GB2-87/93, GB2A, GB2B-96 and 25-III-82, the results of which were presented in many publications: Cwojdziński et al., 1995; Żelaźniewicz et al., 1997; Młynarski et al., 2000, and profile GB1-III-86/89 (GB1) (Figs. 1 and 2a – yet unpublished). The main task of this study is to obtain information about the internal structure of the Earth's crust from the interval between the base of the Permo-Mesozoic succession and the Mohorovičić discontinuity (Moho) zone, including identification of deep fracture zones.

Sketch map of major tectonic elements (after Dadlez et al., 2005; Petecki, 2008, supplemented) with locations of profiles of the deep seismic research project (GBS) and profile LT7; CDF: Caledonian Deformation Front; VDF: Variscan Deformation Front; TESZ: Trans-European Suture Zone; TTZ: Teisseyre–Tonquist Zone; STZ: Sorgenfrei-Tonquist Zone; TEF: Trans-European Fracture; SAF: Stralsund–Anklam Fracture; NGM: North German Massif; EEP: East European Platform.
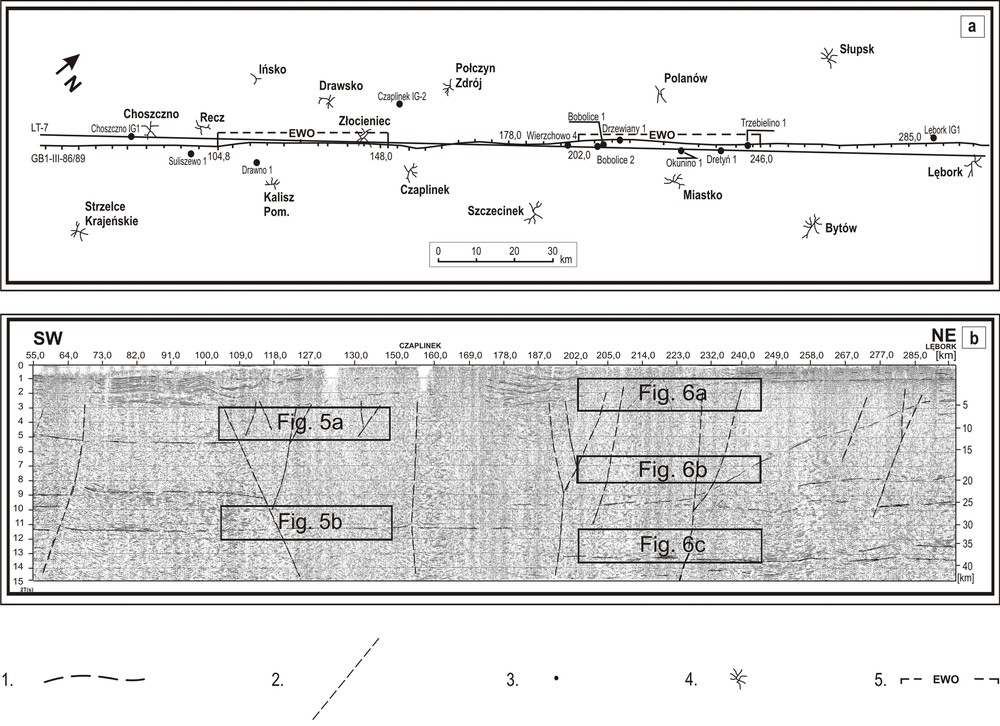
Location sketch map for the deep reflection seismic profile GB1-III-86/89 (a), and the time wave section of reflection profile GB1-III-86/89 (processed at the Karlsruhe Institute of Geophysics, geophysical interpretation by Młynarski, 1993) with marked zones transformed in the system of effective reflection coefficients (ERC) (b); 1: major seismic boundaries; 2: regional faults; LT7: refraction seismic profile; 3: selected deep boreholes; 4: localities; 5: sectors of the seismic sections, transformed by the system of effective reflection coefficients.
Measurements performed on profile GB1 were the first deep seismic records in Poland obtained using the reflection method. This is a very important profile because of its course and linkage with the LT7 profile of “Deep Seismic Sounding (GSS)” (Guterch et al., 1994), and its location in relation to areas of similar investigations carried out in NW Europe, particularly in Germany (DEKORP-BA Research Group, 1999).
Over several years and in several sectors, the implementation of fieldwork along profile GB1 proved to be unfavourable from the point of view of research results. The quality of basic materials and the developed seismic wave section is variable (Białek et al., 1991; Fig. 2b), both horizontally along the profile and vertically in individual complexes of crustal rocks. The reason for this variability is most probably the impact of surface conditions and the relationship between the recorded wave image and the elements of deep geological structure, especially tectonic zones, both in the sedimentary formations and deeper. The Permo-Mesozoic sedimentary rocks are dominated by seismic reflections correlative in a continuous mode. The distinctness and continuity of reflections in the sub-Zechstein rocks are definitely deteriorating. In the seismic section, the interface separating the complex of sedimentary rocks from the crystalline basement is drawn conventionally and ambiguously on the basis of the overall seismic reflection pattern image. Seismic reflections occur sporadically under the complex of sedimentary rocks to a depth of 20–25 km. The depth interval of 25–45 km is characterised by increased reflectivity and a marked increase in the energy of reflections.
Field records from the profile were subjected to processing at the stage of report development (for archiving), using a wide range (different variants) of processes; however, they failed to provide sufficiently clear seismic sections. The drawback is the lack of identifiable, distinct dynamic features of specific reflection groups, making it difficult to unequivocally distinguish the depth intervals associated with the geological complexes.
In this situation, an attempt to transform the traditional wave section into effective reflection coefficients (ERC) sections was made, using the field materials reprocessed at the Geophysics Institute of the University of Karlsruhe (Germany) (Młynarski, 1993). The analysis was made on two selected sectors of the profile from depths of 104.8–148 km and 202–246 km, at appropriate time intervals (Fig. 2a and b), in zones of occurrence of deep fractures bounding, from the southwest and northeast, one of the most important structural elements of Europe, which is the TESZ (Trans-European Suture Zone). This zone is identified with an elongated crustal block where the Palaeozoic structures of western and central Europe are in contact with the Precambrian structures of eastern Europe (Pharaoh, 1999). It is covered by a thick Permian–Mesozoic succession of the Polish basin, and by a thin Cenozoic cover (Dadlez et al., 2005).
The first deep fracture zone situated in the southwest is correlated with the TEF (Trans-European Fault) zone, which is the continuation of the NW–SE-trending Stralsund–Anklam Fault (SAF) running along southern Rügen, and is probably connected with the TESZ in Poland (Hoffmann and Franke, 1997). The second deep fracture zone located in the NE part is correlated with the southwestern edge of the East European Platform (EEP) and the NE boundary of the TTZ (Teisseyre–Tornquist Zone) covering the area of Caledonian Deformation Front (CDF). These are also gradient zones associated with a rapid change in magnetic field nature, presented in the map of magnetic anomalies (Petecki, 2008).
The results are so interesting in different aspects that their presentation seems justified. An interpretation of the profiles refers to results of other geophysical and geological studies performed in Poland and Germany. These are, among others, data from deep boreholes and results of reflection and refraction seismic studies characterising the Earth's crust structure near the study areas.
The complex geological structure of the TESZ, considered against a broader tectonic background, has been the subject of interest to researchers of the crustal structure (e.g., Berthelsen, 1992; Geisler et al., 2008; Jóźwiak, 2013; Katzung, 2001; Narkiewicz et al., 2011). Its importance is emphasized by numerous, often international geophysical survey programmes. The results of these studies are reflected in published papers discussing various research aspects (e.g., DEKORP-BA Research Group, 1999; Ernst et al., 2008; Janik et al., 2005; Knapmeyer-Endrun et al., 2013; Narkiewicz et al., 2015; Środa et al., 2002).
2 Methods of analysis and interpretation of ERC sections
The basic principles of the method of effective reflection coefficients, referred to as Repack, were developed in the USSR at the SibGeo (Novosibirsk) in the 1980s (Rudnickaja et al., 1987). The method is widely used today (Kurchikov et al., 2014) in many regions of Russia, including interpretation of deep seismic surveys (Rudnickaja et al., 2008). In Poland, the processing system is being progressively improved and expanded based on specialist software using appropriate basic algorithms.
The calculation of effective reflection coefficients (ERC) allows for the transformation of the seismic wave image into an impulse form of seismic records, i.e. into a time sequence of reflection coefficients representing the successive layers composing the investigated geological environment. The method uses one of the most important features of seismic record–amplitude, size, which is assumed to be proportional to the reflection coefficient value for a specific geological boundary.
The mathematical-physical model of the geological environment is the so-called convolutional model, according to which the seismic trace is the result of a combination of reflection coefficients of elementary seismic signal. Deconvolution of seismic trace amplitude allows us to present the seismic trace as a series of coefficients.
The processing scheme involves three stages: determination of the elementary impulse, multi-phase cross-correlation of the impulse with the seismic trace, standardization using statistical analysis to visualize the seismic image (horizontal and vertical stacking).
The primary function of the system is to determine the shape of the elementary signal and to provide the impulse characteristics of the rocks. Determination of the elementary seismic signal is made by stacking the consecutive groups of reflected waves for the given trace, brought to the same phase and common time of record. In this study, special attention was paid to the selection of appropriate elementary impulse for individual time intervals, which is preceded by many tests.
The function of cross-correlation of elementary seismic signal with each seismic trace allows us to convert the wave seismic trace into time series (of zero-phase amplitudes of elementary waves) called effective refractive indices. It marks, in the form of times, the places of maximal correlation of the signal with the reflected waves in the form of a coefficient and the sign of amplitude.
The sections are presented in the form of horizontal and vertical graphics. This method utilizes the relationship between the value and sign of the reflection coefficient and the stratal velocities. It facilitates tracing, along seismic sections, of changes that take place on the boundaries generating reflections, and of lithological changes within the strata.
By using the attributes of the impulse section and the sign of the reflection coefficient, the intensity of the reflected wave, and the location of the reflector, the efficiency of identification and correlation of seismic boundaries, with simultaneous characterization of the geometrical and physical system of strata composing the geological environment, is enhanced.
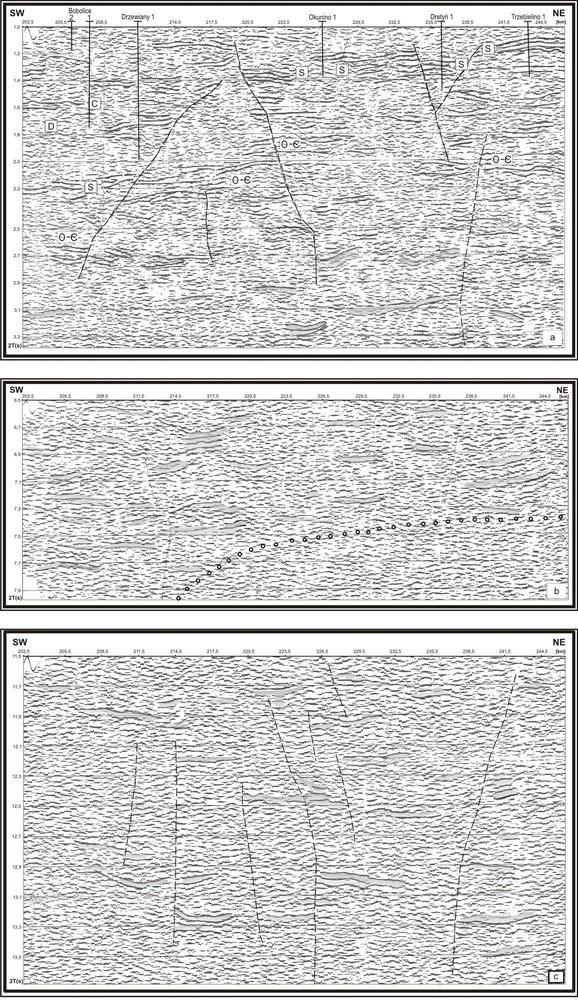
Disturbances of the system of horizons reflect the changes in physical properties of the individual strata. The demonstrated greater number of disturbance zones in the seismic image, as compared with that seen in the interpreted wave sections, results from the high potential of the method and is associated with a diverse nature. The cause of the disturbances may be the existence of tectonic deformation and/or lithological changes (lines of tectonic and/or lithological discontinuities). The assessment of the usefulness of the method is facilitated by the comparative use of wave images from a selected (first upper) portion of the section GB1-III-86/89 (see Fig. 2b) with the relevant parts of the time-converted sections developed as the ERC version: without and with interpretation (Fig. 3a–c).
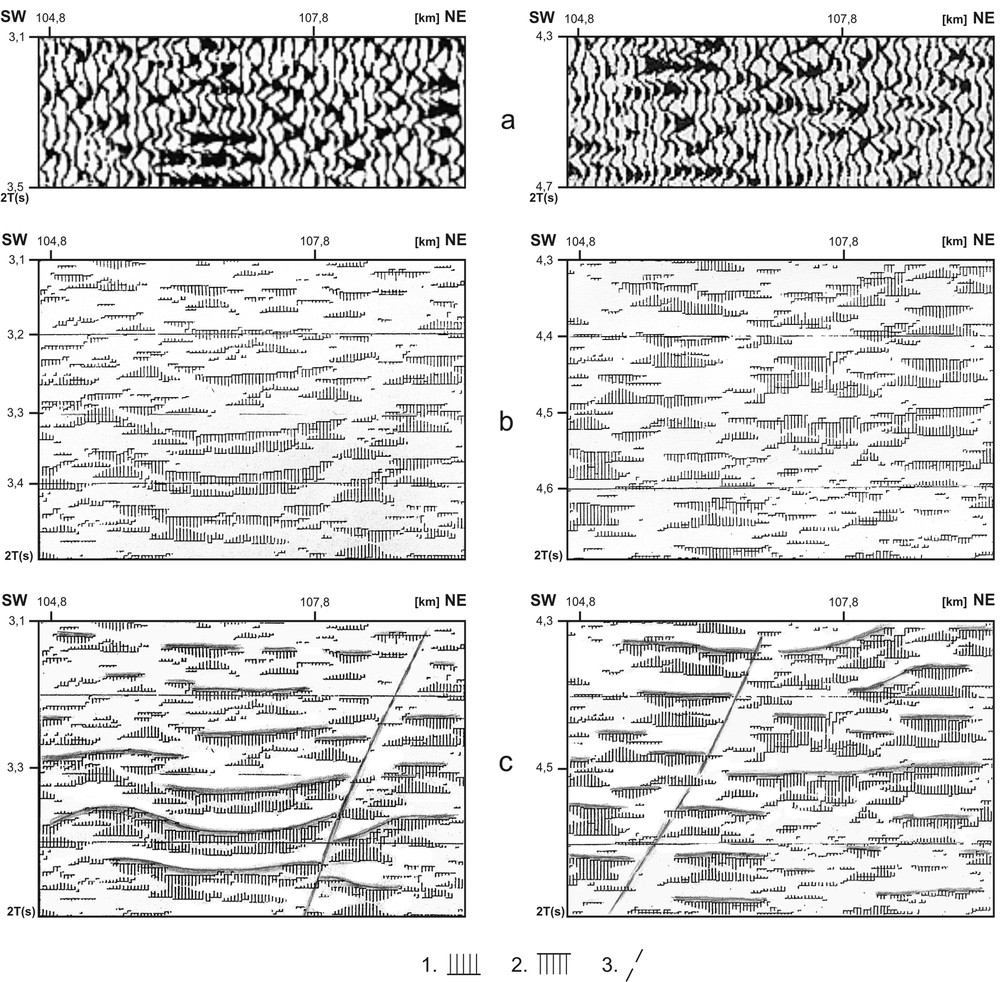
Comparative chart for the two parts of profile GB1 (from the first upper section): wave image (a), ERC section, uninterpreted (b), ERC section, interpreted (c). Effective seismic boundary with the sign of coefficient: 1: positive, 2: negative; 3: seismicline of tectonic and/or lithological discontinuity.
So far, this method has been used in Poland for a number of projects to a more precise identification of geological strata defined on the basis of reflection seismic surveys. It was successfully used, e.g., to trace lithological changes in Carboniferous formations of the Lublin Graben (Dziewińska and Jóźwiak, 2000) and to stratify Zechstein deposits in the NW margin of the Holy Cross Mountains (Dziewińska and Petecki, 2004). The possibility of using the impulse seismic record was proposed to study prospective resources of copper and silver (Cu–Ag) deposits (Speczik et al., 2011), as well as to examine the suitability of some geological structures for potential CO2 storage (Dziewinska and Tarkowski, 2012; Dziewińska et al., 2011).
3 Refraction seismic data
The essential information for determining the relief and depth to the base of sedimentary rocks provides the seismic refraction boundary correlated with the top of the crystalline basement.
A detailed discussion of the results obtained, among others, in the area of our analysis is included in published synthetic studies (Młynarski, 1984, 2002) and in a final (archived) report (Wojas and Hałoń, 1980). They are source of knowledge presented below. Fig. 4 shows a structural draft of a consolidated basement (unpublished), in which the interpolation of contour lines was performed using a mathematical averaging method. This is a boundary within the Precambrian Platform with a Vg of approximately 6000 m/s, correlated with the top of Precambrian crystalline rocks, corresponding to a sharp acoustic velocity gradient at the interface with the sedimentary cover. Mathematical interpolation allows for more accurate imaging of the course of the contour lines, for capturing the trends in the correlation between the profiles, and for the identification of the course of structures that are difficult to discern. Considerable depth changes can be seen at this refraction level; there is also a possibility of identification of zones of disturbances. Depth changes in this refraction boundary can be due to vertical displacements of the local basement blocks.
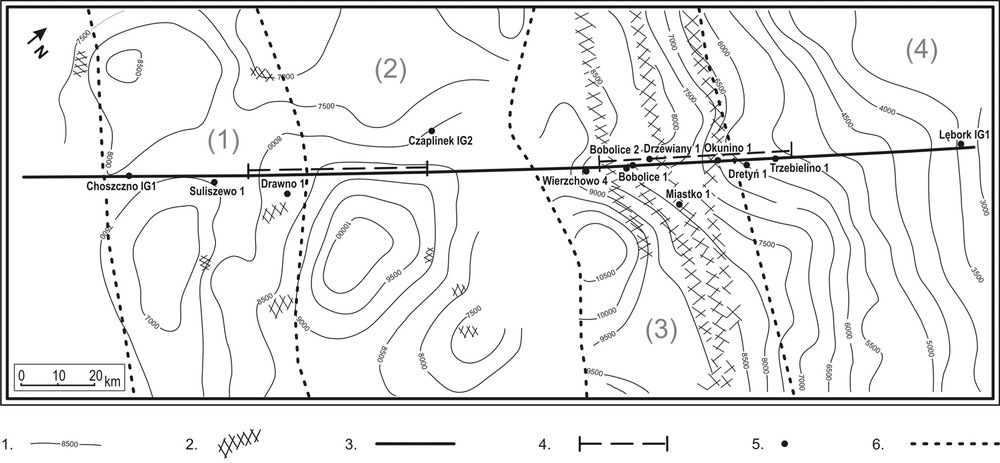
Structural sketch map of the refraction boundary of Vg ∼ 6000 m/s, correlated with the consolidated basement – (from Wojas and Hałoń, 1980, modified and supplemented by the authors); 1: contour lines (in metres) of refraction boundary Vg ∼ 6000 m/s; 2: fault zones; 3: profile line GB1-III-86/89; 4: sectors transformed by the ERC system; 5: selected deep boreholes; 6–boundaries of tectonic-structural units in Poland (Dadlez, 1998): Szczecin Trough (1), Pomeranian Swell (2), Pomeranian Trough (3), Łeba Elevation (4).
Complementary material for the interpretation of sub-Zechstein complexes is provided by a shallower refraction boundary of Vg 5500–5800 m/s (Młynarski, 1984, 2002; Wojas and Hałoń, 1980).
4 Interpretation of ERC sections and an analysis of the results
The first upper sector at 2.9–5.1s (Fig. 5a) of the profile is poorly documented by geological data below the Zechstein base. It includes the basement rocks in the Szczecin Trough (southwestern part) and the Pomeranian Swell (northeastern part). The ERC image depicts the sub-Permian (probably) basement divided into blocks, represented by Carboniferous–Devonian and older complexes.
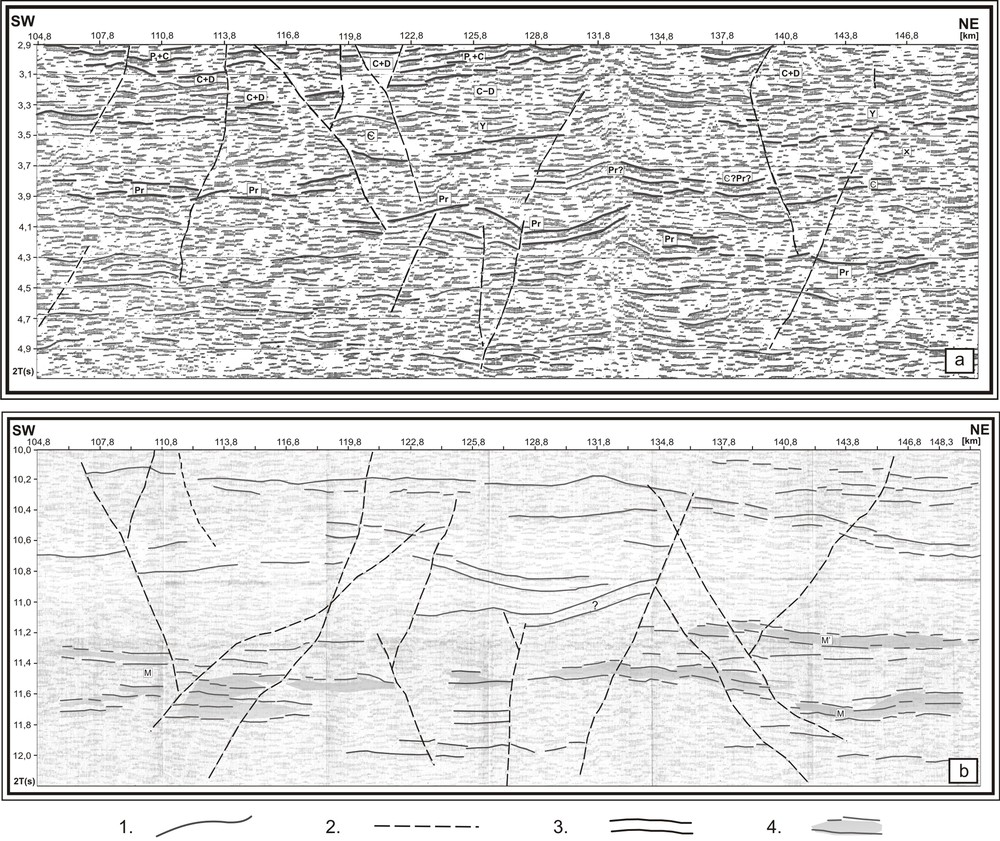
Time-converted seismic section transformed by the method of effective reflection coefficients (ERC) – interpreted by the authors based on materials from Młynarski (1993). First sector: 104.8–148.0 km (deep fracture zone bounding the TESZ from the SW); upper (a): time 2.9–5.1 s; lower (b): time 10.0–12.2 s; M, M’: seismic horizons correlated with the Moho; 1: boundaries and layers of effective reflection coefficients; 2: seismic lines of tectonic and/or lithological discontinuity; 3: boundary of areas with different geological structures; symbols of boundaries: P1: Rotliegend, C: Carboniferous, D: Devonian, S: Silurian, θ: Ordovician, €: Cambrian, Pr: top of the consolidated basement, x: complex x, y: complex y.
Taking the correlation of reflection coefficients with the interpretation of the refraction boundary of Vg ∼ 6000 m/s (Fig. 4) into account, the clear horizon in the southwestern part of the profile at ∼ 3.9 s should be regarded as the boundary line corresponding to the top of the consolidated basement (Pr) (see Fig. 5a). There is a relatively sharp descent of the Pr boundary to ∼ 4.1 s with an elevated block-like area visible in the middle of the section, in the area to the northeast of 118 km. The dipping of the horizon within the time interval of 4.1–4.3 s is a distinctive feature in the northeastern part of the seismic line in the area of the Pomerania Swell. The second version for the northeastern part of the profile (Pr?), showing considerable elevation of the consolidated basement (∼ 3.8 s), seems to be less likely. There are variably dipping short boundaries observed within the complex overlying horizon Pr in the western part of the profile, which can be interpreted as the effect of folding (?) of these deposits.
The change in the nature of seismic record visible to the northeast at 118 km may indicate that the sub-Upper Palaeozoic basement is comprised of different rocks, marking these Lower Palaeozoic complexes on the profile with the symbols x and y. The suggestion about the occurrence of unfolded Lower Palaeozoic rocks applies to the interval of 118–130 km or further to 150 km.
In the proposed interpretation, the first sector would consist of two areas of different geological structures, with a boundary at ∼ 118 km, which can be correlated with a deep fracture zone of the TEF.
A similar interpretation is also suggested by a different nature of deeper parts of the Earth's crust at 10–12.2 s (Fig. 5b) in both of these areas (boundary at 118–120 km). In the central and northeastern parts, there is a multilayer structure bounded by seismic discontinuity zones. Many horizons of different dips coalesce with each other and split, or intersect. This zone can be divided into two separate blocks by a series of discontinuities forming an inclined plane. It can be assumed, in accordance with the origin of seismic discontinuities, that this is a surface representing a contact between rocks of various physical properties, formed by, e.g., fracturing and the rigid displacement of a rock body.
These horizons are, however, less deformed, in the southwestern part of the seismic section. This zone is characterised by an almost horizontal pattern of seismic boundaries.
In the profile, we can see an increase in reflectivity within the area corresponding to a time interval of 11.3–11.8 s. The horizons occurring at the bottom of longer groups of reflection coefficients correspond to an increased energy of waves in the lower crust beyond the Moho–the position of this boundary is about 11.5 s, which coincides with a depth of ∼ 32 km. The presented location and the estimated depth to the Moho in the study area are close to the boundary defined by refraction data in profile LT7 (Guterch et al., 1994) (∼12.5 s). The interpretation along profile GB2B-III-96 (Petecki, 2008) also shows that the Moho occurs within a time interval of 11.5–12 s in this zone.
The correlation of longer horizons with the Moho surface (M’) at a greater depth indicates a different, but less probable interpretation. The same applies to the horizons identified in a traditional seismic wave section (Białek et al., 1991) at a depth below ∼ 40 km. Discontinuity M’ may represent a variability in the crustal structure associated with the occurrence of layers of different compositions. A rock packet found between horizons M and M’ may as well be a transitional layer occurring near the Moho zone.
Structural inconsistency in the pattern of the boundaries (horizons) and the complex geometry of the seismic discontinuity zones indicate (outline) a tectonically controlled seismic structure, which is possibly a Caledonian collisional structure of the suture zone located in the Pomeranian segment of the TESZ. The fact of the possibility of finding correlation relationships with the interpretation presented in the upper section is also worth noting (Fig. 5a).
The second sector of the profile consists of three time intervals (Fig. 6a–c, respectively). There are generally seismic boundaries gently dipping toward the southwest along the upper section at 1.0–3.4 s (Fig. 6a). Drilling exploration covered only a small sub-Permian part of the profile. These are fragmentarily examined Carboniferous, Devonian, and Silurian deposits (Catalogues of boreholes of the Petroleum Industry in Poland, 1971–1989). In the interval of 210–220 km, the seismic section is intersected by a fault zone referred to as the Koszalin–Chojnice Zone, with the downthrown southwestern side. This segment is characterised by the presence of not only horizontal boundaries, but also a series of distinctly oblique layers, which may illustrate the Lower Palaeozoic deposits that are thrust over the hanging wall, thereby defining the Caledonian Deformation Front (CDF) and the northeastern boundary of the TTZ.
Time-converted seismic section transformed by the method of effective reflection coefficients (ERC) – interpreted by the authors based on materials from Młynarski (1993). Second sector: 202.0–246.0 km (deep fracture zone bounding the TESZ from the northeast); upper (a): time 1.0–3.4 s; middle (b): time 6.5–7.95 s; lower (c): time 11.5–13.7 s; for explanations see Fig. 5.
A platformal Carboniferous–Devonian (Bobolice 1 and 2; Drzewiany 1) complex, which uncomfortably overlies older rocks to the southwest of the fault zone, within the sub-Permian complexes of the down-dropped block, can be interpreted in the ERC section. The rocks are defined by a zone of variously dipping boundaries observed at 2.2–2.7 s. It roughly corresponds to the depth of occurrence of a refraction horizon of Vg 5800–5900 m/s (Wojas and Hałoń, 1980). There is a set of reflection coefficients below, which could represent the top of folded Palaeozoic rocks. The base of this complex can be drawn along the boundaries occurring near the refraction horizon of Vg 6000–6100 m/s (see Fig. 4).
The situation is different to the northeast of the fault zone. The northeastern sector of the profile is located within the East European Platform devoid of Upper Palaeozoic sediments, except for the Permian. In light of the presented interpretation, the seismic section around the northern flank of the fault zone cuts the edge of the East European Platform. The Okunino 1 borehole, located in this area, reached the faulted Silurian (Ludlow) deposits under the Permian. The boundaries of the Silurian complex at the end of the northeastern sector dip toward the south, and lie nearly horizontally further on.
Within the zone between 230 and 250 km, the proposed interpretation suggests a considerable thickness of Early Palaeozoic formations (Cambrian–Silurian). This is a platformal complex, assuming that the Silurian deposits in the Dretyń 1 and Trzebielno 1 boreholes are unfolded. Any consideration of the concept of Caledonian folding would require a reinterpretation of the drilling data.
The boundaries coinciding with the base of sedimentary series are determined along the entire length of the seismic section in accordance with the results of refraction surveys. The refraction boundary that is generally related to the consolidated basement in the northeastern part of the section corresponds to the top of Precambrian crystalline rocks.
Fig. 6b (middle sector at 6.5–7.95 s) shows a division into zones of different structures: (1) the upper zone that covers most of the reprocessed sector of the profile with a number of reflection boundaries recorded, most probably representing Lower Palaeozoic formations, and (2) the lower zone below–an almost unreflective zone that characterises the upper part of the crust. It is assumed that the zone of seismic “silence” may indicate homogeneity of the rock environment from the seismic point of view (Guterch et al., 1994).
The zone presented in Fig. 6c (lower interval at 11.5–13.7s) is characterised by almost horizontal seismic boundaries and the occurrence of slight vertical displacements. The pattern of boundaries suggests a layered structure disturbed by fault zones or lithological discontinuity lines. The seismic reflections indicate a significant reflectivity of the rock formations, but the traceability of the boundaries based on a correlation of single coefficients is poor. Such a nature of the seismic field is indicative of considerable variability in the physical properties of rocks and is assigned to the lower part of the Earth's crust, which typically shows a laminar seismic fabric. This zone is composed of thin layers (layered zone), but the distances between the individual “packets” of boundaries are quite long, and therefore the above-mentioned frequent breaks in correlation are observed. The clear horizontal boundaries reflect its laminar nature. The identified seismic lines of tectonic and/or lithological discontinuity and their correlation were determined based on the pattern of reflection coefficients.
The resulting material does not authorise to determine whether there is the homogenous layer of the upper crust in the study area. The only likely transition area between the structure of homogenous and laminated layers can be possibly indicated at the top of the southwestern part of the section. The present interpretation, namely: the clear horizon at the top, the zone of seismic “silence” below, and the zones of variously dipping seismic boundaries, is an attempt to provide the grounds to indicate such a boundary between areas of different structures.
Seismic records show that the Earth's crust structure has a layered nature.
The interpretation of the stratification of the laminar crust, as well as its variability, which are shown in the ERC sections, are much richer in relation to the possibility of wave image interpretation. The presence of numerous deeply rooted tectonic zones and lithological discontinuity lines, reflected in the ERC seismic image, proves a very complex structure of this area. The Moho, which separates the crust from the mantle, is estimated in this area to be at a depth of more than 40 km (Białek et al., 1991), which is beyond the range of the presented data.
5 Discussion
The transformation of seismic wave sections into ERC sections has provided new materials for the analysis of results.
The interpretation shows the possibility of identifying a number of changes in the course of seismic boundaries, invisible in the conventional record. This is better seen in the upper intervals. In the case of the lower time intervals, the distinctness of correlative boundaries is smaller and the identified faults are less reliable in comparison with the upper part. The change of the processing system affected significantly the image of seismic sections, often by modifying the geometric arrangement of strata. The identification of layers with different reflection coefficients provides material to reconstruct the structure of the rock formations.
A comparison of the results shows the essential role of data processing, and determines the possibility of using the ERC version for the exploration of sub-Zechstein deposits of the Earth's crust down to the Moho discontinuity. It should be noted that the correlation depends on the quality of seismic boundaries, and is much easier on the ERC section as compared to the conventional seismic section (Figs. 2a and 3a–c), and has a greater justification. It results from the advantages of using the transformation system that is based on the usage of dynamic features of the seismic record.
The length of effective reflection boundaries and the sign and value of reflection coefficients are assumed as the basis for distinguishing and correlating marker boundaries. Their direction and amount allow for the construction of boundaries separating the rock mass layers of different physical parameters. As a result, the quality of the images is improved. The identified seismic boundaries underline the recorded tectonic features and the thickness changes in rock complexes that occur between the boundaries. The pattern of seismic discontinuities and the visible displacements of seismic horizons are the basis to interpret fault zones and/or lithological discontinuity lines. Discontinuity zones mark breaks in the correlation, which are arranged in a single line at many levels, or zones of short sections of correlations arranged in a single line.
The interpretation has provided a number of new important data allowing for a further approximation of the image of the deep geological structure in the Trans-European Suture Zone. The results enable the verification of views on the geological structure of the marginal zone of the East European Platform and adjacent areas located to the southwest, and can be a contribution to discussions and to the creation of new geological concepts. This interpretation can be used in attempting to determine the intricate relationships between the tectonics of the sedimentary cover and of the deeper parts of the Earth's crust. Within the windows defined by the time intervals, the presented ERC version sections can also be helpful in indicating the general directions of continuation of the observed structural elements, and for regional interpretations of deep crustal zones, including the areas located to the Northwest of Poland.
The interpretation of the ERC sections, presented in this study, provides information about the contact between the crust of the craton and the crust of the Palaeozoic platform. Data acquired based on the analysis of seismic materials along profile GB1 can reflect the existence of a collisional structure in the Pomeranian segment of the TESZ. They suggest the occurrence of a collisional tectonic suture in this region, located between two crustal blocks (contact zone between the platforms). Similar conclusions were drawn by Petecki (2008) based on the interpretation of magnetic data supported by seismic and gravity data, who also postulated a tectonic model of the Caledonian collision between the East Avalonia and Baltica continents in the Pomeranian segment of the TESZ, with a possible participation of an additional crustal block of unknown origin. One of the versions assumes that it may be a crystalline crust, e.g., of a terrane type (Petecki, 2008).
The tectonic nature of the contact is suggested by the boundaries of magnetic provinces associated with distinct gradient zones. A magnetic lineament that coincides with the fracture zone in the southwestern part reflects the contact of crystalline crustal blocks, inclined toward the northeast; however, not excluding the interpretation that the contact is inclined toward the southwest. Such model, seemingly ambiguous but genetically justified (Hoffmann and Franke, 1997), is confirmed by ERC seismic data (Fig. 5b). The continuation of this zone in northern Germany correlates well with the Stralsund–Anklam fracture system (SAF), which (most probably) represents a southeastern continuation of the TEF that is considered the edge of the down-dropped craton (Hoffmann and Franke, 1997). The interpretation of profile GB2B-96 (Młynarski et al., 2000), situated southeast of the profile analysed in this study, demonstrates a deeply rooted fracture zone in the lower crust, extending down to the Moho or even to the upper mantle. The zone probably corresponds to the TEF. The exact range of the SW boundary of the East European Platform is unknown. The results of seismic surveys, showing gently dipping boundaries, reflect a gradual plunge of the edge of the Baltica plate under the Lower Palaeozoic complex of Rügen Caledonides (Krawczyk et al., 2002). The coincidence of the SAF system with the extent of Baltica is evidenced also by the results of the magnetotelluric surveys. In this light, it is assumed that the SW boundary of the EE Craton in Germany corresponds to the SAF system (Hoffmann and Franke, 1997).
The proposal to distinguish complexes x and y (Fig. 4a) suggests the possibility of the occurrence of a stable block, and provides new data for studies of the geological evolution of this part of Poland. It is possible that there is a tectonic feature in that area similar to the North German intramontane massif (microcontinent?) identified by Hoffmann in northern Mecklenburg and Brandenburg, Germany (Hoffmann, 1990). It separates two troughs filled with Rotliegend pyroclastic rocks (P1). According to Hoffmann (1990, see Fig. 2), the outer part of the Variscan orogen is thrust over the North German Massif. In the territory of Poland, a similar situation may be suggested by the presented material (Fig. 5a) in the area of distinguished seismic packages marked with y.
The second fracture zone is correlated in the Northeast with a magnetic lineament constituting a distinctive discontinuity in the magnetic basement, located near both the southwestern edge of the elevated crystalline basement of the East European Platform and a zone of crustal fractures of the TTZ bounding the TESZ from the northeast. It is important for geological analyses of the area to reconstruct the boundary and geometry of the Caledonian thrust belt, which formed as a result of the Caledonian collision between East Avalonia and Baltica (Berthelsen, 1992; Krawczyk et al., 2002). The thrust of the folded Palaeozoic rocks over the craton is documented north of Rügen (Meissner et al., 2002). Seismic profiles located in NW Europe (northwest of the seismic sections analysed in this study) define the CDF (Caledonian Deformation Front) as a structure that manifests itself in the form of southward and southward-ward dipping reflections seen in the Lower Palaeozoic and upper crust, showing the thrust of deposits over the Precambrian basement of Baltica (Krawczyk et al., 2002). The ERC sections (Fig. 6a and b) can illustrate a similar situation in the area of Poland. Seismic horizons, with their observed trend of dipping (gently) toward the southwest, point to the location of the thrust front immediately to the Northeast of the Koszalin–Chojnice Zone (at ∼ 210–220 km in the profile).
The interpretations proposed in this study make up a material that is the basis for regional considerations. The image of seismic sections processed into the ERC version, with a more clearly marked pattern of seismic boundaries as compared with the original sections (Figs. 2b and 3a), can be a used for analysis of the directions of dips of seismic horizons in relation to those observed in seismic profiles from NE Germany and the South Baltic Sea (DEKORP-BA Research Group, 1999; Krawczyk et al., 2002; Meissner et al., 2002). The nature of seismic record in the profiles from Germany and the southern Baltic Sea can result from their preferred trend, perpendicular to the extent of structures in deeply seated complexes.
6 Conclusions
The applied method of transformation of seismic wave sections into the sections of effective reflection coefficients (ERC) has delivered satisfactory results for Lower Palaeozoic and older rocks of the basement, down to the Moho. The new form of seismic record, compared to the wave image obtained for profile GB1-III-86/89 (Fig. 2b, Białek et al., 1991), significantly increases the interpretational possibility and reliability of the results, which are reflected in the illustrative material presented in this study.
The interpretation of two sectors of profile GB1 provides a more detailed image of the complex geological structure of the Earth's crust along the southwestern and northeastern edges of the TESZ.
The study has allowed for the identification of seismic boundaries of reflection coefficients by distinguishing a number of layers and complexes (among others, transition zones to the consolidated basement), and the determination of the lines and seismic discontinuity zones (including the nature and location of the two deep tectonic fracture zones bounding the TESZ), as well as the position of the Moho. The results confirm and justify the earlier concepts concerning the main tectonic features presented by the researchers in this area.
The quality of the images allows a comparison with deep reflection profiles from adjacent areas of Germany and the southern Baltic Sea. It enables correlations of the results to search for similar interpretational elements in order to create joint, more detailed concepts of the tectonic and geological structure of the Trans-European Suture Zone and adjacent areas.
The examples of the effective use of the existing geophysical materials and interpretational possibilities, presented in this study by using the effective reflection coefficient method, do not exhaust the subject. For a more comprehensive characterisation of the stratal architecture, the transformation of the entire GB1 profile within specified time intervals is recommended. It would also be necessary to use this method on a larger scale and in other areas, e.g., in the other segments of the TESZ in Poland, to comprehensively correlate the research results.
Acknowledgements
The authors express their gratitude to the management of the Central Geological Archives of the PGI in Warsaw for allowing access to archived materials used in this study performed within the framework of statutory research of the MEERI PAS.