

1 Introduction
The Earth's molten outer core is considered as consisting of Fe and 5–10 wt% of Ni, with a certain amount (8–12 wt%) of light elements, such as S, Si, O, C, and H (e.g., Poirier, 1994). The density and sound velocity of liquid Fe–Ni–light element alloys at high pressure and high temperature are key properties for understanding the composition of the outer core. “Birch's law” (Birch, 1961, 1963), which is a linear relationship between density (ρ) and P-wave velocity (VP), is considered one of the most important features for discussing the composition of the Earth's core. In addition to the Earth's core, density and seismic velocity structure models of the deep lunar interior have been proposed (Garcia et al., 2011; Weber et al., 2011). This implies that the VP–ρ relation is also important for constraining a composition of the lunar core. The validity of Birch's law has been discussed for solid metals and Fe alloys (e.g., Antonangeli et al., 2010, 2012; Badro et al., 2007; Lin et al., 2005; Mao et al., 2012; Ohtani et al., 2013), and several possible compositional models of the Earth's solid inner core have been proposed. On the other hand, the validity of Birch's law for liquid Fe–Ni–light element alloys has not been thoroughly investigated.
The value of ρ of liquid Fe alloys has been measured using the X-ray absorption method (e.g., Chen et al., 2005; Sanloup et al., 2000, 2004; Terasaki et al., 2010), sink/float method (e.g., Balog et al., 2003; Nishida et al., 2008), and X-ray diffraction method (Morard et al., 2013), while the VP of liquid Fe–S has been measured using ultrasonic techniques (Jing et al., 2014; Nishida et al., 2013, 2016), and the inelastic X-ray scattering method (Kawaguchi et al., 2017). These previous studies measured ρ or VP separately under different conditions of pressure and temperature, using different samples, and using different experimental setups. These two separate measurements for ρ and VP inevitably create uncertainties for examining the correlation between ρ and VP. Simultaneous measurement of both ρ and VP for liquid alloys is critical to overcome this problem. Recently, Shimoyama et al. (2016) reported a pioneering experiment of simultaneous measurements of both ρ and VP of liquid Fe–C using conventional X-ray absorption and ultrasonic methods. In this study, we developed another new system to measure both ρ and VP of liquid alloys by combining with X-ray tomography at high pressures and high temperatures, and measurements of ρ and VP of liquid Ni–S, an end-member component of Fe–Ni–S alloys.
2 Experimental methods
2.1 Experimental setup
High pressure experiments were performed using an 80-ton uniaxial press installed at the X-ray computed tomography (CT) beamlines (BL20B2 and BL20XU) at the SPring-8 synchrotron radiation facility in Japan (Goto et al., 2001; Suzuki et al., 2004; Uesugi et al., 1999). The experimental setup for ρ and VP measurements is illustrated in Fig. 1a. The large volume press with two windows of wide opening angles of 160, developed for CT measurement, was set on rotating and X–Y stages. Details of the press are given elsewhere (Urakawa et al., 2010). High pressure was generated using opposing cupped WC anvils with a ringed groove. The diameter of the cup was 12 mm. Monochromatic X-rays of 51 keV, tuned by a Si (311) double-crystal or Si (511)–(333) monochromator, were used. The X-ray radiography image was detected using a complementary metal-oxide semiconductor (CMOS) camera (ORCA-flash 2.8 or ORCA-flash 4.0, Hamamatsu Photonics K. K., Japan) with a pixel size of 1.50 or 2.54 μm (Uesugi et al., 2012). The CT measurement was carried out by rotating the press from 0 to 180 in 0.5–1.0 steps. The exposure time for each image was 3–5 s. The X-ray diffraction (XRD) spectra of the sample was collected using a CMOS flat panel detector (C7942-CA, Hamamatsu Photonics K. K.) to detect sample melting and determining the density of solid phase.
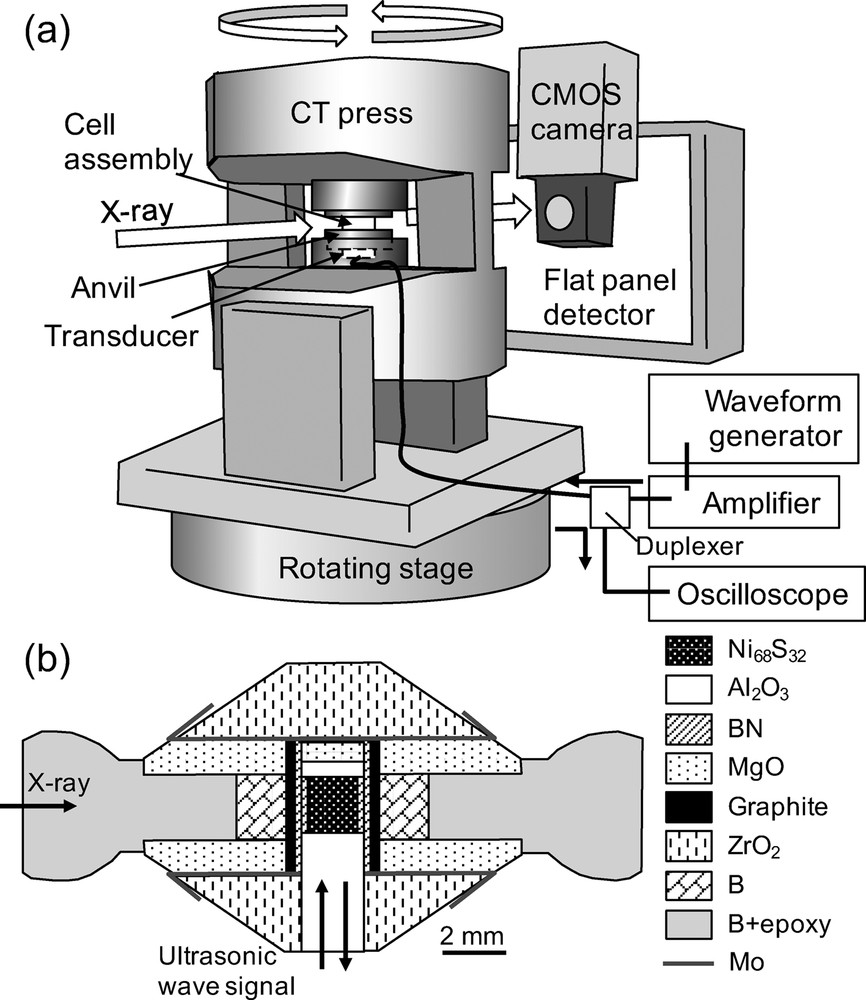
(a) Schematic diagram of the experimental setup for the ultrasonic, X-ray tomography, and XRD measurements. (b) Schematic image of the cell assembly. Monochromatic X-rays pass through in the horizontal direction at the center of the cell. The ultrasonic signal comes from the bottom side of the cell.
A schematic drawing of the cell assembly used is shown in Fig. 1b. The sample was a Ni68S32 pellet, composed of a mixture of Ni (99.99%, Rare Metallic Co., Ltd) and Ni3S2 (99.9%, Strem Chemicals Inc.) powders. The sample composition (Ni68S32) is in between the eutectic composition of the Ni–NiS system at 1 atm (Ni67S33) and that at 5 GPa (Ni69S31) (Urakawa et al., 2011). The sample pellet was enclosed in an h–BN cylinder and sandwiched between a single-crystal sapphire buffer rod and a backing plate. The surfaces of the buffer rod and backing plate were polished to mirror finish to obtain a clear ultrasonic signal. High temperature was generated using a cylindrical graphite furnace. A thermocouple could not be inserted in the cell assembly during CT measurement because of interference with CT imaging, so that the temperature was estimated from the electric power. The relationship between electric power and temperature was calibrated in separate experiments at several different load conditions using the same cell assembly with a thermocouple. The temperature difference between the thermocouple junction and the sample position was corrected using the reported melting curve of the Ni–S system (Urakawa et al., 2011). The experimental conditions of this study are summarized in Table 1.
Experimental conditions and obtained resultsa.
| Run | T [K] | P [GPa]b | Sample status | VP [m/s] | Density [kg/m3] | KS [GPa] |
| HPT17 | 523 | Ni + Ni3S2 | 6253(8)d | |||
| 663 | Ni + Ni3S2 | 3313(33) | ||||
| 685 | Ni + Ni3S2 | 3251(145) | ||||
| 705 | Ni + Ni3S2 | 3177(125) | ||||
| 747 | Ni + Ni3S2 | 3032(116) | ||||
| 780 | Ni + Ni3S2 | 3153(75) | ||||
| 885 | 1.2c | Liquid | 2506(46) | |||
| 919 | 1.2(1) | Liquid | 2492(92) | 6365(268) | 39.5(34) | |
| HPT22 | 461 | Ni + Ni3S2 | 6443(10)d | |||
| 587 | Ni + Ni3S2 | 3520(10) | ||||
| 663 | Ni + Ni3S2 | 3558(13) | 6372(7)d | |||
| 778 | Ni + Ni3S2 | 3364(118) | ||||
| 816 | 2.9(2) | Liquid | 2934(94) | 6680(40) | 57.5(37) | |
| 854 | 3.2c | Liquid | 2790(126) | |||
| 893 | 3.5c | Liquid | 2804(153) | |||
| 931 | 3.8c | Liquid | 2736(117) | |||
| 1045 | 4.6(4) | Liquid | 2860(28) | 6667(170) | 54.5(18) | |
| HPT20 | 460 | Ni + Ni3S2 | 3822(28) | 6413(13)d | ||
| 574 | Ni + Ni3S2 | 3843(16) | ||||
| 604 | Ni + Ni3S2 | 3804(8) | ||||
| 630 | Ni + Ni3S2 | 3783(12) | 6396(8)d | |||
| 661 | Ni + Ni3S2 | 3753(6) | ||||
| 695 | Ni + Ni3S2 | 3741(28) | ||||
| 719 | Ni + Ni3S2 | 3722(26) | ||||
| 747 | Ni + Ni3S2 | 3695(24) | ||||
| 771 | Ni + Ni3S2 | 3661(25) | 6341(9)d | |||
| 795 | 5.5c | Liquid | 3222(144) | |||
| 817 | 5.5c | Liquid | 3234(117) | |||
| 835 | 5.6c | Liquid | 3218(112) | |||
| 857 | 5.6c | Liquid | 3185(158) | |||
| 889 | 5.6(5) | Liquid | 3176(197) | 6896(90) | 69.6(87) |
a The numbers in parentheses indicate error in units of the last digit(s).
b
Pressures are estimated from the measured values of ρ with
c Estimated from the pressures at different temperatures with dρ/dT of 0.8·10−5 (Nagamori, 1969).
d Densities of the Ni68S32 solid mixture are calculated from the densities of Ni and Ni3S2 obtained from X-ray diffraction in these conditions.
2.2 Sound velocity measurement
Sound velocities were measured by the ultrasonic pulse-echo overlap method (e.g., Higo et al., 2009; Kono et al., 2011; Li et al., 1996). The electric signals of a three-cycle sine wave with a frequency of 37 MHz were generated using a waveform generator (AWG2021, Techtronix Inc.) and were amplified using a high-frequency post-amplifier (T142-432AA, Thamway Co. Ltd.). A 10 Y-cut LiNbO3 transducer was attached at the backside of the anvil to generate and receive elastic wave signals (P-wave and S-wave signals) (Fig. 1a). The signals reflected from the sample were detected using a high-resolution digital oscilloscope (DPO 5054, Techtronix Inc.), with a sampling rate of 5·109 points/s. The signal was acquired by averaging 1000 signals. The P-wave travel time in the sample was determined from the time difference of the signals reflected at the buffer rod/sample (sample front) and sample/backing plate (sample back) interfaces (Fig. 2). The length of the sample was measured from the X-ray radiography image. Analyses of the travel time and sample length were performed using a program written by Y. Kono (Kono et al., 2012). The VP of the sample could then be calculated from the obtained travel time and sample length. The error in VP was derived from the travel time uncertainty caused by overlapping echo signals of the sample and from the error in sample length determination (0.04∼0.24% error of the sample length).
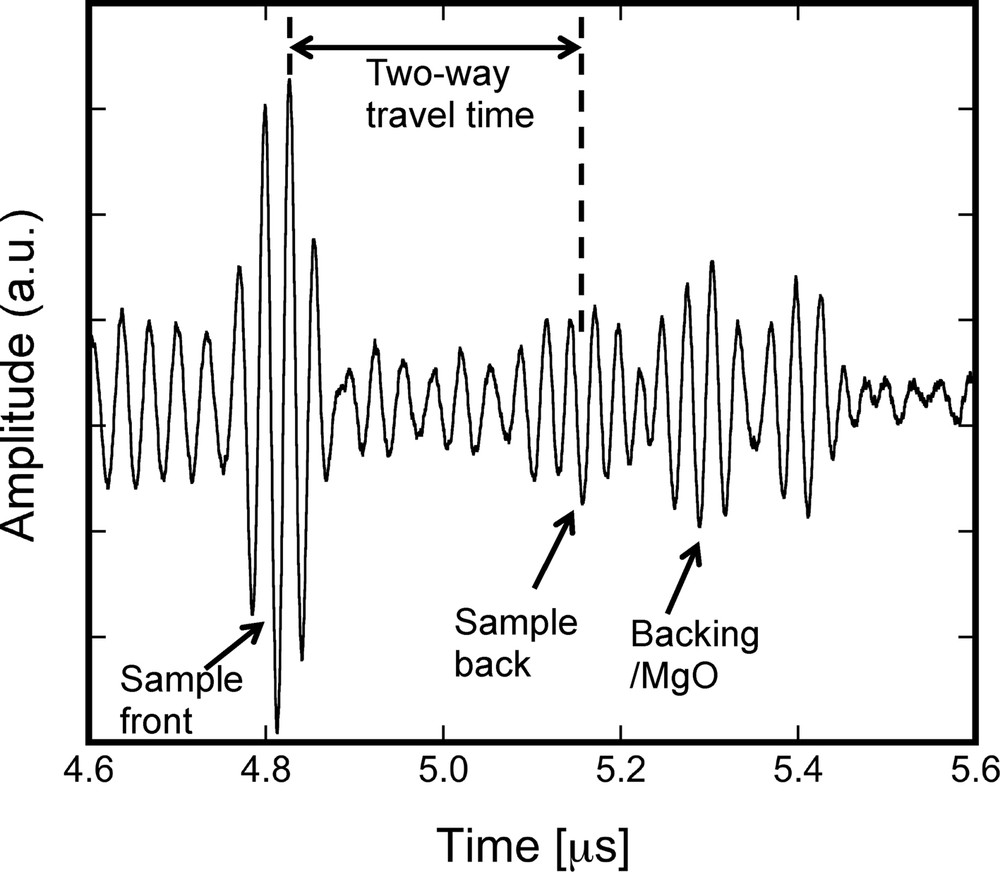
P-wave signal obtained at 5.5 GPa and 795 K. The first three signals correspond to echoes at the sample front (buffer rod/sample), sample back (sample/backing plate) and backing plate/MgO, respectively (see the cell assembly in Fig. 1b). The time between the sample front and the sample back corresponds to the two-way travel time in the liquid Ni–S sample.
2.3 Density measurements
The density of the liquid sample was measured using the X-ray absorption method based on the Beer–Lambert law (Katayama, 1996). X-ray absorption was obtained from the X-ray radiography image with image brightness treated as X-ray intensity (Chen et al., 2005; Terasaki et al., 2010). The Beer–Lambert law can be expressed as follows:
| (1) |

(a) X-ray absorption profile of the liquid Ni–S at 2.9 GPa and 816 K as a function of a horizontal axis (Y) perpendicular to the X-rays. The two levels of absorption observed at the shoulder of the profile correspond to the absorptions of the BN capsule and graphite heater, respectively. (b) CT slice image of the liquid Ni–S at 2.9 GPa and 816 K (inset). The relationship between sample thickness (ts) and absorption (ln(B/B0′)). Filled and open circles denote the data used for fitting and raw data, respectively. The dashed line indicates the linear fitting line. The slope of this plot corresponds to the μsρs value. Masquer
(a) X-ray absorption profile of the liquid Ni–S at 2.9 GPa and 816 K as a function of a horizontal axis (Y) perpendicular to the X-rays. The two levels of absorption observed at the shoulder of the profile correspond to the ... Lire la suite
In previous X-ray absorption density measurements, the sample thickness in the X-ray direction, ts, was not able to be directly measured. The ts has been estimated by fitting the X-ray absorption scan profile based on Eq. (1) under the assumption of uniform compression of cylindrical sample capsule. In this case, both ts and ρs were treated as fitting parameters (e.g., Shimoyama et al., 2016; Terasaki et al., 2010). In contrast, in this study, the X-ray CT measurement provided three-dimensional geometry information about the sample and the surrounding materials. Thus, ts was directly measured from the CT slice images (Fig. 3b, inset). By combining the X-ray absorption profile (Fig. 3a) and the sample's thickness, we can obtain the relationship between sample thickness and brightness as shown in Fig. 3b. The slope of this plot corresponds to the μsρs value as expressed in Eq. (2):
| (2) |
3 Results and discussion
3.1 Sound velocity and density
The experimental conditions of this study and the results are summarized in Table 1. Based on the XRD patterns, the Ni and Ni3S2 phases coexisted in the solid state, and the melting of the sample was confirmed by the disappearance of the XRD peaks of the crystalline Ni and Ni3S2 and the appearance of a diffuse scattering signal. The P-wave velocity (VP) of solid Ni–S decreased slightly with increasing temperature and VP dropped discontinuously after melting (Fig. 4). The VP of liquid Ni68S32 shows only a small change with varying temperature in the range of present measurements, which is similar to the results obtained for liquid Fe–S (Jing et al., 2014; Nishida et al., 2013). The effect of pressure on the value of VP of liquid Ni68S32 is shown in Fig. 5a. The VP of liquid Ni68S32 increased from 2.49 ± 0.09 to 3.23 ± 0.11 km/s with increasing pressure from 1.2 to 5.5 GPa. Compared with the results of liquid Fe57S43 (eutectic composition of Fe–S) (Nishida et al., 2016), the VP of liquid Ni68S32 is smaller, while the Ni68S32 and Fe57S43 show similar dVP/dP rates (Fig. 5a).
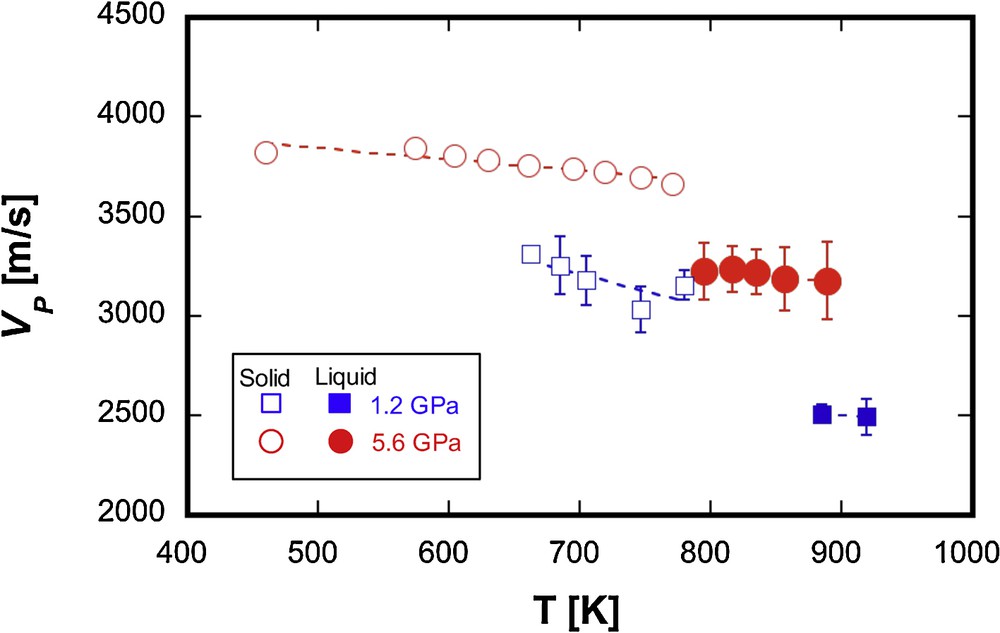
The effect of temperature on VP for liquid Ni68S32. Blue squares and red circles denote the results at 1.2 and 5.5–5.6 GPa, respectively. Open and filled symbols represent respectively the results for solid and liquid.

(a) The effect of pressure on VP of liquid Ni68S32. The filled and open blue circles denote the results at 800–900 K and at 900–1050 K, respectively. The solid curve is a guide for the eye for the data of 800–900 K. The dashed curve indicates VP of liquid Fe57S43 from the data of Nishida et al. (2016). (b) The effect of pressure on density (ρ) of liquid Ni68S22 at 800–920 K (filled blue circles). The filled blue square represents the reported density at ambient pressure and 900 K (Nagamori, 1969). The dashed curve denotes the ρ of liquid Fe57S43 calculated from the VP data of Nishida et al. (2016). Masquer
(a) The effect of pressure on VP of liquid Ni68S32. The filled and open blue circles denote the results at 800–900 K and at 900–1050 K, respectively. The solid curve is a guide for the eye for the data of 800–900 K. ... Lire la suite
The density of the liquid Ni68S32 is slightly higher than that of the solid mixture of Ni and Ni3S2 with a Ni68S32 composition (see Table 1). This negative volume change (ΔV) from solid to liquid is supported by the negative slope of the eutectic melting curve (dTm/dP = ΔV/ΔS < 0, where Tm is melting temperature and ΔS (> 0) is entropy change from solid to liquid) in the Ni–Ni3S2 binary system up to 5 GPa (Urakawa et al., 2011). The effect of pressure on the density of liquid Ni68S32 is shown in Fig. 5b. The compression curve of liquid Ni68S32 was in agreement with the result at ambient pressure (Nagamori, 1969), and the dρ/dP slope of liquid Ni68S32 is similar to that of liquid Fe57S43 (Fig. 5b).
3.2 Bulk modulus and its pressure derivative
The bulk modulus at ambient pressure (K0) and its pressure derivative (K’ = dK/dP) are important for understanding the equation of state of liquid alloys. In previous studies, the
In this study, since the density (ρ) and sound velocity (VP) of the liquid Ni68S32 were simultaneously determined in the same pressure and temperature conditions, the adiabatic bulk modulus (KS) could be directly determined from the obtained VP and ρ values using the following equation:
| (3) |
This is the big advantage of the simultaneous measurement of ρ and VP in determining the KS of a liquid and its pressure and temperature dependence. The results of KS are summarized in Table 1 and are plotted as a function of ρ0/ρ in Fig. 6, where ρ0 is the density at ambient pressure (Nagamori, 1969). KS was found to increase from 39.5 ± 3.4 to 69.6 ± 8.7 GPa with a ρ0/ρ decrease from 0.97 to 0.89. The error in KS is derived from the propagation of errors of VP and ρ. The KS data were fitted to a third-order finite strain equation (Meister et al., 1980):
| (4) |
| (5) |
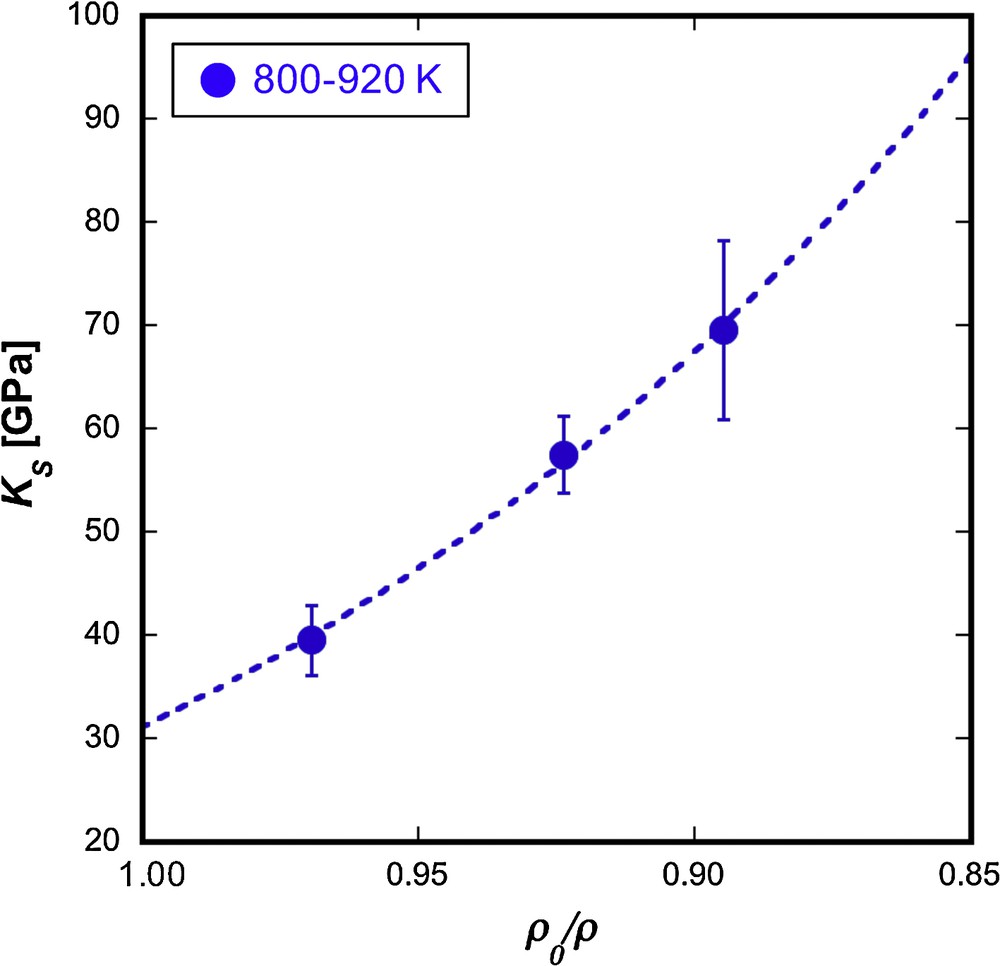
The adiabatic bulk modulus (KS) of liquid Ni68S32 as a function of ρ0/ρ. ρ0 corresponds to the value of ρ0 (= 6170 kg/m3) at 900 K obtained from the data of Nagamori (1969). The filled blue circles denote KS at 800–920 K. The dashed curve represents the fitted curve for the data at 800–920 K using Eqs. (4)–(5).
The KS data at 800–920 K were well fitted, as shown by the dotted curve in Fig. 6 and the fitting yielded
3.3 Application of Birch's law to liquid alloys
Measurements of VP in a wide ρ range are important to evaluate the validity of Birch's law, so that, in the studies of solid metals and alloys, efforts have been made to measure VP and ρ in wide pressure ranges (up to multi-megabar) (e.g., Badro et al., 2007; Ohtani et al., 2013). On the other hand, the value of ρ in the liquid changes significantly, with a small pressure variation, especially in relatively low-pressure regions, due to the high compressibility of the liquid. Hence, a relationship between ρ and VP values of liquid alloys can effectively be obtained from precise measurements in the low-pressure region in this study.
The relationship between ρ and VP of liquid Ni68S32 obtained in this study is shown in Fig. 7. It is found that the VP of liquid Ni–S increases linearly with increasing ρ regardless of the temperature conditions (816–1045 K). This suggests that liquid Ni–S follows a linear relationship between ρ and VP, i.e. Birch's law, in the present P–T conditions. The least-square fitted line of liquid Ni68S32 in Fig. 7 is given below:
| (6) |
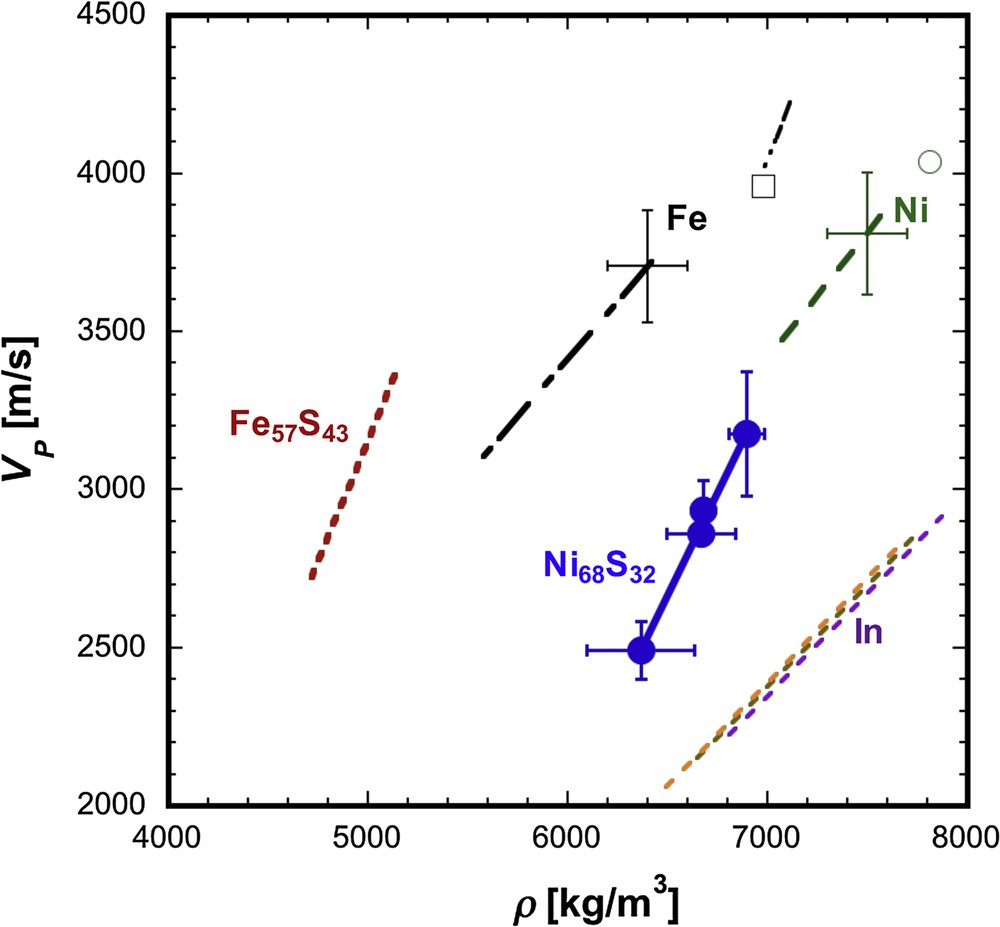
The relationship between the sound velocity (VP) and density (ρ) of liquid metals and sulphides. The filled blue circles represent the data of liquid Ni68S32. The green open circle and black square correspond to data for liquid Ni (1726 K) and Fe (1809 K) at ambient pressure (Nasch and Manghnani, 1998), respectively. Green dashed, and black dotted–dashed lines denote liquid Ni (2045–3151 K) and Fe (2490–3950 K) data at 0.2 GPa (Hixson et al., 1990). The red short dashed and black 2 dot-dashed lines correspond to data for liquid Fe57S43 (Nishida et al., 2016) and for Fe (Jing et al., 2014). (The density for Fe57S43 and Fe liquids were calculated from measured VP.) Purple, brown, and orange dashed lines represent values of In at 700, 900, and 1100 K, respectively, calculated based on the parameters of Komabayashi et al. (2015). Masquer
The relationship between the sound velocity (VP) and density (ρ) of liquid metals and sulphides. The filled blue circles represent the data of liquid Ni68S32. The green open circle and black square correspond to data for liquid Ni ... Lire la suite
For comparison, VP–ρ data of liquid Fe, Ni, In (indium), and Fe57S43 are also plotted in Fig. 7. The VP–ρ data of liquid Fe and Ni are derived from the data measured at ambient pressure and high temperatures (Ni: 1726 K, Fe: 1809 K) (Nasch and Manghnani, 1998) and from the data at 0.2 GPa and high temperatures (Ni: 2045–3151 K, Fe: 2490–3950 K) (Hixson et al., 1990). The VP–ρ relation of liquid Fe57S43 is based on the measured value of VP and the value of ρ calculated from VP using the Murnaghan equation of state (Nishida et al., 2016). These data can be approximated as a linear relationship between ρ and VP. The VP–ρ relations of liquid In are calculated at 0–6 GPa and 700–1100 K based on the elastic parameters reported by Komabayashi et al. (2015). Although Komabayashi et al. (2015) suggested the possible existence of a temperature dependence on the VP–ρ relation for liquid In, the difference is small, as shown in Fig. 7. Thus, the effect of temperature on the VP–ρ relation is considered to be quite small in the present P–T conditions. In addition, they discussed the VP–ρ relation of In based on the values of ρ evaluated from literature data, which may make additional uncertainty for the VP–ρ relation. Further investigation by simultaneous measurement of both VP and ρ of liquid with varying temperatures in a wide range is important to evaluate the temperature effect on the Birch law for liquids.
Our measured VP–ρ slope (dVP/dρ) of liquid Ni68S32 (dVP/dρ = 1.3) is almost the same as that of liquid Fe57S43 (dVP/dρ = 1.5), while it is clearly larger than those of liquid Fe and Ni (dVP/dρ = 0.7 for Fe and 0.8 for Ni) based on the data of Hixson et al. (1990), and also than that of liquid In (dVP/dρ = 0.65). Therefore, liquid sulfides are likely to have a steeper VP–ρ slope than liquid metals, suggesting that the VP of liquid sulfide changes more rapidly with the variation of density. This tendency is in agreement with that observed in solid FeS and Fe (Badro et al., 2007; Vocadlo, 2007). In crystalline systems, it has been shown that the dVP/dρ slope is smaller for close-packed structures and is larger for open structures (Liebermann, 1982). Morard et al. (2007) showed that the hard sphere packing fraction of liquid Fe–S is lower than that of liquid Fe, which may be the reason of the larger dVP/dρ slope in liquid Ni–S and Fe–S. However, the dVP/dρ slope of liquid Fe based on the data of Jing et al. (2014) seems to be larger than that from Hixson et al. (1990), although the plotted range of Jing et al. (2014) is narrow (Fig. 7). ρ and VP measurements of liquid Fe at higher pressures are required for further discussion. In addition to the differences in the dVP/dρ values between pure metals and sulfides, we found significant difference in the VP–ρ plot between liquid Ni–S and liquid Fe–S, which suggests that the effect of Ni on Birch's law is important for discussing the ρ and VP of planetary and lunar molten cores.
4 Conclusions
In this study, we simultaneously measured the VP and ρ of liquid Ni68S32 using ultrasonic and X-ray absorption methods combined with X-ray tomography. The simultaneous measurements enabled us to directly determine the adiabatic bulk modulus and its pressure derivative, and to discuss the VP–ρ relation (Birch's law). The measured VP of liquid Ni68S32 increases linearly with ρ regardless of temperature in the present conditions. The value of dVP/dρ is similar between liquid Ni–S and liquid Fe–S, and the dVP/dρ of liquid sulfides is likely steeper than that of liquid metals (Ni, Fe, and In). The simultaneous measurement of ρ and VP of liquid Fe–Ni–light element alloys provides important constraints in the evaluation of the properties and of the composition of the molten cores of terrestrial planets and of their moons based on Birch's law.
Acknowledgements
The authors acknowledge M. Hoshino, T. Sakaiya, and S. Yamamoto for their technical support and discussions. The authors also acknowledge R.C. Liebermann and an anonymous reviewer for constructive comments. This work is partly supported by Grants-in-Aid for scientific research (A) and (B) to H.T. (JP23340159, JP26247089) and S.U. (JP23340129) and also partly supported by Grant-in-Aid for Scientific Research on Innovative Areas (JP15H05828). Y.K. acknowledges the support of DOE-BES/DMSE under Award DE-FG02-99ER45775. The experiments have been performed under contract of the SPring-8 facility (proposal numbers: 2011B1278, 2011B1355, 2012A1481, 2013A1072, 2014B1319).