

1 Introduction
In the generation of Earth's magnetic field by thermo-chemical convection in the outer core (OC) (Merrill et al., 1996), the electrical resistivity ρ of the convecting liquid determines the dissipation of the magnetic field. It constrains two critical aspects of the geodynamo: (i) the timescale of dipole decay (Wicht, 2002), and therefore the stability of the magnetic field in a specific polarity, and (ii) the fluid velocity required for generating a given magnetic field strength (Davies et al., 2015).
Resistivity and the energy budget of convection depend on chemical composition, for which the current understanding inside Earth's core is based on seismic observations in combination with cosmochemical constraints. Both the solid inner core (IC) and the liquid OC are less dense than pure iron or iron–nickel alloys, which requires the presence of one or more lighter elements (Birch, 1952). Furthermore, the density discontinuity at the inner core boundary (ICB) is too large to be caused by a liquid–solid phase transition alone, suggesting that at least one light element preferentially partitions into the OC (Masters and Gubbins, 2003). Light elements need to be sufficiently abundant in the solar system and readily alloy with iron under the conditions at which the Earth differentiated, makingsilicon, oxygen and sulfur primary candidates (Poirier, 1994). In addition to density, acoustic velocities need to match those of a seismic reference model, such as PREM (Dziewonski and Anderson, 1981), which cannot be achieved by a binary alloy of one of those elements with iron (Badro et al., 2015). As the Earth is depleted in sulfur compared to chondritic composition (Dreibus and Palme, 1996), silicon and oxygen are assumed to be the major light elements in the core (Tsuno et al., 2013) with estimated concentrations of 2–3.5% Si and 2.7–5% O (Badro et al., 2015). The presence of carbon and hydrogen is likely limited to below 0.2% due to their volatility (McDonough, 2003), and consequently these elements are not considered in the present study.
While the sulfur concentration in the Earth's core has been estimated to be below 2% (Dreibus and Palme, 1996), other terrestrial planets are expected to contain substantially more sulfur. Its high solubility in iron, its high abundance in iron meteorites, the absence of a giant impact that leads to a loss of volatiles from the Earth (Halliday, 2004), and more reducing conditions during planetary differentiation (Namur et al., 2016) support models for the cores of Mercury (Hauck et al., 2013; Rivoldini et al., 2009), Mars (Lodders and Fegley, 1997), and Ganymede (Rückriemen et al., 2015) which assume sulfur to be the sole light element.
There have been considerable advances in constraining electronic transport properties in recent years, both experimentally and computationally. First principles calculations on liquid iron (de Koker et al., 2012; Pozzo et al., 2012) first predicted resistivity at conditions of the Earth's core to be substantially lower than previous estimates (Stacey and Anderson, 2001; Stacey and Loper, 2007). The results are consistent with dynamic compression experiments at high pressure (P) and temperature (T) (Keeler, 1971), while ρ is underestimated at ambient (van Zytveld, 1980) and low P conditions (Secco and Schlössin, 1989). Recently, similarly low resistivity values of hexagonal close packed iron at high P/high T have been reported by Ohta et al. (2016), using a laser-heated diamond anvil cell (DAC).
In addition to early static and dynamic compression experiments (Bridgman, 1957; Matassov, 1977), resistivity of Fe–Si alloys has been measured in large-volume press experiments at low P and high T (Kiarasi and Secco, 2015), and beyond 100 GPa in the DAC (Gomi et al., 2013; Seagle et al., 2013). High-temperature extrapolations based on DAC experiments at ambient T yield values consistent with computational results at conditions inside Earth's core.
Single-phase samples of iron alloys containing oxygen and sulfur are challenging to synthesize (Mori et al., 2017); therefore, resistivity data is scarce for compositions in these systems. A recent study circumvented this problem by calculating impurity resistivity of sulfur from measured values of Fe, Fe–Si (Gomi et al., 2013, 2016) and the ternary Fe–Si–S alloy using Matthiessen's rule (Suehiro et al., 2017).
An important assumption in fitting experimental data was that resistivity of iron and its alloys does not follow a linear trend with T, as expected from the Bloch–Grüneisen equation, but appears to saturate at high P/T conditions (Gomi et al., 2013, 2016; Ohta et al., 2016). Resistivity saturation occurs for highly resistive transition metal alloys (Gunnarsson et al., 2003), where the electron mean free path becomes comparable to the interatomic distance, which is known as the Ioffe–Regel criterion (Ioffe and Regel, 1960). First principles computations suggest a decrease in the slope of ρ(T) for hexagonal-close-packed iron at high compression (Pozzo and Alfè, 2016), approaching saturation.
With the incorporation of light elements, resistivity increases due to the additional impurity scattering mechanism. For crystalline alloys, the concentration (c) dependence of resistivity is generally described by Nordheim's rule as ρ ∝ c(1 − c) (Nordheim, 1928), but fundamental deviations from that relation have been observed in liquid and amorphous alloys (e.g., Enderby and Howe, 1968).
Faber–Ziman theory (Faber and Ziman, 1965; Ziman, 1961) relates the dependence of resistivity for liquid alloys on concentration to structural properties of the liquid, i.e. to the microscopic short-range order described by partial structure factors Sαβ(q). While qualitative features are described well by Faber–Ziman theory, there is substantial quantitative disagreement, especially for transition metal alloys. Iron and iron alloys have a complex electronic structure with partially filled d-bands at the Fermi level and are therefore not well described by Faber–Ziman theory, as far as absolute resistivity values are concerned.
We build our study on density functional theory-based molecular dynamics (DFT–MD) trajectories and resistivity results for liquid Fe, Fe–Si, and Fe–O alloys by de Koker et al. (2012), and Fe–S alloys by Wagle et al. (2018). In this paper, we consider in detail the relation between the liquid structure and computed values of ρ for binary iron alloys with the major light element candidates Si, O, and S. We do so by calculating the effective mean free path from the Drude response of optical conductivity, from which we identify different saturation mechanisms and show correlations with structural properties of the liquid. Finally, we discuss implications on conductivity profiles, and their influence on the dynamos of terrestrial planets.
2 Methods
DFT-MD simulations were performed on cells containing 128 atoms in the N–V–T ensemble, using the plane-wave code VASP (Kresse and Furthmüller, 1996a,b; Kresse and Hafner, 1993). Cubic cells in a volume range between 7.09 and 11.82 Å3/atom (V0)—covering the P-range of the Earth—and light element contents of 12.5 (Fe7X) and 25 at.% (Fe3X) were set up by randomly replacing iron with light element atoms (X) in molten configurations. Atomic coordinates were updated using a time step of 1 fs, and T was controlled by the Nosé thermostat (Nosé, 1984), with T ranging from 2000 K to 8000 K. At each time step, the electron density was computed using the projector-augmented-wave (PAW) method (Kresse and Joubert, 1999) with the PBE exchange-correlation functional (Perdew et al., 1996) and a plane wave cutoff energy of 400 eV. Electronic states were occupied according to Fermi–Dirac statistics at T of the thermostat. Brillouin zone sampling was restricted to the zone center. After equilibration of P, T, and the total energy (E) had been achieved (typically after a few hundred fs), the DFT–MD simulations were continued for at least 15 ps.
We observe non-vanishing slopes of the atomic mean square displacement at all simulation conditions, even for T below the liquidus at high density. This indicates that the liquid is metastable, i.e. cells are not frozen to a glass for which the mean square displacement would reach a constant value after some simulation time.
Partial radial distribution functions gαβ(r) were obtained by a time average over all equilibrated configurations from the DFT-MD trajectories. The unnormalized radial distribution function Gαβ(r) = 4πr2ϱgαβ(r), with number density ϱ, describes how the particle density of species β varies with distance to a reference particle of species α. We define the properties of the first coordination shell by Gαβ(r) up to the first minimum: the first coordination number is then represented by the integral and the interatomic distance by the median of the distribution.
For calculating electronic transport properties, at least six uncorrelated snapshots were extracted from the MD simulations (i.e. separated by time periods greater than that required for the velocity autocorrelation function to decay to zero) and Kohn–Sham wavefunctions ψk, their energy eigenvalues ϵk, and the gradient of the Hamiltonian with respect to reciprocal wave vector were computed using the Abinit software package (Gonze, 1997; Gonze et al., 2009; Torrent et al., 2008). From those, optical conductivity was calculated within the Kubo–Greenwood formalism as
| (1) |
By fitting the Drude formula
| (2) |
The resulting ρ(V, T) values were fit with a parallel resistor model to interpolate between results and extrapolate to conditions not investigated:
| (3) |
| (4) |
| (5) |
| (6) |
Fit parameters of the models for ρ(V, T) (Eq. (3)) for the liquid iron–light-element alloys considered. As the individual terms (Eqs. (4)–(6)) for describing resistivity results are difficult to separate, the fit is not well constrained and uncertainties in the fitting parameters exceed their values in most cases. Parameters for Fe and the Fe–S alloys have been reported in a previous study (Wagle et al., 2018).
| Fe | Fe7O | Fe3O | Fe7Si | Fe3Si | Fe7S | Fe3S | ||
| ρ 0R | [μΩ cm] | 75.10 | 87.80 | 100.3 | 97.09 | 193.4 | 89.03 | 105.2 |
| ρ 1R | [μΩ cm] | 21.48 | 11.88 | 7.979 | 4.377 | 76.74 | 12.73 | 12.06 |
| a | 0.792 | 0.645 | 0.717 | 0.607 | 0.465 | 0.389 | 0.124 | |
| b | 1.479 | 1.695 | 1.482 | 1.617 | 2.495 | 1.804 | 2.686 | |
| c | [μΩ cm] | 747.2 | 1823 | 7.771 × 10⁵ | 6030 | 254.0 | 2077 | 6609 |
| d | [μΩ cm] | 1405 | 4202 | 2.356 × 10⁶ | 24810 | 2006 | 2829 | 2910 |
In order to describe electrical resistivity as a function of P, suitable for comparison to experiments and for applications in planetary models, we fit a thermodynamic model to the DFT-MD results that is based on a separation of the Helmholtz energy into ideal gas, electronic, and excess terms (de Koker and Stixrude, 2009; Vlček et al., 2012). The volume dependence of the excess term is represented by Eulerian finite strain (f) with exponent n = 2 and a similarly reduced T-term (θ) with exponent m = 0.79 and expansion orders and , parameters that best describe the results for liquid iron (de Koker et al., 2012). The thermodynamic properties at reference conditions are summarized in Table 2.
Parameters of the modified thermodynamic model by de Koker and Stixrude (2009) for V0 = 11.82 Å3/atom and T0 = 2000 K (reference conditions). Values for extensive variables are per mol of formula units. Parameters for Fe and the Fe–S alloys have been reported in a previous study (Wagle et al., 2018).
| Fe | Fe7O | Fe3O | Fe7Si | Fe3Si | Fe7S | Fe3S | ||
| P xs0 | [GPa] | −2.335 | −1.186 | 5.534 | 0.846 | 5.534 | 0.846 | 5.534 |
| K T,xs0 | [GPa] | 131.4 | 101.0 | 42.56 | 137.3 | 133.1 | 137.8 | 140.0 |
| 5.161 | 5.706 | 9.223 | 5.031 | 5.122 | 4.694 | 4.736 | ||
| αK T,xs0 | [GPa/K] | 8.822 × 10⁻³ | 5.939 × 10⁻³ | 1.252 × 10⁻³ | 8.363 × 10⁻³ | 6.138 × 10⁻³ | 8.620 × 10⁻³ | 7.194 × 10⁻³ |
| [GPa/K] | −1.563 × 10⁻² | −1.518 × 10⁻² | −2.131 × 10⁻² | −1.229 × 10⁻² | −9.111 × 10⁻³ | −1.660 × 10⁻² | −1.327 × 10⁻² | |
| [GPa/K] | −3.348 × 10⁻³ | −1.352 × 10⁻³ | 4.956 × 10⁻⁴ | −3.288 × 10⁻³ | −1.739 × 10⁻³ | −2.376 × 10⁻³ | −1.808 × 10⁻³ | |
| [GPa/K] | 2.840 × 10⁻² | 3.401 × 10⁻² | 5.741 × 10⁻² | 2.115 × 10⁻² | 9.670 × 10⁻³ | 5.115 × 10⁻² | 3.534 × 10⁻² | |
| C V,xs0 | [J/(mol K)] | 18.50 | 183.1 | 100.5 | 189.5 | 102.3 | 185.1 | 92.90 |
| [kJ/(mol K)] | 15.84 | 313.6 | 86.07 | 324.7 | 87.66 | 317.1 | 79.57 | |
| [kJ/(mol K)] | 2.113 × 10⁻² | 1.626 × 10⁻¹ | 1.193 × 10⁻¹ | 6.850 × 10⁻² | −3.449 × 10⁻² | 3.094 × 10⁻¹ | 1.033 × 10⁻¹ | |
| ζ 0 | [J/(mol K2)] | 3.486 | 32.67 | 14.51 | 27.18 | 12.35 | 30.04 | 12.36 |
| ξ | 0.843 | 0.911 | 0.671 | 0.730 | 0.925 | 1.096 | 1.006 |
3 Results and discussion
3.1 Liquid structure
The results of our structural analysis in terms of gαβ(r), interatomic distances and coordination numbers (Figs. 1 and 2) for the binary alloys in the Fe–S, Fe–O, and Fe–Si systems reveal the following key observations.
- (i) Silicon incorporates substitutionally into liquid iron, with average nearest-neighbor distances very similar for Fe–Fe, Fe–Si, and Si–Si (Fig. 1). Fe–Si alloys are in the vicinity of the close-packing limit of a twelve-fold coordination, which does not change with P (Fig. 2), in agreement with previous results (Posner et al., 2017b). Structural data from in situ X-ray diffraction show the same trend in the low-P range (Morard et al., 2008; Sanloup et al., 2002).
- (ii) The average Fe–O distance is substantially shorter than the Fe–Fe distance, and two oxygen atoms are typically separated by one iron atom. This difference in size has been attributed to account for the observation that oxygen preferentially partitions into the liquid over the solid (Alfè et al., 2002; Morard et al., 2014). With increasing P, the six-fold coordination of iron around oxygen at ambient conditions increases to eight-fold at core conditions. The transition of the compression mechanism from changing coordination to shortening the interatomic distance has been shown to affect diffusive transport for the Fe–O system (Posner et al., 2017a,c).
- (iii) Fe–S alloys at high P exhibit a net S–S repulsion, as shown by the virtual absence of a typical nearest-neighbor peak for gSS(r) between 2.0 and 2.5 Å and the presence of a next-nearest neighbor maximum at ∼3.5 Å (Fig. 1a). This has been linked to a strengthening of covalent bonds between Fe and S with increasing P, resulting in high Fe–S coordination (Alfè and Gillan, 1998). Fig. 2 shows increasing Fe–S coordination with compression, suggesting sulfur to shift from interstitial-like to substitutional incorporation in the liquid. At the highest compressions, Fe–S approaches a close-packed short-range structure.
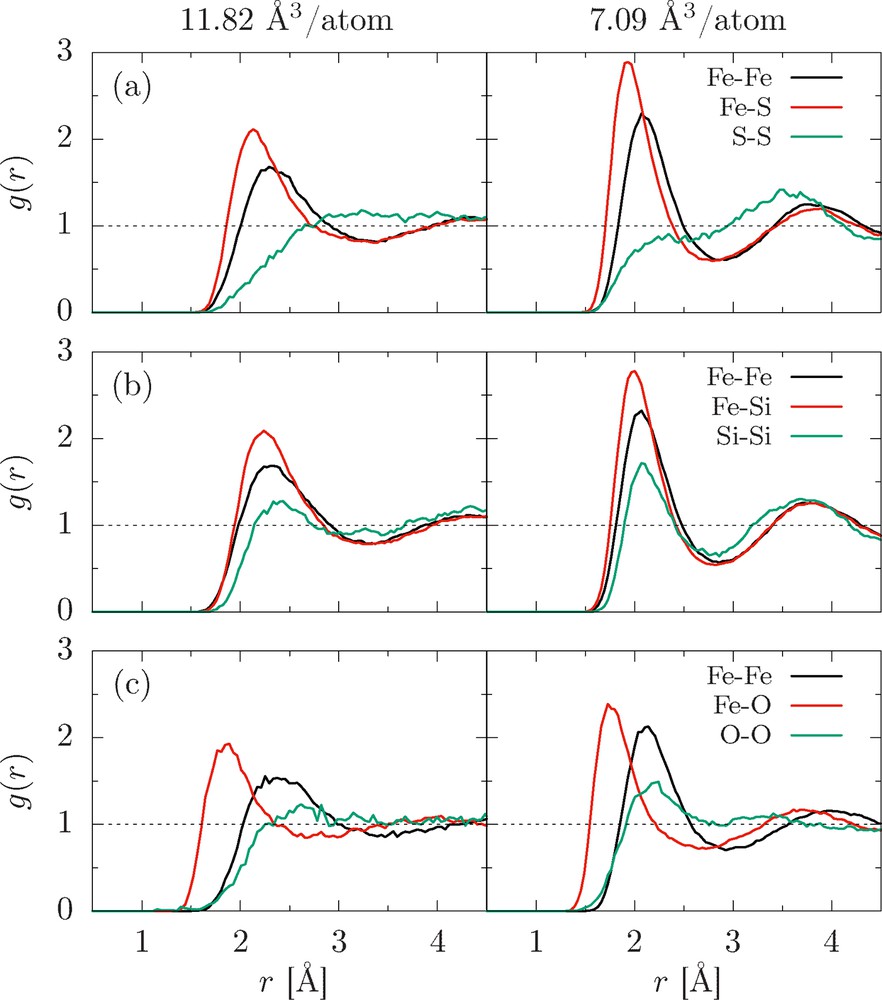
Partial radial distribution functions for (a) Fe3S, (b) Fe3Si, and (c) Fe3O at 8000 K and two unit cell volumes (V0 and V/V0 = 0.6).
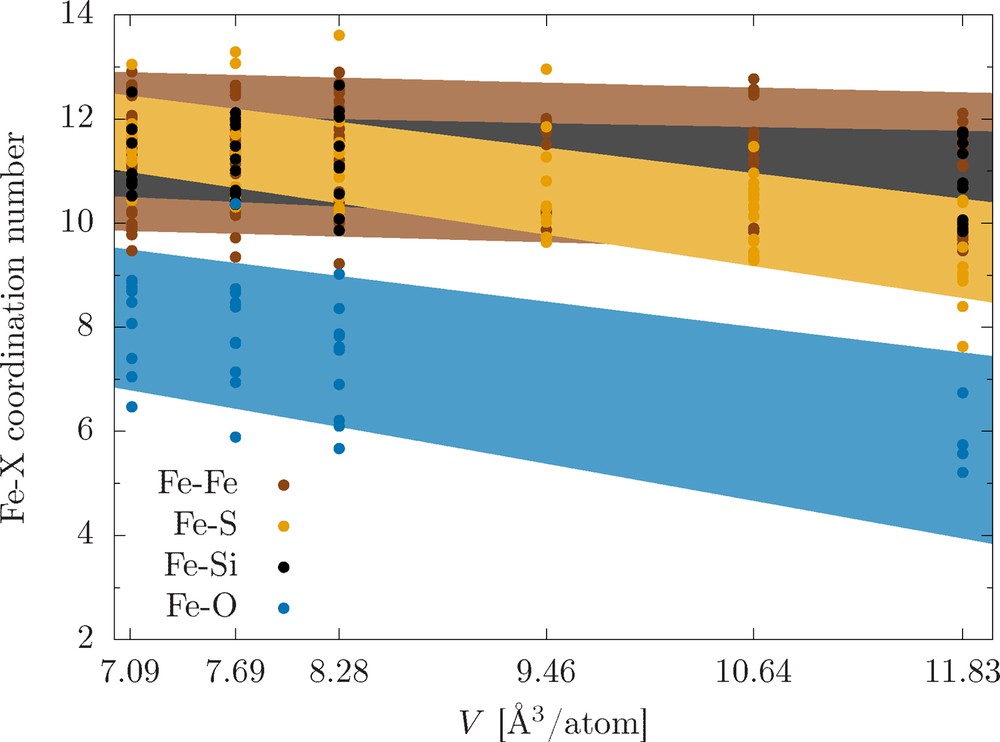
First iron coordination numbers around an atom of species X. The vertical scatter at each volume arises from including results for different light element concentrations at different temperatures. Linear regressions with propagated uncertainty bands are shown in matching colors to guide the eye.
3.2 Resistivity saturation and electron mean free path
As a structural dependence of resistivity is expected from transport theory of liquid metals (Faber and Ziman, 1965; Ziman, 1961), it is our goal to describe the correlations between the observations made in Section 3.1 and resistivity calculated from first principles (Fig. 3).
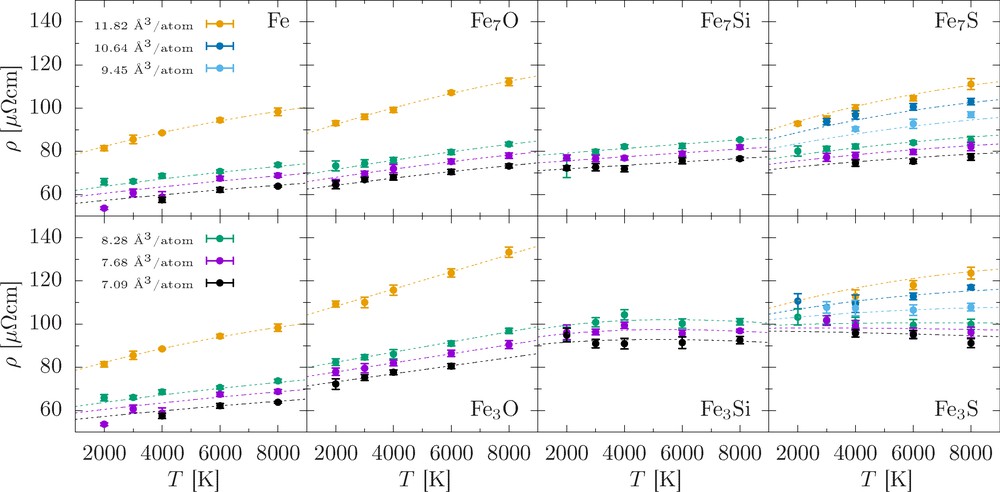
Electrical resistivity of liquid iron and various binary iron alloys as a function of temperature along isochores. The resistivity model fit for ρ(V, T) (Eq. (3)) is shown by dashed lines.
Generally, ρ increases with T and c. Larger vibrational amplitudes and shorter distances between impurity atoms lead to a decrease in the effective electron mean free path (xeff), approaching the Ioffe–Regel saturation limit, where xeff becomes comparable to the interatomic distance. However, the addition of the same mole fraction of different light elements leads to resistivity increases by different amounts, depending on volume and temperature.
For the low impurity concentrations considered (Fe7X), resistivity can be described reasonably well by a linear T-dependence above the Debye temperature (ΘD) (∼1000 K at low compression), consistent with Bloch–Grüneisen theory. With compression, ΘD increases based on the thermodynamic parameters from the DFT–MD simulation, and the values of ρ decrease. This behavior is well captured by the resistivity model (Eq. (3)).
For higher impurity concentrations (Fe3X), we find that ρ is higher (Fig. 3) and that the Bloch–Grüneisen behavior breaks down for Fe3Si and Fe3S. The temperature coefficient of resistivity (TCR) decreases with compression for all alloys, vanishes within uncertainty for the three smallest volumes of Fe3Si and changes sign for Fe3S for the smallest two volumes we consider. We have previously explained the negative TCR for Fe3S by changes in the electronic structure that are only noticeable once the liquid has reached the Ioffe–Regel condition (Wagle et al., 2018).
In order to illustrate resistivity saturation mechanisms from a semi-classical picture of electron transport, we calculate the effective electron mean free path as , where is the Fermi velocity, neff = (mσ0)/(e2τ) the effective number density of conduction electrons, and m the electron mass. Fig. 4 reveals three distinctive features.
- (i) For ambient P volumes (V0 = 11.82 Å3/atom), xeff approaches the mean interatomic distance asymptotically with increasing T, consistent with the thermally driven saturation process found in previous studies (Mooij, 1973; Pozzo and Alfè, 2016).
- (ii) At the lowest cell V considered (V = 7.09 Å3/atom), xeff becomes shorter than at lower compression, due to the increased density of scattering centers. At first glance, this observation appears to be inconsistent with the fact that ρ decreases with compression (Fig. 3), but can be understood in terms of electronic structure (Wagle et al., 2018).
- (iii) With increasing light element concentration, xeff decreases significantly. This reflects the expected behavior of an increased probability of impurity-caused scattering. For the highest compression, the Ioffe–Regel condition is satisfied for Fe3Si and Fe3S as xeff becomes equal to the mean interatomic distance within uncertainty.
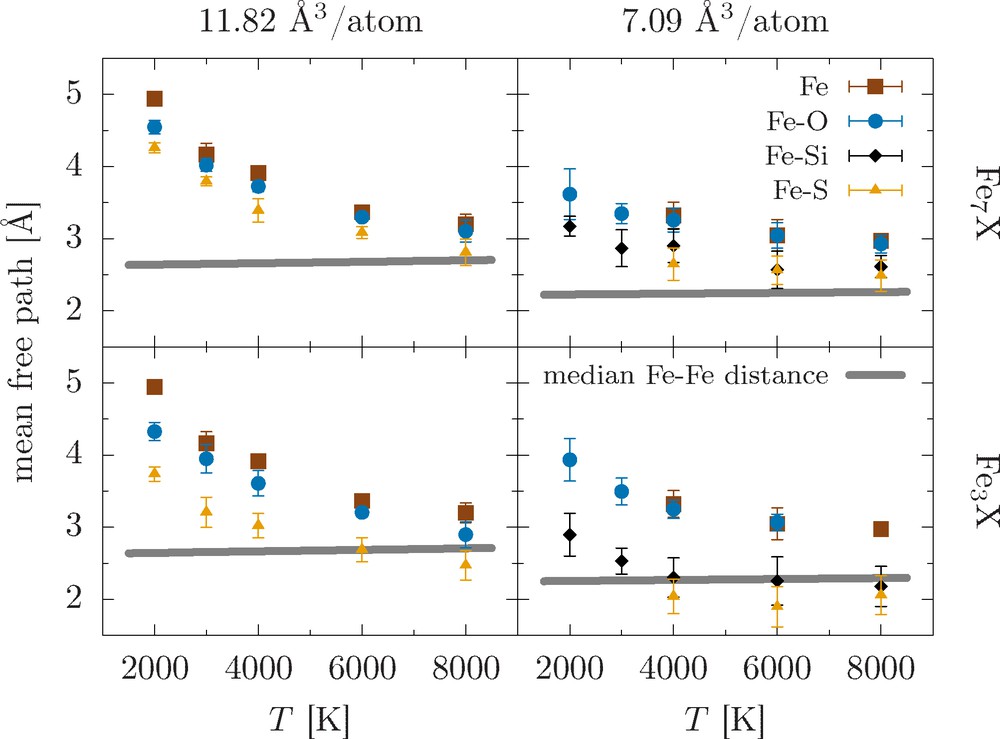
Electron mean free path for liquid iron with 12.5 at.% (top) and 25 at.% (bottom) light element content for two cell volumes, near ambient P (left) and largest compression (right), obtained by a Drude fit to optical conductivity (Eq. (2)). The mean free path approaches the interatomic Fe–Fe distance in the alloys (median, thick gray lines) with increasing temperature, compression, and impurity concentration. For Fe3Si and Fe3S at the smallest cell volume, the Ioffe–Regel condition is satisfied.
These observations match the resistivity behavior shown in Fig. 3 and explain the temperature effect on resistivity: while xeff in pure iron and Fe–O alloys is still somewhat larger than the average spacing of scattering centers, resistivity is not yet saturated, and its T-dependence is retained. High concentrations of Si and S in the liquid iron alloy, on the other hand, drive the system into the Ioffe–Regel limit, resulting in a vanishing TCR.
A possible reason for the short mean free path of Fe–S alloys can be found in the S–S avoidance (Fig. 1) and high Fe–S coordination (Fig. 2), leading to a quasi-ordered short-range distribution of impurity scatterers in the liquid. Sulfur is the only alloying element that leads to a negative TCR. As saturation with compression is reached, secondary electronic effects at the Fermi surface are noticeable (Wagle et al., 2018). By contrast, silicon substitutes for iron in a random fashion to a good approximation, as shown by the similarity of pair distribution functions and coordination numbers compared to pure iron (Figs. 1 and 2). Impurity resistivity of oxygen is the lowest among the light elements investigated. It occupies interstitial positions between iron atoms and has the smallest scattering cross section, with little influence on total resistivity.
4 Resistivity profiles of the cores of Mars and the Earth
The significance of saturation mechanisms on resistivity profiles of planetary cores is presented in Fig. 5, where we show ρ(P) along proposed core isentropes of Mars (Fei and Bertka, 2005) and the Earth (Kamada et al., 2012). The simultaneous increase of T and P along an isentrope leads to competing effects on resistivity (Section 3.2): ρ increases with T and decreases with P, with a net effect of slowly decreasing resistivity as a function of pressure. Fe–S alloys exhibit a significantly shallower slope than pure Fe, Fe–O and Fe–Si alloys at both low and high P conditions. This results in a resistivity crossover of the corresponding silicon and sulfur concentrations at conditions of the Earth's OC, an effect that is related to the ongoing coordination change in the highly saturated Fe–S alloy. Considering that xeff is similarly shortened in both Fe–S and Fe–Si alloys (Fig. 4), the increase in Fe–S coordination with P (Fig. 2) and the effective S–S repulsion (Fig. 1) leads to more efficient impurity scattering than the randomly distributed Si atoms.

Electrical resistivity profiles for various iron–light-element alloys along the proposed core isentropes of Mars (Fei and Bertka, 2005) and of the Earth (Kamada et al., 2012). The error bars shown have been calculated from the largest relative uncertainty of all resistivity datapoints of a given composition (Fig. 3). Results for Fe77.7S22.3 (Mars) and Fe80.8S19.2 (Earth) by Suehiro et al. (2017), computational results for the ternary Fe–Si–O system by Pozzo et al. (2012, 2013), as well as results from studies of various Fe–Si alloys made by Matassov (1977) (dynamic compression) and Gomi et al. (2013) (extrapolation of ambient temperature experiments) are included for comparison.
Fig. 5 contains datapoints for Fe–Si alloys, which have been directly measured in dynamic compression experiments or based on low-T static experiments. Shock data for comparable Fe–Si alloys by Matassov (1977) show somewhat larger values than our computed resistivity profiles near the core–mantle boundary (CMB) pressure. Although the temperature corresponding to these data differs from the proposed isentrope by up to 1000 K, T is expected to have a small effect on resistivity in the highly resistive systems considered. We find our results to be in excellent agreement with the extrapolation of Gomi et al. (2013) at CMB pressure, and slightly higher at ICB pressure (∼10%).
Previous computational results for ternary liquid Fe–Si–O alloys along a different core adiabat (Pozzo et al., 2013) plot between our Fe3Si and Fe3O profiles, suggesting that the presence of O in an Fe–Si alloy lowers resistivity significantly. As a consequence of the Ioffe–Regel limit, the difference in T between the different adiabats used here and that in Pozzo et al. (2013) is not expected to have a large effect on resistivity. For pure iron, without the effect of saturation, their numbers along a hotter core adiabat (TICB ≈ 6350 K) are somewhat higher than ours.
Based on an analysis of experimental data for the Fe–Si–S system, Suehiro et al. (2017) calculated substantially lower and steeper resistivity profiles along the same isentropes, and, in contrast to our results, find sulfur to cause a smaller impurity resistivity than silicon. While the underlying extrapolated resistivity data for pure Fe and Fe–Si alloys (Gomi et al., 2013, 2016) are consistent with the DFT–MD-based results by de Koker et al. (2012) at conditions of the Earth's core, it is surprising that the (inferred) conductivity profile of Fe80.8S19.2 is very close to the computational results for pure iron. However, Matthiessen's rule—which Suehiro et al. (2017) use for calculating the impurity resistivity of sulfur from pure Fe, Fe–Si, and Fe–Si–S resistivity—has been shown to break down in the saturation limit (Gomi et al., 2016), which might in part account for the discrepancy.
As resistivity of a liquid iron alloy with a large amount of light elements is saturated, and, as a consequence, the resistivity profile is virtually independent of T, it is not expected to change significantly over geological time as the planet cools. This likely remains valid across the melting point upon the formation of an inner core, for two reasons. (i) Si and S, the elements that are mostly responsible for resistivity saturation, partition almost equally between the liquid and the solid (Alfè et al., 2002). Oxygen, which preferentially remains in the liquid portion of the core, contributes only little to total impurity resistivity. (ii) The resistivity discontinuity across the melting curve is expected to become negligible at high P (Wagle and Steinle-Neumann, 2018).
The evolution of a magnetic field generated by a convection-driven dynamo is therefore—to the first order—determined by the vigor of thermo-chemical convection, changing spatial constraints and magnetic boundary conditions as the inner core grows, not by changes in resistivity.
5 Conclusions
By using first principles simulations, we compute the structural properties and the electrical resistivity of liquid iron alloys up to pressure and temperature of the Earth's inner core, with different concentrations of silicon, oxygen, and sulfur. We find correlations between short-range order and the effective electron mean free path.
At high pressure, silicon and sulfur substitute for iron in the liquid structure, and are found to substantially shorten the mean free path, which is reflected by high coordination numbers, near the close packing limit. As the mean free path becomes comparable to the mean interatomic distance, resistivity saturates. Once the system is close to saturation, resistivity becomes independent of temperature. Confirming results of previous studies, sulfur atoms prefer to be isolated from one another (Alfè and Gillan, 1998; Morard et al., 2014) and therefore distribute more evenly in liquid iron than silicon. Compared to a randomly substituted configuration, electron scattering is then more efficient, as scattering cross sections of impurity atoms are less likely to overlap. In the saturation limit at high densities and sulfur concentrations, this leads to a negative temperature coefficient of resistivity due to secondary electronic effects at the Fermi level, which cannot be observed in the Fe–Si system.
Oxygen, which is incorporated into the liquid on interstitial positions and has a considerably smaller scattering cross section, does not affect the mean free path compared to pure iron in a significant way. Correspondingly, the Fe–O system is not close to the Ioffe–Regel limit and retains a positive temperature coefficient of resistivity throughout the pressure and temperature range investigated.
Computed resistivity profiles along core adiabats for Mars and the Earth are considerably shallower than estimates based on experimental data using Matthiessen's rule. As liquid iron alloys with high concentration of sulfur or silicon are in the Ioffe–Regel limit at high densities, resistivity will be independent of temperature and is therefore unlikely to change substantially with time during core evolution.
Acknowledgments
This work was supported by Deutsche Forschungsgemeinschaft (German Science Foundation, DFG) in the Focus Program “Planetary Magnetism” (SPP 1488) with Grant STE1105/10-1 and Research Unit “Matter under Planetary Interior Conditions” (FOR 2440) with Grant STE1105/13-1. Computing and data resources for the current project were provided by the Leibniz Supercomputing Centre of the Bavarian Academy of Sciences and Humanities (www.lrz.de). Comments by two anonymous reviewers helped to significantly improve the manuscript.