

1 Introduction
The Earth's core is not only composed of iron–nickel (Fe–Ni) alloy, but also needs other lighter impurities to explain the 8–10% density deficit with respect to pure Fe (e.g., Poirier, 1994). Hydrogen as a light element in the Earth's core has been a focus of interest for more than six decades (Badding et al., 1991; Birch, 1952; Fukai and Akimoto, 1983; Iizuka-Oku et al., 2017; Mao et al., 2004; Shibazaki et al., 2012; Stevenson, 1977). Therefore, the effects of hydrogen on crystal structures of Fe and the compressibility of FeHx under high pressure have been extensively studied. Stoichiometric FeHx (x ∼ 1.0) has been confirmed to show three types of high-pressure polymorph: body-centered cubic (bcc), double hexagonal close-packed (dhcp), and face-centered cubic (fcc) phases of FeHx (e.g., Sakamaki et al., 2009). FeH2, FeH3, and FeH5 were recently discovered at high pressures and high hydrogen concentration conditions (Pépin et al., 2014, 2017). Because of hydrogen's low atomic weight, about 1 wt.% (36 at.%) of hydrogen in Fe would be enough to account for the density deficit in the core (Poirier, 1994; Umemoto and Hirose, 2015). The required hydrogen content in the core becomes smaller in the case of Fe hydride with the other candidate light elements such as Si and S (Shibazaki et al., 2011; Tagawa et al., 2016; Terasaki et al., 2011).
The electrical and thermal conductivity of the Earth's core is crucial for understanding the cooling history and thermal evolution of the Earth's interior (e.g., Labrosse, 2015). Recent studies reported that the conductivity of pure Fe is much higher than we have ever thought (de Koker et al., 2012; Gomi et al., 2013; Ohta et al., 2016; Pozzo et al., 2012), but contrasting results exist (Konôpková et al., 2016; Xu et al., 2018). Light elements and dilute Ni in the core act as additional electron scatterers in the Fe alloy, and thus reduce the conductivity of the host metal. Impurity effects of Si, O, S, C, and Ni on Fe conductivity have already been investigated at high pressures (de Koker et al., 2012; Gomi and Hirose, 2015; Gomi et al., 2013, 2016; Pozzo et al., 2012; Seagle et al., 2013; Secco, 2017; Suehiro et al., 2017; Wagle et al., 2018; Zhang et al., 2018). However, the effect of hydrogen solution on the conductivity of Fe and Fe–Ni alloy remains unknown.
In this study, we measured high-pressure (P) and temperature (T) electrical resistivity (the reciprocal of electrical conductivity) values of fcc FeHx up to 65 GPa and fcc FeNiHx at 47 GPa in a laser-heated diamond anvil cell (LHDAC). The hydrogen content (x) in our samples was estimated based on synchrotron X-ray diffraction (XRD) studies. From the obtained results, we constrain the transport properties in the Fe–H system at high P–T conditions. Since the impurity resistivity of hydrogen in Fe is found to be very small, hydrogen would not play an important role in the conductivity of the Earth's core.
2 Experimental methods
Fe (–Ni) hydrides with fcc structure were prepared by laser heating of Fe or Fe–Ni alloy in the presence of an internal hydrogen source in a LHDAC with 300 μm culet anvils. The host metals were the pure Fe foil (99.99% purity) and the foil of Fe containing 10 wt.% (9.56 at.%) Ni, which are the same products as those used in the literature (Gomi and Hirose, 2015; Gomi et al., 2013; Ohta et al., 2016). Hydrogen was supplied into the sample chamber by a decomposition reaction of paraffin (CnH2n+2, n > 5). This method has been used for the successful synthesis of fcc FeHx in a LHDAC (Narygina et al., 2011; Thompson et al., 2018). The paraffin also served as a pressure transmitting medium and thermal insulator against diamond anvils.
All the experiments were performed at BL10XU, SPring-8. A monochromatic X-ray beam with an energy of 30 keV was directed at the sample. Angle-dispersive XRD spectra were acquired on a flat-panel detector (PerkinElmer). The sample-to-flat-panel distance, the wavelength of the incident X-ray, and the flat panel geometry were calibrated with a CeO2 standard. The high temperature was generated by using a couple of 100 W Yb-fiber lasers. We collected thermal radiation from the heated sample and analyzed it to convert the temperature (Ohishi et al., 2008). The pressures were determined at 300 K from a spectrum of ruby fluorescence (Dorogokupets and Oganov, 2007) for FeHx alloys and the diamond Raman edge method (Akahama and Kawamura, 2006) for FeNiHx alloy.
Methods for the high P–T electrical resistivity measurements in a LHDAC are similar to our previous studies (Ohta et al., 2016; Suehiro et al., 2017). The Fe and Fe–10 wt.% Ni foils were shaped into the sample with four electrodes by using a focused-ion-beam (FIB) apparatus. The shaped metal foil sample and the paraffin were loaded into a sample chamber at the center of an insulated gasket consisting of Re and cBN. Four electrical leads made of Pt were connected to each Fe (or Fe–Ni) electrode outside the sample chamber. The electrical resistance of the sample was measured by the four-terminal method using a SourceMeter (Keithley 2450) under a constant direct current of 100 mA. Since temperature heterogeneity in a laser-heated area of the sample generates thermo-electric power, we measured the voltages of samples by passing direct current from both current directions and averaging these two voltage values to eliminate the effect of thermo-electric power.
We use an empirical method proposed by Fukai (1992) to estimate hydrogen content (x) in the prepared and :
| (1) |
3 Results
We first synthesized the Fe (–Ni) hydrides at around 50–60 GPa and 1700 K for all runs that were monitored by XRD (Fig. 1). The obtained XRD patterns indicate that the hcp Fe sample and paraffin reacted and formed Fe carbides (Fe3C and Fe7C3) soon after the beginning of laser heating, and then the Fe carbides disappeared, and fcc FeHx and the diamond formed in one hour. Our experiments perfectly reproduced the previous study of fcc FeHx formation (Narygina et al., 2011). Incorporation of hydrogen expands the Fe lattice so that the lattice volume of fcc FeHx is much larger than that of fcc Fe at equivalent conditions.
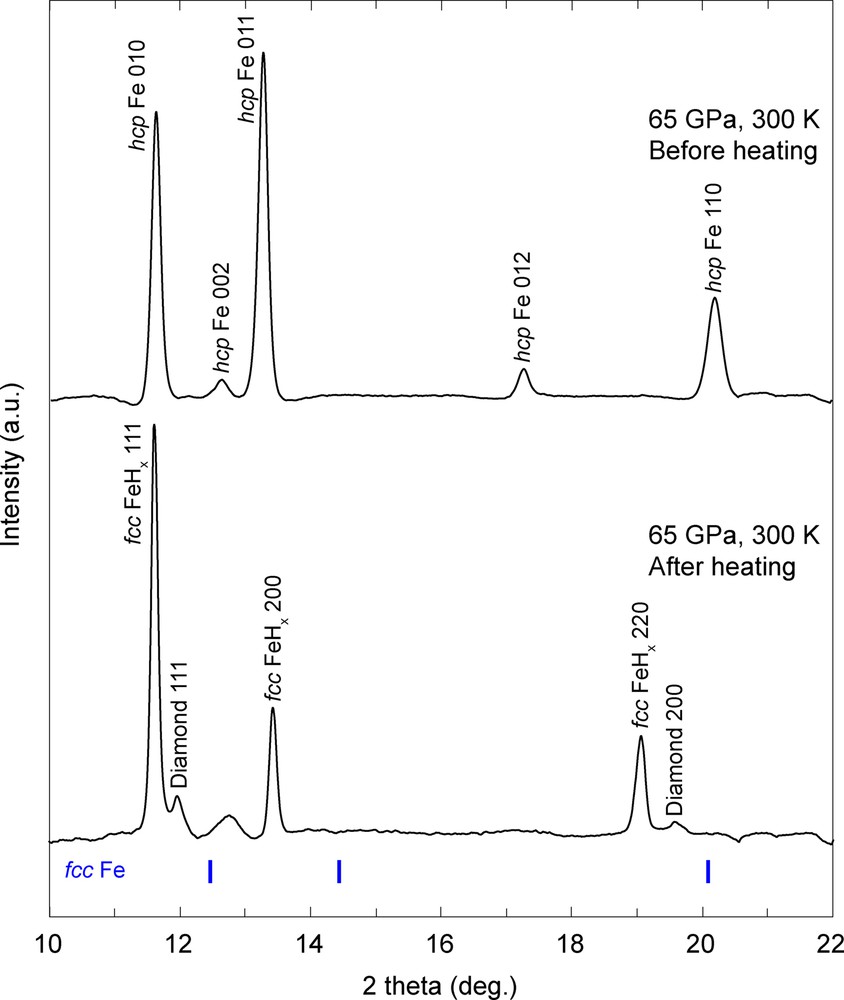
Representative XRD patterns obtained before and after laser heating for an Fe sample and paraffin pressure medium in the first run. (Upper pattern) The diffraction lines of hcp Fe obtained at 65 GPa before laser heating. (Lower) XRD peaks from fcc FeHx and diamond, which are reaction products of Fe and paraffin after laser heating. The calculated XRD peak positions of fcc Fe at 65 GPa and 300 K are shown by blue bars.
After the formation of Fe (–Ni) hydrides at around 50–60 GPa, we changed the pressures to perform electrical resistivity measurements on fcc FeHx at 34, 39, and 65 GPa and on fcc FeNiHx at 47 GPa, respectively. We did not conduct the resistivity measurements at higher pressures to avoid the occurrence of the Fe polyhydrides, although the stable P–T conditions of the Fe polyhydrides remain unknown (Pépin et al., 2014, 2017). The results of the resistivity measurements are shown in Fig. 2. For comparison, we also plot the resistivity data of Fe at 26 GPa up to 2610 K (Ohta et al., 2016) and the calculated resistivity values of Fe and Fe–10 wt.% Ni alloy based on the model proposed by Gomi and Hirose (2015). This model considers the resistivity saturation phenomenon and Matthiessen's rule for Ni impurity as follows. The resistivity saturation is expressed by the shunt resistor model (Wiesmann et al., 1977):
| (2) |
| (3) |
| (4) |
| (5) |
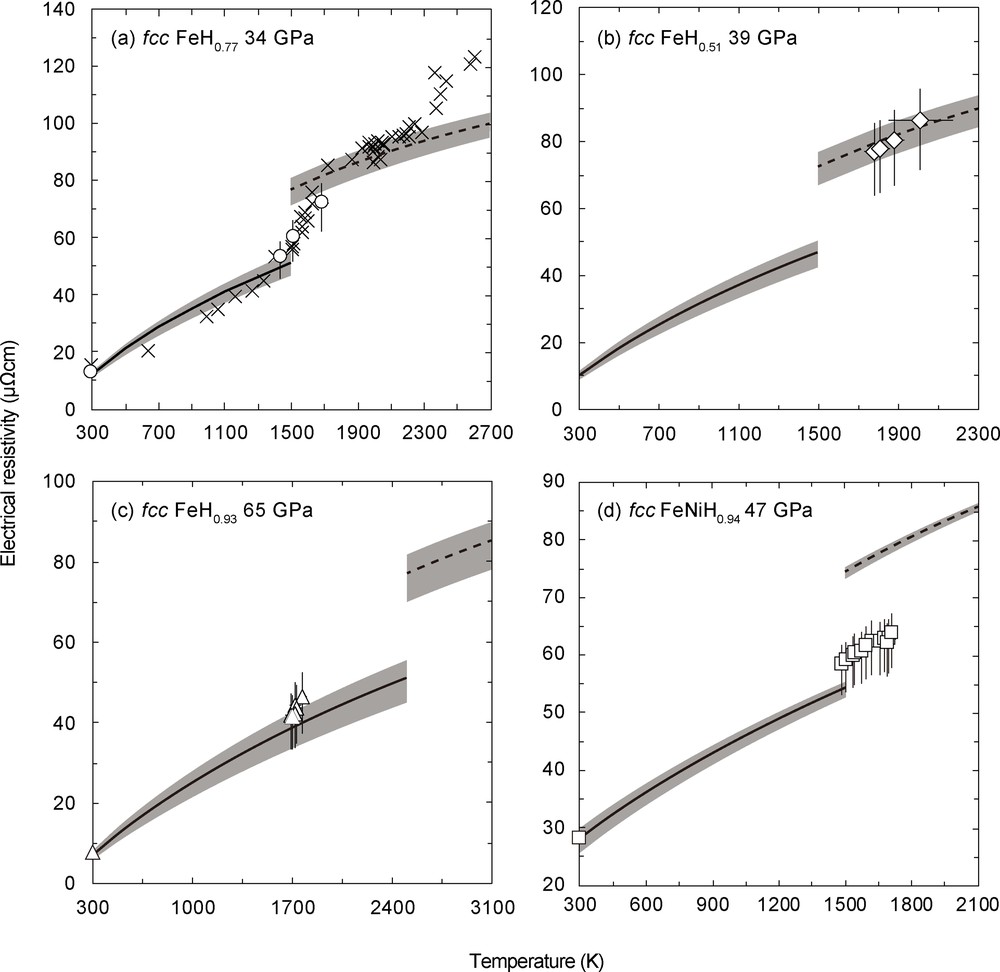
High-T electrical resistivity values of (a) fcc FeH0.77 at 34 GPa, (b) fcc FeH0.51 at 39 GPa, (c) fcc FeH0.93 at 65 GPa, and (d) fcc FeNiH0.94 at 47 GPa shown as open symbols in each panel. The crosses in Fig. 2a indicate the reported resistivity data of Fe at 26 GPa (Ohta et al., 2016). Black lines with gray band are the calculated resistivity values of hcp Fe and hcp Fe–10 wt.% Ni alloy using the model proposed in the literature (Eq. (2)–(5)) (Gomi et al., 2013; Gomi and Hirose, 2015). Black broken lines are for fcc Fe and fcc Fe–10 wt.% Ni alloy. The temperatures of hcp to fcc phase transition at each pressure are taken from Anzellini et al. (2013) for Fe and from Komabayashi et al. (2012) for the Fe–10 wt.% Ni alloy.
where ΘD(V) is the Debye temperature and B(V) is a material constant. The impurity resistivity of Ni has been determined using the following equation (Gomi and Hirose, 2015):
| (6) |
The EoS of hcp Fe (Dewaele et al., 2006) is used to calculate the values of V and ΘD(V). We assume a twofold increase of the ρFe(V,T) due to the hcp–fcc transition as in 26 GPa data (Fig. 2a).
In the first run at 65 GPa, the resistance of the synthesized fcc FeHx sample increased by 2% compared to that of hcp Fe, which was measured before heating at 300 K. The hydrogen content of this sample was calculated as x = 0.93 using Eq. (1). Considering the increase in the resistance and the volume expansion due to the fcc FeH0.93 formation, we converted the high-P/room-T electrical resistivity of hcp Fe determined by Gomi et al. (2013) to high-P/room-T resistivity of the fcc FeH0.93 at 65 GPa. High-P/high-T resistivity of the fcc FeH0.93 was calculated from the ratio of resistance measured at high temperature up to 1770 K to that measured at room temperature, multiplied by the high-P/room-T resistivity of the fcc FeH0.93 (Fig. 2c). As shown in Fig. 2c, the resistivity of fcc FeH0.93 is 5–18% higher than that of hcp Fe, but they are comparable within the experimental uncertainty.
According to the previous studies, the hydrogen solubility in fcc Fe and the fcc Fe–Ni alloy decreases with increasing the temperature in a certain pressure range (Hiroi et al., 2005; Shibazaki et al., 2014). Therefore, we expected to be able to vary the hydrogen content in the pre-synthesized FeH0.93 to make the pressure and temperature conditions deviate from those in the pre-synthesis situation. Thus, we decompressed the same sample to 34 GPa, and annealed it at about 1700 K. After annealing, the hydrogen content decreased to x = 0.77 as we had expected, implying that the process of hydrogen dissolution into fcc Fe is exothermic (x decreases with increasing T) at 34 GPa. We determined the resistivity values of fcc FeH0.77 at 34 GPa up to 1690 K (Fig. 2a). These values are intermediate between those of hcp and fcc Fe in the same P–T conditions.
The resistivity of the fcc FeHx was also examined at 39 GPa up to 2100 K in a different run (Fig. 2b). We synthesized the fcc FeHx at 48 GPa and 1750 K in 1 hour, and then decreased the pressure to 39 GPa and annealed it. We found that this sample's x value was 0.51 after annealing. The obtained resistivity of fcc FeH0.51 is very similar to that of fcc Fe, conversely to hcp Fe, which is different from the case for fcc FeHx, with a higher hydrogen concentration, as shown in the first run (Fig. 2a, c).
A similar experiment was also carried out on an Fe–Ni-H system (Fig. 2d). fcc Fe–Ni hydride was formed at 47 GPa and around 1700 K in 1.5 h. Its hydrogen content was determined as FeNiH0.94. The reported experimental result (Gomi and Hirose, 2015) was taken as the reference value of the resistivity of Fe–10 wt.% Ni alloy at 47 GPa and 300 K. This nearly stoichiometric fcc Fe–Ni hydride showed a resistivity value similar to that of hcp Fe with 10 wt.% Ni alloy, which was calculated using the model proposed by Gomi and Hirose (2015) (Table 1).
Experimental conditions, observed volumes, hydrogen contents, and electrical resistivities.
| Run | P (GPa)a | T (K) | Phase | Observed lattice V (Å3) | x | Resistivity (μΩ·cm) |
| 1 | 65 | 300 | fcc FeHx | 44.51 (6) | 0.93 | 8.0 (+1.0/−1.6) |
| 1690 (40) | fcc FeHx | 41.8 (+5.4/−8.4) | ||||
| 1700 (30) | fcc FeHx | 41.6 (+5.4/−8.3) | ||||
| 1720 (30) | fcc FeHx | 42.2 (+5.5/−8.4) | ||||
| 1720 (40) | fcc FeHx | 44.4 (+5.8/−8.9) | ||||
| 1730 (40) | fcc FeHx | 43.7 (+5.7/−8.7) | ||||
| 1770 (30) | fcc FeHx | 46.5 (+6.0/−9.3) | ||||
| After decompression and annealing | ||||||
| 34 | 300 | fcc FeHx | 46.13 (4) | 0.77 | 12.6 (+1.3/−1.8) | |
| 1440 (30) | fcc FeHx | 53.3 (+5.3/−7.5) | ||||
| 1520 (30) | fcc FeHx | 60.1 (+6.0/−8.4) | ||||
| 1690 (30) | fcc FeHx | 72.0 (+7.2/−10.1) | ||||
| 2 | 48 | 300 | fcc FeHx | 44.95 (14) | 0.81 | 9.5 (+1.1/−1.4) |
| After decompression and annealing | ||||||
| 39 | 300 | fcc FeHx | 43.27 (8) | 0.51 | n.d. | |
| 1780 (50) | fcc FeHx | 76.9 (+8.5/−13.1) | ||||
| 1810 (50) | fcc FeHx | 77.9 (+8.6/−13.3) | ||||
| 1880 (50) | fcc FeHx | 80.5 (+8.9/−13.7) | ||||
| 2010 (160) | fcc FeHx | 86.2 (+9.5/−14.7) | ||||
| 3 | 47 | 300 | fcc FeNiHx | 46.21 (6) | 0.94 | 28.1 (+1.6/−2.6) |
| 1490 (20) | fcc FeNiHx | 58.3 (+3.3/−5.4) | ||||
| 1500 (20) | fcc FeNiHx | 59.0 (+3.3/−5.4) | ||||
| 1530 (20) | fcc FeNiHx | 59.9 (+3.4/−5.5) | ||||
| 1540 (20) | fcc FeNiHx | 60.3 (+3.4/−5.5) | ||||
| 1570 (20) | fcc FeNiHx | 60.6 (+3.4/−5.6) | ||||
| 1590 (20) | fcc FeNiHx | 61.5 (+3.5/−5.6) | ||||
| 1620 (20) | fcc FeNiHx | 62.4 (+3.5/−5.7) | ||||
| 1660 (30) | fcc FeNiHx | 62.3 (+3.5/−5.7) | ||||
| 1680 (30) | fcc FeNiHx | 62.8 (+3.5/−5.8) | ||||
| 1690 (30) | fcc FeNiHx | 62.0 (+3.5/−5.7) | ||||
| 1700 (30) | fcc FeNiHx | 62.3 (+3.5/−5.8) | ||||
| 1710 (20) | fcc FeNiHx | 63.7 (+3.6/−5.9) |
a Pressures were determined from the ruby method in Runs 1 and 2 and from the diamond Raman method in Run 3.
4 Discussion
dhcp FeHx (x ∼ 1.0) has been confirmed to have its metallic property denoted by the resistivity increase with increasing temperature (Matsuoka et al., 2011), but it is unknown whether other phases of the Fe hydride are metallic or insulator. The present study revealed the electrical transport properties of nearly stoichiometric fcc FeHx and FeNiHx (x ∼ 1.0), and nonstoichiometric fcc FeHx (x = 0.77 and 0.51) at high pressures and high temperatures, and all the examined fcc Fe (–Ni) hydrides showed a metallic nature (Fig. 2). In addition, our results indicate that hydrogen-rich fcc FeHx (x > 0.5) becomes more conductive with increasing the hydrogen content.
The core density deficit requires about 1 wt.% (36 at.%) of hydrogen as the sole light element in the core (Poirier, 1994; Umemoto and Hirose, 2015). Therefore, in order to discuss the effect of hydrogen on the Earth's core conductivity, the impurity resistivity of the minor amount of hydrogen in Fe is important to constrain. Note, however, that the Matthiessen's rule is only valid at a low impurity concentration up to about 20 at.% in general (Gomi et al., 2016). In some metallic binary continuous solid solutions, the dependence of the resistivity on the composition is characterized by a convex parabolic curve. We predicted the resistivity in an Fe–FeH system from the present data and the form of Nordheim's rule:
| (7) |
where ρFe and are the electrical resistivities of Fe and FeH1.0, respectively, and k is a positive constant that depends on the alloy system. Here we assume the resistivity of fcc FeH1.0 is the same as that of hcp Fe based on our results (Fig. 2). Fig. 3 shows the predicted relation of the resistivity in a fcc Fe–fcc FeH1.0 system at 34 GPa and 1690 K with that at 39 GPa and 2100 K. The k values in Eq. (7), i.e. 61 at 34 GPa and 55 at 39 GPa, fit our experimental data. The volume-dependent impurity resistivity values of Si, Ni, S, and C (ρSi, ρNi, ρS, and ρC) have been experimentally determined (Gomi and Hirose, 2015; Gomi et al., 2016; Suehiro et al., 2017; Zhang et al., 2018). The obtained ρSi, ρNi, ρS, and ρC are 7.2, 2.9, 4.6, and 12.1 μΩ·cm/at% at 34 GPa, and are 6.8, 2.8, 4.4, and 11.4 μΩ·cm/at% at 39 GPa, respectively. We calculated the resistivity values of fcc Fe with Si, Ni, S, and C using their impurity resistivity values and Eqs. (2)–(5) (Fig. 3). The effect of a small amount of hydrogen on Fe resistivity is likely to be weaker than that of these four elements. Gomi et al. (2013) also predicted the impurity resistivity of O in Fe (ρO) based on the Norbury–Linde rule. According to this rule, the ρO is one-fourth of the ρSi, although the validity of the Norbury–Linde rule for iron alloys at high pressures is unclear. To the best of our knowledge, the strongest impurity scatterer in iron among the core light element candidates would be carbon, while the weakest one would be hydrogen in the present experimental pressures range.

The electrical resistivity in an FeHx system (a) at 34 GPa and 1690 K, and (b) at 39 GPa and 2100 K. The open symbols are the present data (Fig. 2a, b). The black lines with gray band indicate the resistivity of FeHx as a function of the hydrogen content x estimated from the form of Nordheim's rule. The effects of C, Si, S, and Ni on the Fe resistivity are calculated from Matthiessen's rule and the saturation model (Eq. (2)–(5)). Orange, Fe–C alloy from Zhang et al. (2018); blue, Fe–Si alloy from Gomi et al. (2016); red, Fe–S alloy from Suehiro et al. (2017); green, Fe–Ni alloy from Gomi and Hirose (2015).
Incorporation of hydrogen significantly decreases the density and the melting temperature of Fe, even when in low quantities. Such characteristics of hydrogen appear to elucidate the density deficit of the core (e.g., Badding et al., 1991) and the low solidus temperature of the pyrolytic lowermost mantle (Nomura et al., 2014). However, the present study indicates the minor contribution of hydrogen incorporation in the core to electrical conductivity, and hence the electronic thermal conductivity. The 1 wt.% (36 at.%) hydrogen incorporation enhances the electrical resistivity of Fe a few % at 39 GPa and 2100 K (Fig. 3b). Hydrogen impurity resistivity would decrease with increasing pressure, as it does for other light elements (Gomi et al., 2016; Suehiro et al., 2017; Zhang et al., 2018), so that the influence of hydrogen in the Earth's core resistivity should be smaller. The hydrogen content in the uppermost core could increase as a result of the interaction between the core and hydrous minerals such as the δ-AlOOH, phase H of MgSiO4H2 and pyrite-type FeOOH in the mantle and subducting slab (Nishi et al., 2014, 2017; Terasaki et al., 2012), which would induce the compositional layering in the outer core (Helffrich, 2014). However, the increase in hydrogen solubility at the top of the core has a very limited influence on the core conductivity and thus the thermal evolution of the core.
Acknowledgments
We thank Dr. Takahiro Matsuoka for discussion. In situ high P–T synchrotron XRD measurements were performed at BL10XU, SPring-8 (proposals No. 2014B0087, 2015A0087, and 2017B0072). This work was supported by JSPS KAKENHI, Grant Numbers 15H05827 and 17H04861.