

1 Introduction
The laser-heated diamond anvil cell, being the only experimental tool able to create extreme static pressures (P > 100 GPa) and temperatures (T > 3000 K), has a major impact on high-pressure research and geophysics. The first paper on laser heating was published by Ming and Basset in 1974 (Ming and Bassett, 1974). Currently, LH-DAC is one of the most fundamental tools in the field of high-pressure mineral physics research (Bassett, 2001). This is primarily due to its unique ability to reproduce the entire range of pressures and temperatures encountered in the Earth's interior (Anderson, 1989). LH is based on the principle of absorption of IR light by the sample after the light has passed through one or both of the diamond anvils, with only minor intensity loss. However, conventional LH-DAC systems result in the heterogeneous heating of a specimen inside a DAC by IR laser accounting for one of the weaknesses of this technique. Both the four-color (Campbell, 2008) and multi-color (Machikhin et al., 2016) approaches allow the 2-D temperature distribution to be measured. Another important step in laser heating in a DAC was taken when it was found that the shape of the IR laser beam on the surface of the heated specimen could be controlled by the π-shaper (Prakapenka et al., 2008). To control the temperature distribution on the surface of the heated specimen, it is necessary to measure the distribution of the power of the IR laser beam on the surface. Unfortunately, the distribution of the IR laser power in a DAC has not been reported yet. The aim of this study is to demonstrate that the use of LH-DAC combined with TAOTF allows for simultaneous measurements of the 2-D distributions of (a) the intensity of the IR laser beam, and (b) the temperature distribution on the LH specimen in a DAC. We will also show the effect of the π-shaper on the shape and the position of the focus of the IR laser beam on a specimen using the TAOTF. It has been shown recently that the application of the TAOTF in LH-DAC systems provides the temperature distribution on the LH specimen in a DAC (Bykov et al., 2018; Machikhin et al., 2016). Besides the option to measure the 2-D distribution of the IR laser power, the use of the TAOTF is extremely helpful for aligning the IR laser for heating in a DAC. The development of this technique will allow conducting different experiments, such as (a) measurements of the thermal conductivity, (b) observation of the melting of materials under high-pressure and high-temperature, and (c) measurements of the beam expansion of the IR laser as a function of the laser power.
2 Experimental details
Measurements of the temperature distribution of the laser-heated surface of a free plate are very sensitive to the focal plane position of the laser beam. The first laser used for LH was the yttrium aluminum garnet (YAG) laser (Bassett, 2001). Currently, one of the most popular lasers for LH is the neodymium-doped YAG (Nd:YAG) laser. Nd:YAG lasers produce infrared light at a wavelength of 1064 nm. Since IR laser beams are invisible, it is difficult to find the focal plane of the IR laser beam using a standard optical imaging system consisting of an objective and an optical camera. In our study, we propose to align the IR laser by using the TAOTF. The TAOTF enables the visualization of the IR laser beam on the optical camera and can locate the position of the focal plane of the IR laser. A symmetrical DAC equipped with a pair of type-I brilliant-cut diamond anvils (300 and 250 μm culets) was used in the experiment. A fully hardened stainless-steel gasket, 250 μm in thickness, was first indented to 40 μm, and then a hole with a diameter of 100 μm was drilled, which served as the sample chamber. Sodium chloride (NaCl) was loaded between the Pt/Fe specimen and the diamond anvil for thermal isolation to ensure efficient laser heating of the specimen. Pressure was measured using the positions of the fluorescence peaks of a small ruby chip before laser heating.
2.1 LH-DAC–TAOTF setup
The design of the LH system is similar to that described elsewhere in the literature (Prakapenka et al., 2008; Zinin et al., 2016). The main difference is that, in our configuration, LH is applied to one side of the specimen (plate, DAC). An experimental LH–TAOTF setup operating in the reflection configuration is shown in Fig. 1. The central part of the system is a remotely controlled xyz stage (Standa, Lithuania). The z-axis is parallel to the probe laser beam, the x-axis is normal to the probe laser beam and parallel to the surface of the optical table, and the y-axis is normal to the surface of the optical table (Fig. 1). The specimen is secured onto the stage by a DAC holder designed by GeoSoilEnviroCars (GSEG + CARS, University of Chicago, USA).

Sketch of the LH–TAOTF system. Infrared (IR) laser: continuous-wave infrared laser (IPG Photonics, model YLR-100-AC-Y11); DAC: diamond anvil cell; OB1: long-working distance objective (10×, M, Plan Apo, L, NA = 0.28, f = 20 mm, Mitotoya, USA); M1, M2: controlled mirrors; NM: narrow-line mirror; L1: long focal distance lenses (f = 400 mm, AC254-400-B, Thorlabs); LS: wideband light source; π-shaper (AldOptica, model πShaper 6_1064); TAOF: tunable acousto-optic filter (A-Optic, Russia); BS1: cubic beam splitter (50/50); C1: monochrome camera Allied Vision Mako G-030B (309 fps @ 644 × 484 pixels). Masquer
Sketch of the LH–TAOTF system. Infrared (IR) laser: continuous-wave infrared laser (IPG Photonics, model YLR-100-AC-Y11); DAC: diamond anvil cell; OB1: long-working distance objective (10×, M, Plan Apo, L, NA = 0.28, f = 20 mm, Mitotoya, USA); M1, M2: controlled mirrors; NM: narrow-line mirror; ... Lire la suite
The technical design of the IR fiber laser lasing at 1070 nm allows precise control of the total power (range 2–100 W) by changing the diode current. The IR laser beam is guided to the sample position with mirrors (M1, M2, and NM). A π-shaper is designed to control the LH spot's shape and size (Prakapenka et al., 2008). The laser beam is reflected by a narrow-line mirror (NM) after the π-shaper. Then the IR laser beam is focused by the OB1 on the surface of a specimen in the DAC and heat the specimen. The radiation coming from the specimen consists of a reflected IR laser beam at 1070 nm, and of a thermal radiation from the heated specimen. The thermal radiation goes through the NM and is directed through the TAOTF to the camera C1. To image a specimen in the DAC, the imaging optical system is operated in the reflection mode. The imaging systems consist of: (a) an objective OB1; (b) a camera, C1; (c) beam splitter, BS1, used to direct light from the bulb (LS) towards the objectives OB1 through a mirror M3; and (d) the lens (L1) to focus the radiation onto the camera's detector. The BS1 splitter is removed during laser heating. An imaging optical system allows imaging of the specimen in DAC in the reflection mode (Wilson and Sheppard, 1984; Zinin et al., 2012). The calibration of the field of view was done using a glass plate with a 50-μm grid. A segment of 0.24 μm on the object's plane was found to image one pixel of the camera's detector. Because the size of the pixel is 4.8 μm, the magnification of our optical system appears to be around 20. This is close to the magnification of the 4-color multi-wavelength imaging radiometry system described in Du et al. (2013), where a segment 0.48 μm in length at the object's plane was projected to 9 μm pixel of a camera providing a magnification of 18.8. The value of the magnification is close to the theoretical one: it is proportional to the ratio of the focal distance of the lens C1 (f = 400 mm) to that of the objective OB1 (f = 20 mm): 400 mm/20 mm = 20. The calibration of the field of view with the grid revealed that there was a 0.5-μm shift in the vertical direction (< 4 pixels) and a 2.2-μm shift in the horizontal direction (∼ 8 pixels). This shift is comparable to the focal spot of the OB1 objective and close to the resolution of the optical system. The shift was corrected by the software, considering the linear dependence of the shift on the wavelength.
2.2 TAOTF
Measurements of the 2-D-TD of a tungsten filament heated by a constant current with TAOTF can be found elsewhere (Machikhin et al., 2016). Briefly, the 2-D-TD measurement is based on the TAOTF synchronized with a digital video camera (Machikhin et al., 2016). As shown in Machikhin et al. (2017), Mazur et al. (1996), and Wang and Zhang (2016), the tandem AO filtration system combines reliable spectral imaging with several important features: absence of image distortions and chromatic drift; high spectral contrast; and increased signal-to-noise ratio. The measured intensity in each pixel (x, y) of the TAOTF spectroscopic image is proportional to the intensity of light irradiated by the corresponding element of the specimen's surface at a given wavelength (λ). Each AOTF is a solid-state spectral band-pass filter that works on the principle of AO anisotropic diffraction in a birefringent crystal (Goutzoulis et al., 1994). The AOTFs usually consist of an AO cell (AOC) and a pair of crossed polarizers. The AOC is a TeO2 crystal to which a piezoelectric transducer is bonded. An ultrasound absorber is attached to the opposite side of the crystal. In response to the application of an oscillating radio frequency electrical signal, the transducer generates a high-frequency vibrational (acoustic) wave that propagates into the crystal.
Only a narrow spectral band (δλ) of optical radiation is deflected due to Bragg's diffraction. These spectral components carry an “e”-polarization and are separated by the output polarizer, P2, from the “o”-polarized non-diffracted beam. The selected wavelength (λ) is determined by the frequency of the ultrasonic wave f: λ ∼ (VΔn)/f, where V is the velocity of the ultrasonic wave, and Δn = ne − no is the birefringence of the crystal (Goutzoulis et al., 1994). For a given material, the plane of diffraction and configuration of the AO interaction with width L is the main parameter specifying the spectral resolution δλ ≈ λ2/(LΔn).
The use of a single AOTF inevitably leads to a reduction in spectral contrast coming from significant transmittance outside the passband (central maxima) due to the fact that the transmission function of the AOTF is described by the function sinc2(x) ≡ sin2(x)/x2, which has rather large side lobes (Goutzoulis et al., 1994). The TAOTF total transmission is defined by multiplication of the transmission functions of two AOCs and, therefore, has much weaker side lobes and provides higher spectral contrast. The TAOTF was designed and assembled as a separate PC-controlled spectral imaging device. Its main parameters are as follows: tuning range, 650–1100 nm; spectral resolution, δλ = 2 nm (at λ = 633 nm); spatial resolution, 600 × 500 resolved elements; field of view, 3 × 3; entrance pupil diameter, 8 mm; residual spatial distortion less than 0.1% of the field of view within the whole spectral range.
Because the central part of the laser line of the beam centered at 1070 nm is cut off by one filter (NM 1070 nm), the TAOTF is set at a wavelength of 1038 nm, which is outside the wave bands of the NM filter. Assuming that the intensity of the laser beam at 1038 nm is proportional to that at 1070 nm, the TAOTF image taken at 1038 nm represents the shape of the laser beam intensity on the surface of the heated object. The wavelength of 1038 nm was selected experimentally. First, we found that the signal at 1038 nm is not related to the thermal radiation. This was done by measuring the intensity of the laser radiation reflected by the 1070-nm narrow-line mirror. It was demonstrated that the maximal signal was detected at 1038 nm: it decays from 1038 nm, and is not detectable at 1050 nm, 1000 nm. Such a behavior is the result of the interaction between several factors (e.g., frequency characteristics of the C1 camera, NM filter, and a shape of the IR laser). We assume that the wavelength of 1038 nm is close to the edge of the NM filter, whereas the tale of the power spectral density of the IR laser is high enough to be detected by the C1 camera. Moreover, the intensity of the reflected signal at the wavelength of 1038 nm changes synchronously with the power of the IR laser during LH. Our assumption is that the intensity of the signal at 1038 nm is related to the reflected IR laser radiation rather than to the thermal radiation of the heated specimen. Surprisingly, the IR laser radiation operating at 1070 nm was detected far away from the central line (∼ 30 nm). Our hypothesis is that this might be due to the design of the fiber optic lasers.
Our assumption that the intensity of the laser beam at 1038 nm is proportional to that at 1070 nm is based on the following simple consideration. The power spectral density of a fiber laser has a fixed linewidth and can be described by a Lorentz-type Gaussian function F: I(λ) = I0 F[(λ − λ0), FWHM], where I(λ) is the power spectral density at the frequency λ, I0 is the power spectral density at the frequency λ0, and FWHM is the full width at half maximum. For the IPG laser, λ0 = 1070 nm, and FWHM = 7 nm. As far as λ0 (1070 nm) and λ (1038 nm) are fixed, and the FWHM is a constant, the intensity at 1038 nm, I (λ = 1038 nm) is proportional to I0 (λ = 1070 nm).
3 Results and discussion
Because the size of a specimen in a DAC usually does not exceed 100 μm, a microscopic-length objective should be used to direct the IR laser beam to the surface of the specimen (Ming and Bassett, 1974). Accurate measurement of the temperature distribution requires that the surface of the heated specimen is in the focus of the spectroscopic system during LH-DAC measurements. In the LH-DAC–TAOTF system shown in Fig. 1, the focal plane of the optical imaging system coincides with that of the TAOTF spectral system, but it may not coincide with the focal plane of the IR heating laser (Fig. 2). Therefore, it is necessary to initially find the difference between the positions of the focus of the IR laser and of the focus of the optical system.

Sketch of the laser heating of a specimen in a diamond anvil cell (DAC) showing possible positions of the focal planes of the infrared (IR) laser beam. The z-axis is directed towards the IR laser and the objective.
Fig. 3 shows the behavior of the IR laser beam or of lateral scans of the relative intensity distribution of 1070-nm laser at different focal plane positions obtained by a TAOTF imaging system. The LH–TAOTF system took measurements when the beam laser was focused on the Pt plate. The field distribution of the IR laser beam intensity is highly inhomogeneous. It is obvious that the laser beam is aligned (Fig. 3).
Lateral scans of a 1070-nm laser beam taken by a tandem acoustic-optical tunable filter (TAOTF) at 1038 nm, taken at different z positions without the π-shaper. Position z = 0 corresponds to focusing the laser on the surface of the Pt plate. The power of the laser was 5 W.
The measurements show that the diameter of the laser spot at focus is around 8 μm. It does not have a perfect shape reflecting the structure of the surface of the Pt plate. The apparent depth of the focus is around 48 μm, indicating that the real depth of focus is twice as high −96 μm. This is because the axial response of the optical system used in our setup is described by a V(z) curve (Sheppard and Wilson, 1981). An expression for the signal variation as a function of the distance Z from the sample:
| (1) |
One of the main aims of the use of the π-shaper is to create a near-to-top-flat distribution of the IR laser power on a specimen, even though such a distribution of the laser power is not a guaranty of the homogeneous temperature distribution during laser heating. It is not a simple task to get such a distribution using the π-shaper in LH-DAC system without the AOTF filter used in this study.
To investigate the effect of the π-shaper on the shape of the laser beam on the surface of a specimen, we conducted a set of experiments, studying the shape of the IR laser beam on the surface of the heated specimen inside a DAC as a function of the defocus of the objective and the rotation of the rim on the π-shaper. Fig. 4а shows the 2-D relative intensity distribution of the IR laser on the iron specimen in a DAC when the rim on the π-shaper was set at the PSR = −1 mm.
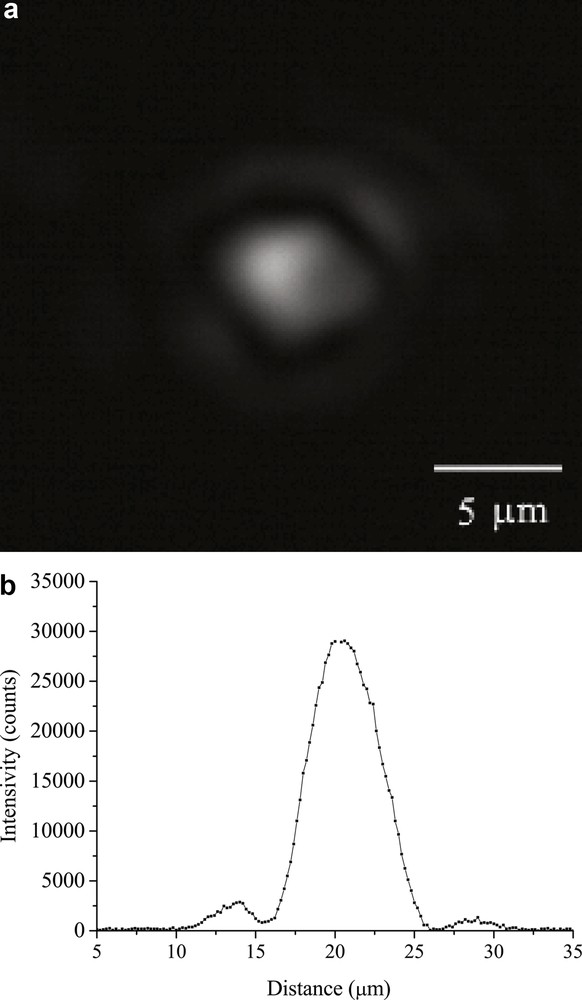
a: 2-D distribution of the infrared (IR) laser beam intensity on the steel gasket in a diamond anvil cell (DAC) at 1 GPa (the pressure was measured before and after laser heating) when the position of the π-shaper rim (PSR) was set at (PSR) = −1 mm; b: distribution of the IR laser beam intensity along the line crossing the center of Fig. 5a. The laser power was 2 W.
The one-dimensional (1-D) distribution of the laser intensity taken along the line going through the focal point of the objective is seen in Fig. 4b. The 1-D distribution of the laser intensity in the focal plane of the optical system is called the point spread function (PSF) in scanning confocal microscopy (Zinin et al., 2012). The PSF illustrates “what should be a point focus by geometrical optics is spread out by diffraction” (Briggs, 1992). For a simple pupil function, the lateral distribution (field in the focal plane) is given by a jinc function (Goodman, 1996),
| (2) |
Fig. 5 shows the 2-D and 1-D intensity distribution of the IR laser power on the surface of a specimen in a DAC when the position of the rim was set at PSR = −3 mm. The diameter of the laser spot is around 20 μm. It is twice as high as that of the spot when PSR = −1 mm. We see that the shape of the spot is not perfectly “flat top” (Fig. 5b); however, the intensity of the laser beam is homogeneous within the spot with a diameter of 15 μm.

a: 2-D distribution of the infrared (IR) laser beam intensity on the steel gasket in a diamond anvil cell (DAC) at 1 GPa (the pressure was measured before and after laser heating) when the position of the π-shaper was set at PSR = −3 mm and defocus Z = 0; b: distribution of the IR laser beam intensity along the line crossing the center of Fig. 5a. The laser power was 2 W.
Fig. 6 demonstrates the 2-D and 1-D intensity distribution when the rim position was PSR = 3 mm. The shape of the beam remains that of a donut, as the main intensity is concentrated along the rim with a diameter of 35 μm (Fig. 6b).

a: 2-D distribution of the infrared (IR) laser beam intensity on the steel gasket in a diamond anvil cell (DAC) at 1 GPa (the pressure was measured before and after laser heating) when the position of the π-shaper was set at PSR = 3 mm; b: distribution of the IR laser beam intensity along the line crossing the center of Fig. 6a. The laser power was 2 W.
Fig. 7a shows the total intensity of the beam as a function of the setting of the rim of the π-shaper when it is in the focus (Z = 0). The inset in Fig. 7a shows the image of the steel gasket when it was in the focus of the optical system. The maximum of the intensity of the IR laser is achieved when the position of the π-shaper is PSR = −1 mm, indicating that the focus of the objective OB1 (Fig. 1) coincides with that of the IR laser beam when PSR = −1 mm. As PSR is changing from −8 to 6 mm, the total intensity varies as shown in Fig. 7a. The shape of this curve indicates the rotation of the rim of the π-shaper that leads to the shifting of the focus of the π-shaper.
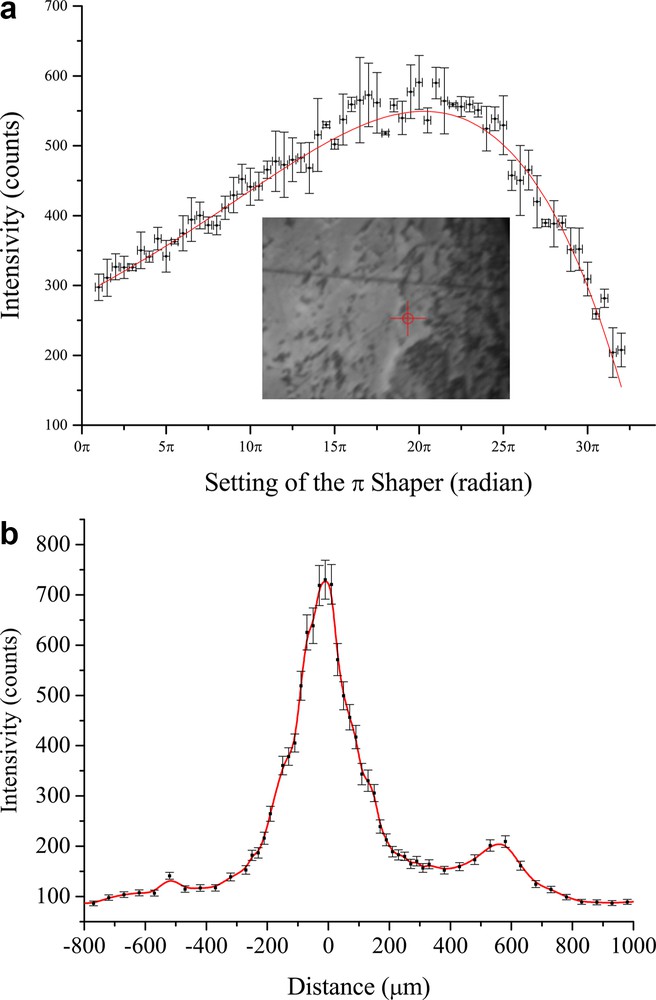
a: total intensity of the infrared (IR) laser beam on the steel gasket in a diamond anvil cell (DAC) at 1 GPa (the pressure was measured before and after laser heating) as a function of the position of the π-rim. Intensity was averaged over the area of an image (232 × 220 pixels) and laser power at 2 W. The inset shows the iron plate in the DAC. The cross is located at the center of the lasered area; b: intensity of the IR laser beam in DAC at different positions of the micro objective; the image area corresponds to 232 × 220 pixels and a laser power of 2 W. The rim of the π-shaper was set at –1 mm. Position Z = 0 coincides with the focal plane of the optical system. Masquer
a: total intensity of the infrared (IR) laser beam on the steel gasket in a diamond anvil cell (DAC) at 1 GPa (the pressure was measured before and after laser heating) as a function of the position of the π-rim. Intensity ... Lire la suite
Measurements of the total intensity of the laser beam as a function of the defocus z are shown in Fig. 7b when PSR = −1 mm. The intensity takes a maximum at Z = −8 μm. The positions of the two small peaks may indicate that they result from reflection from diamond culets. The intensity decays by four times at a defocus Z of 200 μm.
Fig. 8 shows the behavior of the intensity of the IR laser beam as a function of the defocus Z for PSR = −1 mm. Rotation leads to a drastic reduction in the IR reflected intensity. It is nearly five times lower at Z = −100 μm (Fig. 8a) compared to that at focus (Fig. 8c). The shape of the spot at Z = −100 μm is close to a “flat top” (Fig. 8a) with a diameter of nearly 60 μm. Such a shape of the laser beam is suitable for homogenous heating of the specimen surface; however, temperature measurements at this position do not provide a correct number. Defocusing to Z = −60 μm (Fig. 8b) gives the laser beam a donut-like shape. Defocusing to the opposite direction (Z = −100 μm, Fig. 8d) leads to the spreading of the laser intensity; however; it keeps its focusing shape.

Quasi-2-D distribution of the power of the infrared (IR) laser on the steel gasket in a diamond anvil cell (DAC) at 1 GPa (the pressure was measured before and after laser heating) as a function of the focus position when the setting of the π-shaper was PSR = −1 mm: a: Z = −100 μm; b: Z = −60 μm; c: Z = 0 μm; d: Z = 100 μm.
Fig. 9 demonstrates the behavior of the intensity of the IR laser beam averaged over the image area of 232 × 220 pixels as a function of defocus Z: for PSR = −4 mm and PSR = 3 mm. For PSR = 0 mm, the position of the maximum intensity (focus) is achieved when the defocus is around −150 μm (Fig. 9a). The sign minus indicates that the position of the focus should be located inside the diamond anvil; position 1 in Fig. 2. The position of the focus moves to nearly 300 μm for PSR = 3 mm. Therefore, the rotation of the rim of the π-shaper to negative PRS moves the focus of the IR laser beam inside the back anvil; position 1 in Fig. 2. The rotation of the rim of the π-shaper to positive PRS moves the focus of the IR laser beam inside the front anvil; position 3 in Fig. 2.
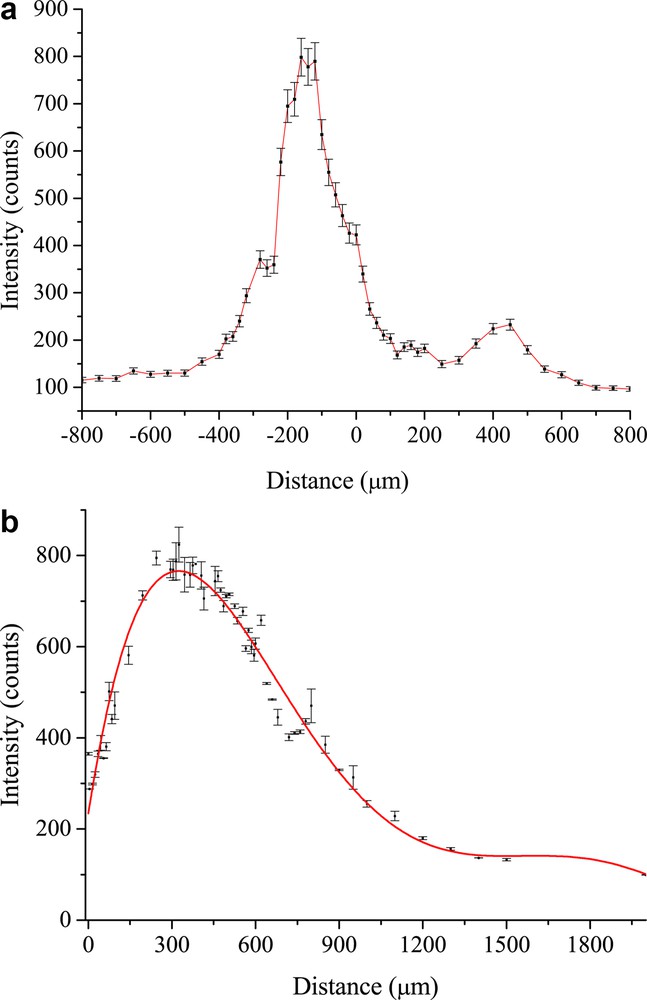
a: 2-D distribution of the infrared (IR) laser beam intensity on the steel gasket in a diamond anvil cell (DAC) at 1 GPa (the pressure was measured before and after laser heating). Intensity of the IR laser beam on the steel gasket in a DAC at 1 − GPa as a function of defocus when the setting of the π-shaper is: a: PSR = −4 mm; b: PSR = 3 mm. The zero position coincides with the focal plane of the optical system. The laser power was 2 W.
Now we can formulate the proper way of using the π-shaper. The object in the DAC should be placed in the focus of the optical system. In this case, the distribution of the laser power on the surface of the specimen should have the shape of the jinc function (Fig. 5b). To get a more homogeneous distribution of the laser power on the surface of the specimen, the rim should be set to PSR < −1 mm. The heated area is expanded to nearly 20 μm for the 10× objective. It is dangerous to set the rim to PSR > −1 mm, as it moves the focus of the IR laser inside the diamond; position 3 in Fig. 2.
The use of the π-shaper and of the TAOTF provides also a simple way to align the laser beam onto the surface of the heated specimen. First, the position of the beam shaper is set at −1 mm and subsequently by moving the specimen along the z-axis, it is possible to find the focus of the IR laser beam. Fig. 3 shows the 2-D intensity distribution of the IR laser beam on the surface of the specimen at different defocus positions. At focus (Z = 0), the diameter of the laser beam is the smallest. Finding the focus of the IR laser beam is an important task: focusing the laser beam inside the diamond anvil can damage the anvil. It is obvious that only the π-shaper provides an opportunity to flatten the temperature distribution (Figs. 5 and 8).
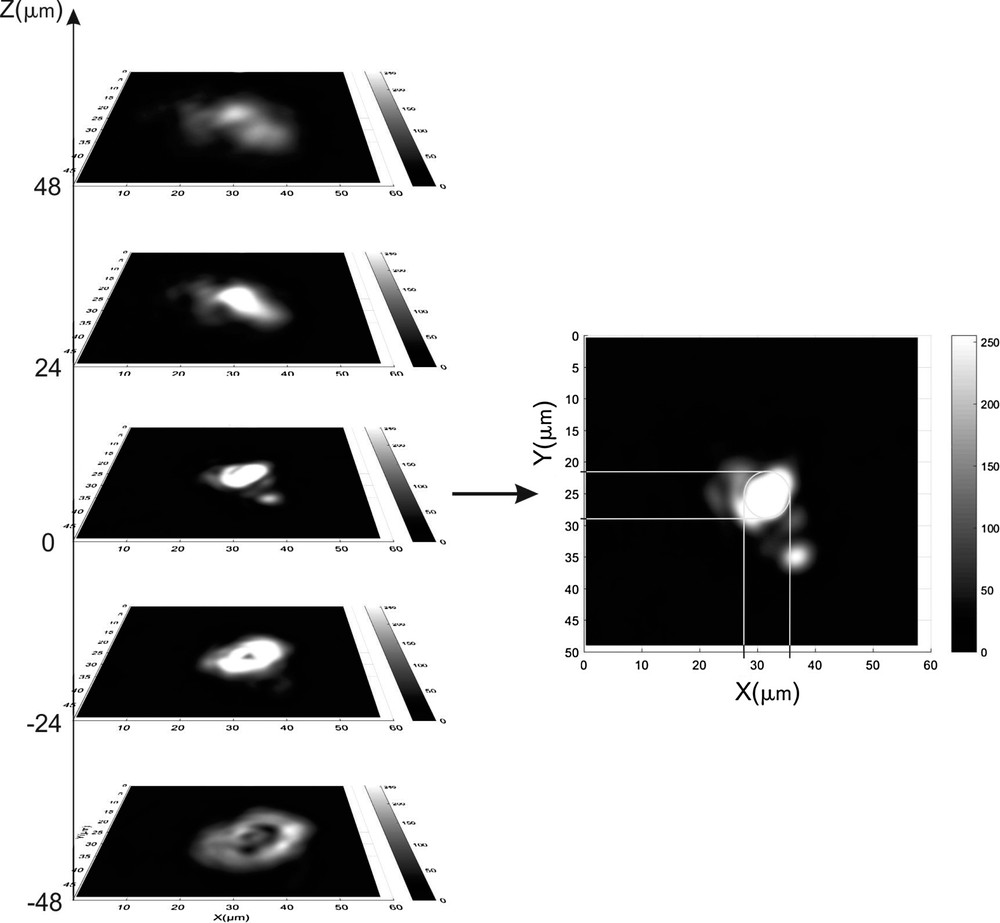
Fig. 10 shows the simultaneous measurements of the 2-D intensity distribution and the temperature distribution on the surface of the Pt plate in the laser-heated DAC. It was surprising that the size of the area with temperatures higher than 1700 K is very close to the size of the laser spot. Further, theoretical and experimental work is required to predict the temperature distribution for the knowledge of the laser intensity distribution on the surface of the heated specimen in a DAC. The apparent size of the focal spot is 5 μm. The real size is 7% smaller for a 2.5-mm diamond (Zinin et al., 2016). The apparent depth of the focus (24 μm × n = 24 × 2.4 = 58 μm, where n is the index of refraction) is close to that when focusing is done outside the DAC (Fig. 3).
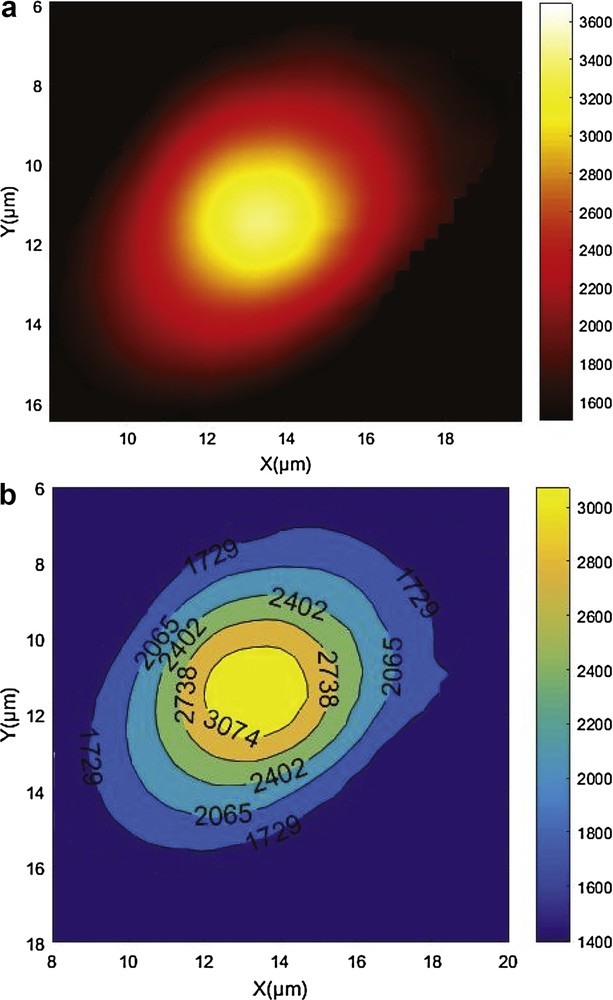
2-D distribution of (a) the infrared (IR) laser beam intensity on the surface of the Pt plate heated in the diamond anvil cell (DAC) at 40 GPa (the pressure was measured before and after laser heating) with a laser power of 18 W, and (b) the 2-D temperature distribution measured using tandem acoustic-optical tunable filter (TAOTF) in the wavelength range of 640–750 nm, and an exposure time of 6 s. Filled contour plot displaying isolines of the color map with filled areas between the isolines. The PSR was −1 mm. Masquer
2-D distribution of (a) the infrared (IR) laser beam intensity on the surface of the Pt plate heated in the diamond anvil cell (DAC) at 40 GPa (the pressure was measured before and after laser heating) with a laser power of ... Lire la suite
It is difficult to align two high-power lasers in a double-side laser heating system if the X-ray device is not connected to the system. The use of TAOTFs should be profitable in the case of double-side laser heating, because it should help to align the heating lasers. Suppose that the laser is heating one side of a specimen in a DAC. If the specimen is thin enough and the power of the heating laser is high enough to see the heated area on the opposite side of a specimen, then the point where the highest intensity is measured on the image taken by TAOTF at 750 nm can be marked on the screen of the monitor by a cross. Then the second laser should be switched on and the point of the highest intensity measured on the opposite side of the specimen with a 1038-nm filter should be aligned with the cross marking the point where both lasers are aligned.
4 Conclusions
We demonstrated that the use of a LH-DAC combined with a TAOTF allows for simultaneous measurements of (a) the 2-D distributions of the intensity of the IR laser beam, and (b) of the temperature distribution on the LH specimen in a DAC. It was shown that the π-shaper moves the focal plane of the IR laser away from the focal plane of the optical system of LH-DAC. Furthermore, it provides a means to control the shape of the IR laser spot on the surface of the heated specimen. The effect of the π-shaper on the shape and the position of the focus of the IR laser beam on a specimen using the TAOTF was also presented. For 10× long-working distance objective the smallest diameter of the IR laser beam on a specimen was found to be around 10 μm, in the case when the focal plane of the IR laser coincides with that of the imaging optical system of the LH–DAC. Finally, we showed that the highest diameter of the IR laser was 20 μm when the setting on the rim was −3 μm. To the best of our knowledge, there is no mention of laser heating in the DAC using such technique in the literature. More importantly, beside the option to measure the 2-D distribution of the IR laser power, this method is particularly helpful for aligning the IR laser for heating in a DAC.