

1 Introduction
The Advanced Photon Source (APS) is a third-generation synchrotron source with a 7-GeV storage ring and electron beam currents in excess of 100 mA (Moncton, 1996). It delivers X-rays with brightness on undulator beamlines up to four orders of magnitude greater than that of second-generation sources, and up to two orders of magnitude greater on bending magnet beamlines. The narrow, intense, short-wavelength beam is especially well suited for high-pressure experiments.
GeoSoilEnviroCARS (GSECARS) is a national user facility focused on advancing knowledge of the composition, structure, and properties of earth and planetary materials as well as the processes they control. Experimental techniques available include X-ray single-crystal and powder diffraction (at ambient and high pressure), interface scattering, X-ray absorption spectroscopy, X-ray fluorescence microprobe analysis, and microtomography. The GSECARS sector layout and beamline configuration were described by Rivers et al. (1998).
The bending magnet beamline at GSECARS started its operation in 1997. The source is characterized by a critical energy of 20 keV providing a smooth spectrum, ideal for energy-dispersive diffraction, which is a method well suited to pressure measurement and phase identification (Wang et al., 1998).
For monochromatic experiments, a water-cooled Si (111) double-crystal monochromator installed in the first optic enclosure (13-BM-A) is capable of delivering radiation with photon energy ranging from 4.5 up to 70 keV with a resolution of ΔE/E = 1·10−4. A 1-m-long vertical mirror in the second optics enclosure (13-BM-B) can be used to focus the beam down to 0.01 mm vertically at the sample position in the end station (13-BM-D). Without focusing, the bending magnet beam size can be as large as 50 mm (horizontal) × 3–6 mm (vertical, energy dependent), which is a great advantage for imaging large samples in multi-anvil press experiments.
2 The LVP system with integrated high-pressure modules
Large-volume press (LVP) experiments on the bending magnet beamline are performed in experimental station 13-BM-D. The incident synchrotron beam is collimated by a set of four-jaw slits in the vacuum tank. The station contains an upstream general purpose optical table for a variety of experiments (high-pressure diamond anvil cell (DAC) diffraction and Brillouin spectroscopy, and microtomography) and a 2.5 MN (250 t) LVP at the downstream end.
2.1 Press and detector manipulation system
The integrated control system for the LVP (Fig. 1), jointly designed by GSECARS and Advanced Design Consulting USA, Inc. (ADC) (Deyhim et al., 2012), consists of a press positioning subsystem and a detector-positioning subsystem, both of which sit on one set of 2.5-m-long guide rails mounted to a large steel base plate, which is grouted to the hutch floor for enhanced stability. With the two subsystems, the press and the detector can be moved manually and independently along the precision guide rails to adjust the sample–detector distance. Both subsystems can then be locked down to their desired positions.
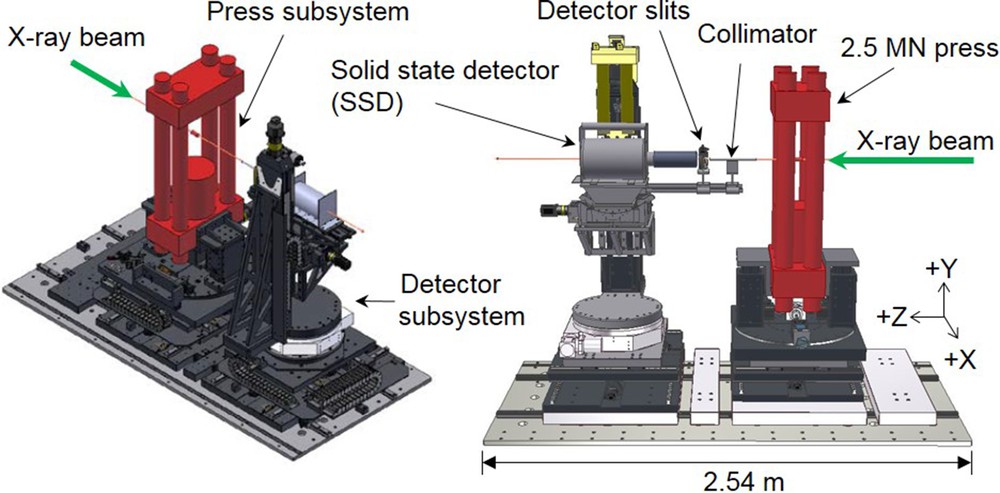
Overall view of the nine-axis custom design high-precision motion system that is located inside the bending magnet beamline hutch 13-BM-D.
The press positioning subsystem controls the motion of the 2.5-MN hydraulic press, which weighs approximately 1 ton, with motorized and encoded motions in three linear translations (Table 1): parallel to the incident beam (Z) and perpendicular to the beam, horizontally (X), and vertically (Y). The precision and repeatability of the three linear translations are critical in aligning the sample to the X-ray beam. A high-load-capacity rotation stage is directly under the press, driven by a motorized worm gear (non-encoded). This allows for remote and precise alignment of the anvil gap in high-pressure modules through X-ray imaging.
Summary of motion specifications for the press and detector manipulation sub-assemblies.
| Motion | ADC product description | Range of motion | Resolution (micron/step) |
| Press sub-system | |||
| Vertical translation | DJ400-100 Crossed roller jacks | ± 50 mm | 0.1818 |
| Transverse to Beam | Custom linear slide | ± 50 mm | 0.4545 |
| Beam direction | Custom linear slide | ± 50 mm | 0.4545 |
| Yaw about vertical axis | Custom manual rotation stage | 360° | n/a |
| Detector sub-system | |||
| Vertical translation | DS500-200 with Constant Force Spring | ± 200 mm | 0.4545 |
| Transverse to Beam | Custom linear slide | ± 200 mm | 0.4545 |
| Beam direction | Custom linear slide | ± 50 mm | 0.4545 |
| Rotation in vertical plane | TSW300-20 tilt stage | ± 18° | 0.003°/step |
The detector-positioning subsystem has five motorized and encoded motions including three linear translations in the X, Y, and Z directions and two rotation axes (pitch and yaw). The linear position accuracy is 0.001 mm, and rotations of the detector support are within 0.002° (Table 1). The load capacity of the detector subsystem is 50 kg, which is sufficient to carry all of the available detectors.
An additional accessory mounting frame, 150 mm in depth along the beam direction, is built between the press and the detector manipulation subsystems for installation of extra equipment required by the specific experimental setup. This frame, whose position is also adjustable, is not shown in Fig. 1. Commonly used accessory equipment includes the CCD camera and scintillator assembly for 2D sample imaging. This frame provides a stable support for the imaging system and allows the sample–scintillator distance to be freely adjustable, making it possible to apply phase contrast imaging techniques to our high-pressure tomography setup. Also mounted on this frame is an ion chamber that can be moved in and out of the beam path. Combined with another ion chamber mounted upstream of the press, one can perform monochromatic X-ray absorption measurements. This technique is commonly applied to density measurement of liquids in a large-volume press using synchrotron X-ray (Chen et al., 2014; Katayama et al., 1993; Sakamaki, 2017; Sanloup et al., 2000).
2.2 Generation and control of pressure, shear stress and strain
2.2.1 The 2.5-MN hydraulic press
The hydraulic press has a conventional platen-and-tie-bar design, with four tie-bars, 101.6 mm in diameter, made of 4340 high speed tool steel. The two platens are made of the same material, with dimensions of 558.8 × 279.4 × 152.4 mm. The distance between the two platens is 787.4 mm. Eight tie nuts, 50.8 mm in diameter and 88.9 mm in height, are used to connect the platens to the tie bars. An Enerpac hydraulic ram (closed height 285.75 mm) with a bore diameter of 139.7 mm and OD of 254 mm is used to generate loads up to 2.5 MN with 76.2-mm stroke. The overall dimensions of the press are approximately 560 × 280 × 965 mm (width × thickness × height). The hydraulic pressure in the ram is driven by a pressure control system that consists of an electrical hand pump for rapid ram positioning and a positive displacement pump (PDP). The central component of the PDP is a long-stroke (406 mm), 0.25-MN hydraulic ram, with a bore diameter of 57.15 mm. The ram is driven by a 0.2 MN Simplex UniLift™ coupled with a gear reducer. The PDP is controlled by a DC servo-motor, allowing smooth variations in speed up to 2000 rpm (corresponding to speeds for the 2.5 MN ram from zero to 1 mm/s). The typical ram speed during compression is ∼5 μm/min with the pressure controller set at 200 rpm. Both the press and the pressure control system are provided by Rockland Research Corp.
2.2.2 The high-pressure modules
Several types of pressure-generating mechanisms are used interchangeably for various experimental needs. For every pressure module, guide blocks are mounted inside a set of die set so that the entire module can be transferred in and out of the experimental station. The die set has a set of rollers and can be rolled on a pair of rails, which can be connected to the rails in the press frame. Thus, each die set can be rolled in and out of the press on a run-to-run basis. This design decouples the module from the hydraulic presses, allowing various tooling to be used in any press at any time. This versatile design allows researchers to tackle experimental problems with the most suitable pressure module (Wang et al., 2009).
The available modules include a well-known cubic-anvil apparatus, known as the DIA module (Osugi et al., 1964); two double-stage split-cylinder apparatus: two slightly different T-Cup apparatus (Vaughan et al., 1998) (T-Cup and T-10) that compress eight 10-mm edge-length Kawai-type second-stage cubes; a deformation-DIA (D-DIA) module that can perform controlled deformation under hydrostatic load (Wang et al., 2003); and a rotational deformation apparatus (RDA) for high-pressure X-ray microtomography (HPXMT) (Wang et al., 2005; Yu et al., 2016). Detailed descriptions of the modules, experimental setup, cell assemblies, and their pressure and temperature capabilities can be found in the cited literature. Pressure, temperature, stress, and strain capabilities of the devices are given in Table 2.
PT range of each module.
| Module | Pressure (GPa) | Temperature (°C) | Stress Control | Strain Control |
| DIA | 15 | 2000 | No | Possible, simple shear |
| T-10 | 25 | 1800 | No | Possible, simple shear |
| D-DIA | 15 | 1600 | Yes, triaxial | Yes, triaxial |
| RDA | 15 | 1800 | No | Yes, torsional |
2.3 Temperature control
High temperature is achieved by resistive heating. A maximum temperature of 2200 °C can be reached in certain cell assemblies. A regulated AC power supply (1000 W) is used, with several settings to allow various heating materials to be used. A DC signal (0 to 10 V) is used to remotely control the power output from the supply. Closed-loop proportional-integral-derivative (PID) software allows heating to be controlled by either temperature through thermocouple electro-motive force (emf) or power. Voltage, current (both AC), and thermocouple emf (DC) signals are monitored continuously by two Keithley digital multimeters with internal scanner cards, in addition to other vital hardware parameters, such as ram displacement and oil pressure. An optional 8 V/250 A DC power supply is available for heating experiments that require higher power.
Any thermocouple can be used for temperature measurements and users can build emf-temperature conversion calculations in the Keithley Multichannel Scanners. The most commonly used thermocouples for the LVP experiments are type-C (W-5%Re/W-26%Re) and type-D (W-3%Re/W-25%Re), as they are suitable for high-temperature measurements up to 2300 °C.
2.4 Detector options for diffraction
We use a single-element germanium detector for energy-dispersive X-ray diffraction (EDXD). Because the tungsten carbide (WC) anvils are X-ray opaque, there is only a small gap between the downstream WC anvils where the sample-diffracted X-ray beam may exit the cell assembly and be seen by the detector. In this case, EDXD is a convenient choice for LVP experiments at the synchrotron beamline. The wide photon energy spectrum of the bending magnet source is ideal for this application. Diffraction angles between 5° and 7° are routinely used.
For angle dispersive X-ray diffraction (ADXD), two-dimensional (2D) detectors are more convenient. In this case, X-ray transparent anvils are required on the diffraction (downstream) side of the high-pressure module. Low-absorption and amorphous materials are used in the cell assembly and gaskets as windows. We typically use a Rayonix charge-coupled device (CCD) area detector (MAR165). ADXD with 2D detectors allows one to collect diffraction signals over a much wider solid angle and dramatically improve counting statistics of the diffraction data, with reliable intensity information for crystallographic studies on materials at high P and T. In addition, the complete coverage of diffraction Debye rings provides a much more reliable measure on lattice distortions under a given differential stress field. This enables one to determine non-hydrostatic stress accurately. Furthermore, azimuthal intensity variations in the 2D diffraction data allow quantitative analysis of texture development in polycrystalline samples during deformation. This adds valuable constraints to the determination of deformation mechanisms.
2.5 Imaging
Another type of information one can get from an LVP experiment is absorption contrast. Fig. 2 shows the imaging setup in 13-BM-D. The incident beam passes through gaps between the anvils and the sample inside the pressure medium and impinges on a thin (∼0.1 mm) Ce:LuAG scintillator crystal, which converts the X-rays to visible light. Absorption contrast inside the cell is converted into light intensity variations by the scintillator. A mirror reflects the visible light image into a series of focusing lenses and a radiograph is thus recorded by a CCD or CMOS camera. This setup provides an excellent opportunity to “see” through the sample during the experiment. For complicated cell assemblies that have multiple layers of material surrounding the sample, or for cell assemblies that are oriented at an inclined angle, it is sometimes difficult to locate the sample center in the vertical direction solely by the X-ray diffraction signal. With the imaging setup, it is straightforward to locate the beam inside the sample in the vertical plane, and one needs to center in the Z direction (along the X-ray beam) to optimize the diffraction signal. In this way, several hours can be saved for each experiment.
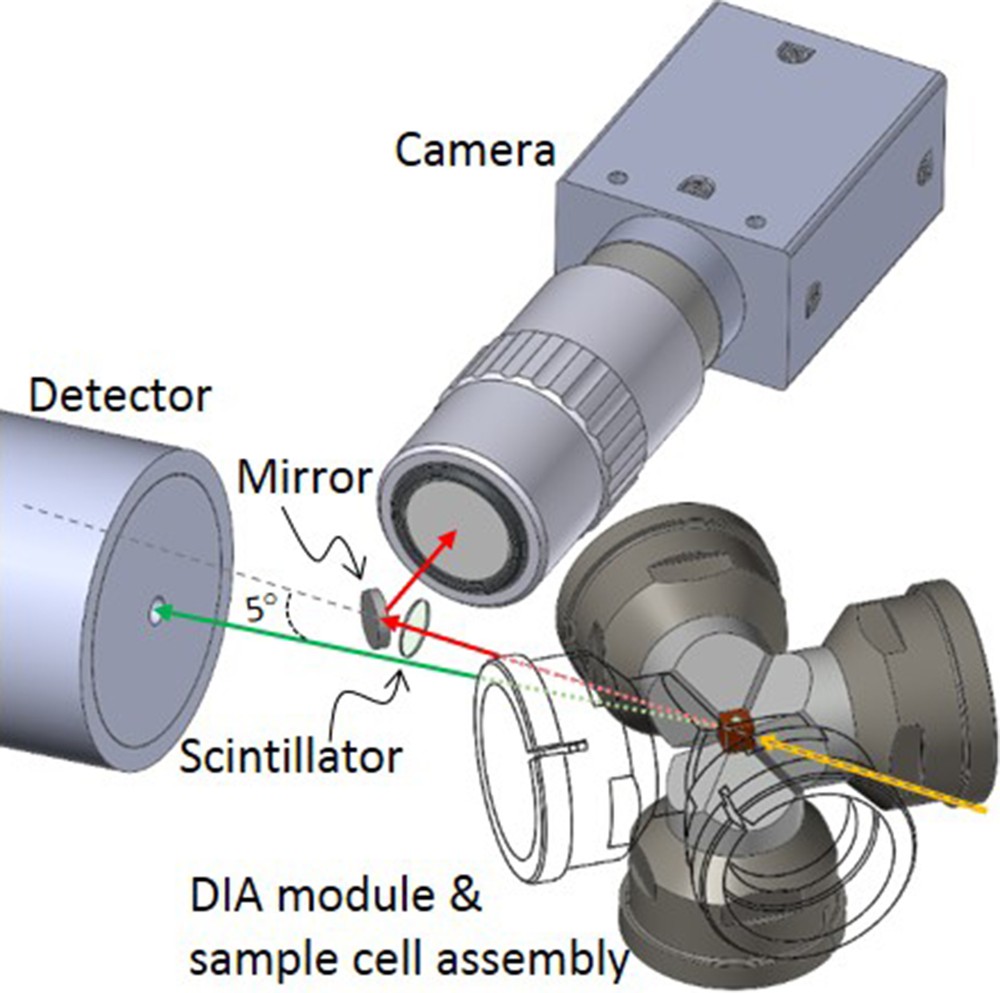
Setup for imaging in the LVP system. The incident beam (yellow line) passes through the anvil gaps and the cell assembly and impinges on the Ce:LuAG scintillator crystal, which converts X-rays to visible light (red line). The visible light signal is reflected by the mirror into the focusing lenses before being recorded by the CCD. The whole optical path (dotted gray line) is just above the solid-state detector, so the optical and X-ray paths do not interfere with each other. The green line shows the diffraction signal entering the detector (5–7° below the incident X-ray beam line).
Our imaging cameras have gone through several generations as advances in camera technology occur. The current setup is a Point Grey CMOS Model GS3-U3-23S6 M, which has a 1920 × 1200 pixel array with a dynamic range of 73 dB. It has a maximum speed of 162 frames per second, with a peak quantum efficiency of 76% at a wavelength of 525 nm. This device is suitable for handling regular 2D radiography, high-pressure 3D tomography, and most viscosity measurements of liquid-phase earth-related materials.
Our high-pressure tomography setup is based on the same imaging method. By collecting 2-D radiographs of the sample while rotating the sample inside the HPXMT apparatus from 0 to 180 degrees, the series of 2-D projection images can then be reconstructed to create a 3-D dataset of the sample. Here scintillator orientation and stability become critical for generating high-quality tomography images. Our scintillator is mounted on a kinematic holder and can be rotated so that horizontal pixel rows in the CCD camera are perpendicular to the rotation axis of the HPXMT apparatus. The scintillator mount has mechanical damping, so that when it makes a full stop after moving, mechanical vibration is at a minimum. One unique feature of our high-pressure tomography setup is that we have the ability to switch from monochromatic X-ray beam (tomography) to white beam (X-ray diffraction) in less than 30 s, making near-real-time in-situ high-pressure tomography and pressure determination possible. By utilizing the vertical focusing mirror and avoiding the monochromator, which typically transmits less than 0.1% of the X-ray beam, pink-beam (Rivers, 2016) has the advantage of providing 1000 times higher flux than the monochromatic X-ray beam, therefore decreasing the tomography data collection time drastically. In pink-beam tomography, the beam is either defocused (for radiographic imaging) or focused (for EDXD), with the beam center fixed. There is no switching between imaging and diffraction optics. This has drastically reduced tomography data collection time and simplified operation. For a detailed description on the high-pressure tomography setup at GSECARS, please refer to Wang et al., 2005 and Yu et al., 2016.
2.6 Other probing tools
2.6.1 Acoustic emission
In-situ acoustic emission (AE) monitoring under high-pressure and high temperature in a large-volume press is a very useful technique to study mechanical instabilities inside the sample during deformation. Not only can we perform X-ray diffraction and imaging of the sample during acoustic emission monitoring, with transducers mounted on all six anvils, we obtain high precision in determining the location of the events in 3-D space (Wang et al., 2017).
The acoustic emission signal collected by the transducers is first sent to the amplifier. The amplified signal then goes into the Trigger and Hit Count (THC) unit made by the Applied Seismology Consultants (ASC). The THC can be operated in a continuous mode where it is constantly recording (streaming) or it can be set to a triggered acquisition mode by assigning a response signal intensity threshold for each transducer. The output signal from the THC transmits to the ASC CECCHI oscilloscopes. Each oscilloscope can sample on four channels simultaneously, and multiple scopes can be synchronized to expand the total number of channels. The signal is then transmitted via a USB cable to the 12-bit ASC Richter Continuous Data Acquisition and Streaming System, which is a Windows-based personal computer (PC) with a PCI-9816 data acquisition card (Adlink Technologies). The acoustic emission control and data analysis software InSite-Lab is also installed on the Richter unit.
The piezoelectric lead zirconate titanate (PZT) ceramic transducers used in the AE experiments are provided by Omega-piezo. The “receiving-only” transducers are 1 mm in thickness and 10 mm in diameter, and they are glued to the back of each anvil with EPO-TEK® 353ND epoxy. These transducers have a center frequency around 1–2 MHz and a frequency band of less than 1 MHz. We have purchased two new types of broadband transducers from NDT with center frequencies at 3 MHz and 15 MHz, respectively, for better acoustic signal responses in specific confined frequency ranges. We have also installed a new 6-channel Thamway Hex Receiving amplifier that works for signals in the 0.1–30 MHz frequency range with gains of 40 or 60 dB. The new custom-made amplifier helps us capture acoustic emission signal with better signal quality (low noise). For detailed description of the experimental setup and its application, please refer to Ferrand et al. (2017), Gasc et al. (2017), Incel et al. (2017), Schubnel et al. (2013), Wang et al. (2017).
2.6.2 Ultrasonic
In-situ ultrasonic wave velocity measurement at extreme conditions has been available in the LVP at GSECARS for more than 15 years (Chantel et al., 2012; Gréaux et al., 2016; Jing et al., 2014; Kono et al., 2011; Kung et al., 2004, 2005; Li et al., 2005; Wang et al., 2015). Since this add-on probing tool is a portable system, we can easily move it between experimental stations. In the 13-BM-D LVP system, the ultrasonic measurement technique has been developed for both the DIA and the HPXMT apparatus. The advantage of using X-ray imaging to measure the sample length in situ has proven to be a very powerful method in providing precise velocity measurement of the sample, whether it is in solid or liquid phase.
Recently, we have upgraded the 15-year-old ultrasonic system. The new setup includes a single channel Thamway amplifier that covers a frequency range of 10–100 MHz with gains of either 40 or 60 dB. The new 2-channel arbitrary function generator (Tektronix AFG3252 C) can create 1 μHz to 240 MHz sine waves, or arbitrary waveforms at frequencies up to 120 MHz. We also have a 4-channel Tektronix MSO54 oscilloscope with 1 GHz bandwidth, 125·106 points record length, and a real-time 6.25 GS/s sampling rate that can provide high quality travel time measurement data. The new system will allow us to have better integrated programming ability to control the waveform generator and oscilloscope with third-party computer codes. This ultrasonic system coupled with the existing pressure control (e.g., differential ram) and temperature control system provides new opportunities for velocity experiments.
3 LVP Software
Due to the journal's page limitation, please visit the Supplementary Information for detailed description of the software used at the LVP facility at GSECARS.
4 Technical capabilities & scientific highlights
Many research projects have benefited from the unique capability of performing in-situ LVP experiments combined with the powerful synchrotron X-ray. In this section, we describe several scientific studies that were performed recently with the new LVP system at GSECARS.
4.1 Reaction kinetics
Ma et al. (2016) studied the phase changes of Class-A oil well cement slurries under load based on the ADXD patterns of the sample that were collected continuously (Fig. 3). Mineral phases that are of interest in this particular cement include alite, ferrite, portlandite, ettringite, monosulfate, and jaffeite, etc. The setup was able to acquire real-time, in-place X-ray diffraction patterns of the slurry sample and monitor the continuous formation and decomposition of the selected phases over time. Effects of elevated temperatures (up to 150 °C) at elevated pressure (up to 100 MPa), as well as the effect of mixed nanomaterial were studied. The study showed that the conversion rate from ettringite to monosulfate increased with elevated temperature, and after reaching 85 °C, monosulfate became unstable. Also, from this study a seeding effect introduced by nano-sized attapulgite clays at 0.5% addition by mass of cement was evidenced, where acceleration in the rate of portlandite and jaffeite formations was observed.
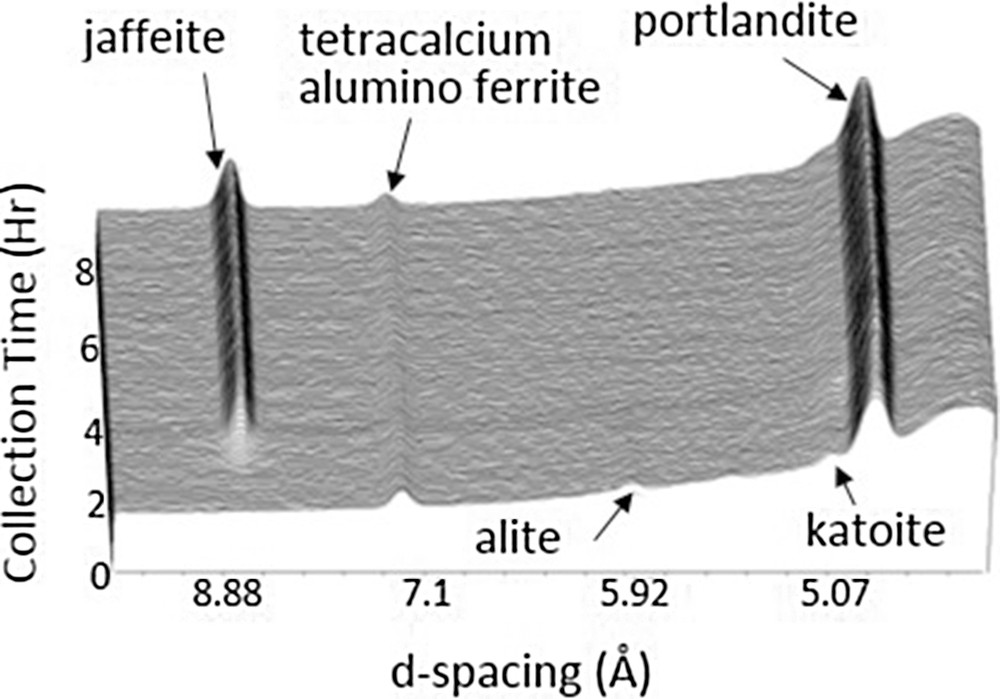
Stacked synchrotron X-ray diffraction patterns of the oil well cement sample collected over 8 h (modified from Ma et al., 2016).
4.2 Density of non-crystalline materials
Density is a fundamental physical property of a material, and it plays an important role in the characteristics of the Earth's interior. Since the density difference between materials directly determines the buoyancy force, hence the transportation and dynamics of materials in the deep Earth, to understand the density variation with depth/pressure and its horizontal distribution, have always been a goal for seismologists and mineral physicists in defining the Earth's structure.
The density of a crystalline material can be determined by its lattice parameters via X-ray diffraction measurement. Equation-of-state studies of crystalline materials have been a successful and routine high-pressure experiment at the GSECARS. On the other hand, non-crystalline materials, including glass and liquid phases lack atomic long-range ordering. Without characteristic X-ray diffraction peaks from the material, it is impossible to infer lattice parameters from diffraction patterns. Two methods have often been applied at the GSECARS beamline for in-situ density measurement of amorphous materials under extreme conditions.
The first one is the X-ray absorption method following the Beer–Lambert law:
| (1) |
The law describes the X-ray intensities before and after passing through a homogeneous and isotropic material. I is the intensity of the transmitted X-ray beam, I0 is the intensity of the incident beam. The intensity change is related to the mass absorption coefficient of the material μ (g/cm3), the density of the material ρ (g/cm3), and the total travel length of the X-ray beam inside the material l (cm). During the absorption experiment, I and I0 can be measured with ion chambers set up in front and in the back of the sample cell. The wavelength-dependent mass absorption coefficient of the material (μ) is a known parameter for a known composition at the specific wavelength. Since the sample capsule is made of a single crystal diamond capsule, the deformation of the sample capsule in the radial direction is minimal throughout the entire experiment, and the change in the sample diameter is therefore negligible. The sample diameter (X-ray travel length inside the sample) is therefore determined by simply measuring the inner diameter of the single-crystal diamond capsule via the 2D X-ray radiograph. One can then derive the density value based on Eq. (1). Sakamaki (2017) measured densities of Jadeite melts in-situ up to 6.5 GPa and 2000 °C in the DIA apparatus using a diamond sleeve and Re lids on both ends to contain the liquid. The result is a very important piece of information regarding the equation-of-state of silicate melts in the mantle (Fig. 4).
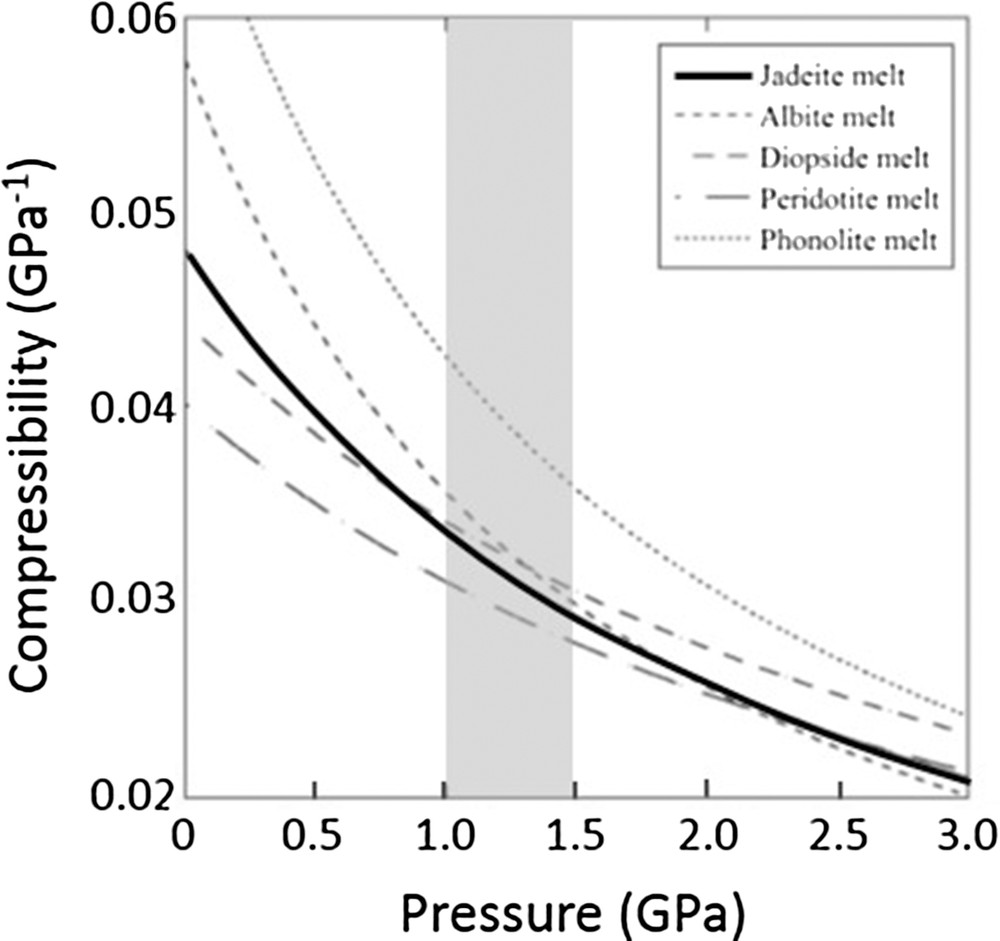
The isothermal compressibility of various silicate melts as a function of pressure (up to 3 GPa) at 1500 °C. The crossovers of the melt compressibility values happen in the 1–1.5 GPa pressure range (modified from Sakamaki, 2017).
Another popular method to determine the density of a non-crystalline material at our beamline is by measuring the volume of the glass/liquid sample using the 3D X-ray tomography setup. By carefully determining the threshold value for the reconstructed tomography images, one can calculate the volume of the sample by integrating the area of the sample from each single slice. Since the mass of the sample is weighed before loading it into the cell assembly and assumed to remain unchanged during the experiment, the density values at each high-pressure and high-temperature point can then be calculated by dividing the mass by the volume. This is a simple and straightforward method to determine the density of a material. In case of a sample with unknown mass, one can normalize the volume with respect to ambient volume rendering. The relative volume change is sufficient for equation-of-state determination with a constant (albeit unknown) mass. One advantage of this method is that one will not have to worry about the sample shape and its change under extreme conditions, as long as the entire sample region is captured by the tomography system, the in-situ volume can be determined. An example of applying the 3D tomography method to density measurement is the series of gallium liquid studies by Li et al. The equation-of-state of gallium liquid was determined by measuring the volume change as a function of pressure and temperature up to 3.63 GPa and 60 °C (Li et al., 2014, 2017a, 2017b).
4.3 Sound velocity measurement
The application of ultrasonic interferometric techniques in a large-volume press at the synchrotron beamline has been available since 1998 (Liebermann & Li, 1998). By taking advantage of the synchrotron X-ray absorption imaging setup, one can visually “see” the sample and measure the sample length in situ under high pressure and high temperature. Combined with the travel time information collected, the velocity of the sample can then be calculated. Sound velocity measurements can be performed in both the Paris–Edinburgh (PE) cell assembly and the DIA module with a 7 × 7 × 7 mm3 cell assembly. The large sample size ensures accurate sample length determination based on imaging. Kono et al. (2011) conducted ultrasonic elastic wave measurements while collecting tomography images in the HPXMT apparatus using a 3-mm PE cell assembly. They integrated the velocities to extract density information. They demonstrate that densities based on velocities and 3D tomography imaging are consistent.
4.4 Deformation in ductile regime
The deformation-DIA (D-DIA) was developed based on the widely used cubic-anvil apparatus–the DIA module (Wang et al., 2003). Two differential rams installed on the top and bottom anvils can be advanced, while the sample is under hydrostatic load, therefore generating a deviatoric stress field inside the sample. Quantitative deformation is achieved by measuring both the stress and the strain in the sample simultaneously. Sample strain is determined by measuring the sample length change during deformation. In order to locate the top and bottom boundaries of the sample, sample length markers are often used. Commonly used are heavy metal foils placed on the top and bottom of the sample, e.g., Au, Pt, etc. With the absorption contrast between the sample and the foils, the length of the sample can be easily determined in the X-ray absorption image. Stress measurement relies on the X-ray diffraction signal of the sample. In a non-hydrostatic stress field, lattice planes at different orientations to the principal stress directions change their d spacing to a different degree. This is reflected on the X-ray diffraction pattern as a distorted Debye ring. The azimuthal dependence of a particular d spacing and therefore the total stress magnitude is measured by the shape and the size of the Debye ring using the known elastic moduli of the crystal (Fig. 5).
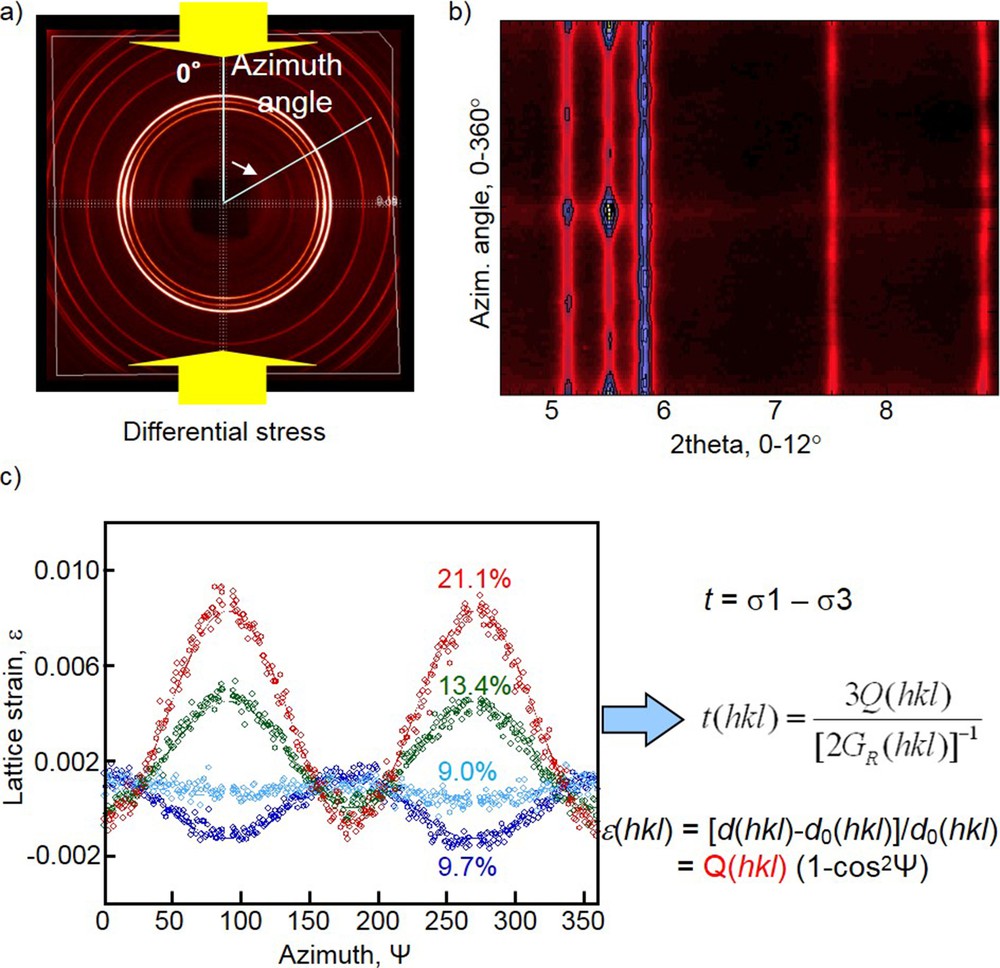
Stress measurement in a high-pressure deformation experiment based on the distorted Debye ring. a) Original X-ray diffraction pattern with uniaxial stress applied in the vertical direction. Instead of a straight line in a hydrostatic stress case, the wavy lines in the “caked” pattern expanding from 0° to 360° in azimuth indicate that the Debye rings are distorted, as shown in b). c) Relationship between the lattice strain Q(hkl), the isotropic/hydrostatic stress d-spacing d0(hkl), and the measured d-spacing d(hkl). Q(hkl) and d0(hkl) are extracted by fitting d(hkl) versus Ψ in the equation.
Using the D-DIA apparatus at GSECARS, deformation of San Carlos olivine up to 7.8 GPa and 1400 °C has been reported (Hilairet et al., 2012). Three deformation regimes were observed based on the evolution of lattice strains with total bulk strain and texture development. They concluded that, for polycrystalline olivine, the evolution in slip systems may be progressive. Because of the gradual change, the activation volumes measured on polycrystalline olivine cannot be linked to a particular slip system. This slip system evolution will also affect the interpretation of seismic anisotropy data of the upper mantle flow.
Polycrystalline diamonds have been deformed in the D-DIA apparatus. This was made possible by the availability of nano-polycrystalline diamond, which possesses higher strength than polycrystalline diamonds with micron-size grains (Irifune et al., 2003). By generating up to 12% strain in the diamond samples, Gasc et al. (2015) studied the strength of polycrystalline diamond at high pressure and temperature, and its mechanical properties were investigated in situ using synchrotron radiation. The relation of mechanical strength and the sintering state as well as its defect concentration of the polycrystalline diamond were discussed. The study suggests that the use of diamond grains with reduced defect concentration and cleaner surfaces as precursors will improve the wear resistance of the resulting polycrystalline diamond via stronger individual grains and better sintering.
4.5 Acoustic emission monitoring–Deformation in brittle regime
The unique combination of D-DIA with acoustic emission (AE) allows systematic studies of phase-transition-triggered/induced failure mechanisms relevant to intermediate-depth and deep-focus earthquakes. These include the transition from blueschist to eclogite-facies for seismicity in the upper Wadati-Benioff zone (Incel et al., 2017), serpentinite dehydration in serpentinized olivine for seismicity in the lower Wadati-Benioff zone (Ferrand et al., 2017; Gasc et al., 2011, 2017), eclogitization of granulite for deep crustal earthquakes under Tibet (Shi et al., submitted), and transformational faulting in olivine for deep-focus earthquakes (Schubnel et al., 2013).
We have also applied seismological methodology for AE event location and waveform analyses to improve location resolution by a factor of > 10 (Wang et al., 2017). Combined with X-ray tomography imaging on recovered samples, we are able to correlate the AE distribution with observed faulting for the first time both in space and time.
4.6 3D X-ray tomography
Since the initiation of 3-D absorption-based tomography imaging under pressure and temperature at 13-BM-D in 2005 (Wang et al., 2005), several high-pressure beamlines around the world have developed similar capabilities, e.g., the Super Photon Ring-8 GeV (Urakawa et al., 2010). Philippe et al. (2016) first reported high-pressure X-ray tomography work performed at several synchrotron light sources in Europe including the European Synchrotron Radiation Facility, the Synchrotron SOLEIL and the Diamond Light Source. Yu et al. (2016) summarized the development since 2005 at GSECARS. A few examples of projects utilizing the HPXMT apparatus are described below. Recently, we have developed the capability for pink beam tomography with our HPXMT apparatus at 13-BM-D. The newly adapted technique not only decreases the tomography data collection time in general due to the higher flux comparing with the monochromatic X-ray beam but also made X-ray diffraction data collection much easier since both detectors (the CCD camera and the single element point detector) are now aligned to the pink beam position and there is no additional position adjustments (monochromator, slits, etc.) required to switch from imaging (tomography)-mode to diffraction mode.
4.6.1 Proppant bulk properties under uniaxial load
In the oil/gas industry, injecting proppants into the reservoir after rock fracturing processes is a common procedure to increase the production rate in low permeability rock formations such as tight sands or shales. Although proven to be an effective method to increase production, how the proppant-filled fracture system responds to the change in loading stress remains unclear. Sanematsu et al. (2015) utilized the HPXMT apparatus, which is able to collect 3-D tomography images while applying uniaxial stress perpendicular to the layers, to study the proppants’ reaction under various stress levels that are typical of oil-producing reservoirs. Quantitative grain analysis based on the 3-D images of the loaded proppants between different layers of wall rocks reveals the rearrangement of the packing structure, a corresponding reduction in porosity, and some embedding at the rock walls.
4.6.2 Deciphering the texture in graphic granite
Xu et al. (2015) studied the distinctive graphic texture of alkali feldspar and quartz that have intergrown within the granite collected from Fangshan Pluton in China (Fig. 6). This texture created by the two mineral phases resembles ancient cuneiform writing when viewed in certain cross sections. With the help of the 3-D X-ray tomography technique, they were able to visualize the 3-D contact relation between quartz and feldspar in the granite sample. One interesting feature observed was that all rod-shaped quartz grains are separated from each other by the feldspar phase. Combined with petrography and crystallography analysis work, the authors further provide evidence demonstrating the mechanism of simultaneous crystallization for graphic granite.
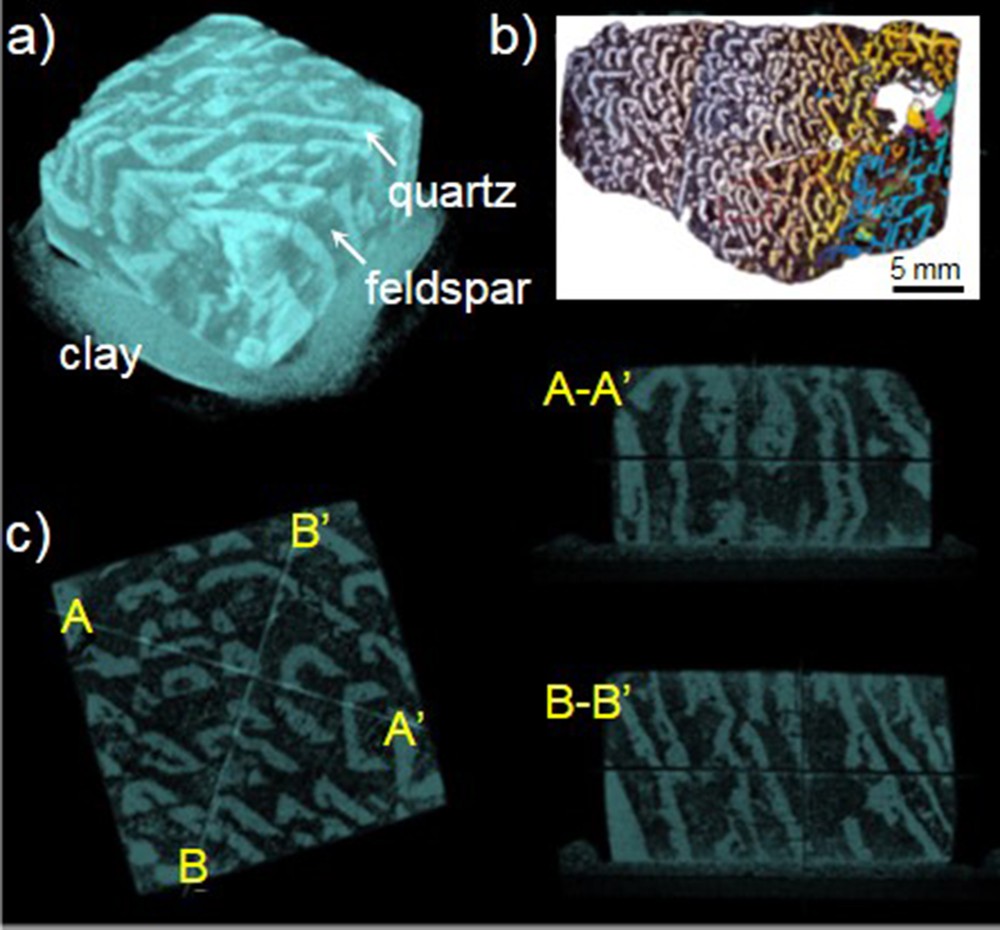
a) Reconstructed 3-D tomography image of the examined graphic granite sample (5.7 mm × 5.8 mm × 5.4 mm). Quartz grains are shown in light color, while the dark color represents the feldspars. b) Quartz grains with different crystallographic orientations inside the single crystal feldspar observed under cross-polarized light. c) View perpendicular to the mid-plane cross-section. Cross sections A–A’ and B–B’ show that most of the quartz grains run continuously, sub-parallel to the vertical axis (modified from Xu et al., 2015).
4.6.3 Shear deformation in metal-silicate composites
Being able to apply additional shear stress to the sample that is already under uniaxial load is a unique feature of the HPXMT apparatus. Todd et al. (2016) studied shear-induced iron silicate segregation to help understand the mechanism of the Earth's core formation. Samples consisting of San Carlos olivine and 4.5 vol % FeS were heated to 1100 °C at 1.5 GPa, where FeS turns into a liquid and olivine remains solid. A shear stress is then applied to the sample in the horizontal plane by rotating the top and bottom Drickamer anvils in opposite directions. Melt pockets change their shapes, sizes, and connectivity at various shearing levels. Permeability simulations were performed on the 3-D tomography images to determine the effect of shear deformation on connectivity and permeability within the sample.
5 Future developments
Brittle deformation in the D-DIA coupled with acoustic emission monitoring has allowed us to conduct systematic laboratory simulations on possible mechanisms triggering deep earthquakes between 50 km and 700 km. We have studied systems involving dehydration (antigorite, partially serpentinized olivine, and glaucophane-blueschist facies rocks), metamorphic reactions (granulite to eclogite transition), and the olivine-spinel phase transformation. A significant accomplishment in this area is the successful incorporation of a state-of-the-art seismological analytical methodology to AE signals in the MHz frequency range. This development allows much more information to be extracted from the AE data. To fully capitalize on this advancement, we have recently purchased broadband amplifiers and AE transducers and will be calibrating these new transducers in 2018 and record AE data using the broadband amplifiers. We will conduct broadband AE experiments for quantitative nano-seismological analyses, which will further enrich the information experimentally obtainable for a better understanding of mechanisms of deep earthquakes.
We have significantly improved experimental techniques for ultrasonic wave velocity measurements on silicate melts at high pressures. Our 20-year-old ultrasonic system has just recently been replaced by a more advanced ultrasonic system from Tektronix that has a broader-band waveform generator. Together with the new broadband amplifier, we anticipate being able to increase the frequency by a factor of 3 and to investigate the frequency dependence of the melts in the future. This will allow us to conduct measurements at wider temperature ranges. A cooling system will be designed to keep the anvils and the transducers at lower temperatures, minimizing performance degradation of transducers due to overheating in high-temperature experiments.
We plan to design and construct a tomography apparatus for “low-pressure” applications (up to 1 GPa), with the capability of triaxial deformation and fluid pressure control. Shear oscillation in rotational apparatus will be added for shear attenuation measurements at seismic frequencies. Seismologically-proven earthquake algorithms will be implemented for acoustic emission event location and full waveform analyses. Superhard anvil materials (cBN, sintered diamond, etc.) will be characterized to be used for higher pressure generation in multi-anvil devices.
A major upgrade to replace the entire APS accelerator with a new Multi-Bend Achromat (MBA) design has been proposed for implementation in the near future (∼year 2022). Both the horizontal beam size and the divergence of the electron beam will be reduced. This will, as a result, provide a ∼100-fold increase in the X-ray brightness and coherence on the undulator beamlines. On the bending magnets the gains are rather modest, but the reduced horizontal beam size will allow for better phase contrast imaging.
6 Conclusions
The upgraded LVP setup at the GSECARS bending magnet beamline provides the high pressure community with cutting-edge experimental hardware and software at the APS. A combination of various X-ray applications (diffraction, absorption) plus other add-on probing techniques, such as the ultrasonic system and the acoustic emission system, make GSECARS a comprehensive large-volume press facility at a synchrotron. We have demonstrated the capability to perform in situ high-pressure and high-temperature experiments to study the fundamental physical properties and structures of Earth-related materials, whether in crystalline, glass, or liquid phase. Measurements of velocity and viscosity of materials is available as well as experimental setups for studying the rheological properties of rocks and mechanisms of deep focus earthquakes. These investigations are critical in helping us to understand the Earth's Interior.
Acknowledgments
We thank N. Hilairet, Z. Jing, T. Sakamaki, J. Gasc, and F. Shi for their contributions to the development of the current large-volume press techniques during their postdoctoral years at GSECARS. We thank our users for their valuable input, especially S. Ma, P. Sanematsu, H. Xu, R. Li, Y. Kono, H. Watson, K. Todd for their contributions to the science highlights summarized in this report. Special thanks to A. Deyhim, E. Acome, and E. Van Every from Advanced Design Consulting USA Inc. for their valuable input during the design stage and for constructing the new system. We thank the PRIUS program of Ehime University for supplying NPD deformation pistons, which made deformation of superhard materials possible. We also thank generous and continuous support from the NSF. These grants (EAR-0001088, 0652574, 0711057, 0968456, 1214376, 1361276, 1620548, 1661489) played a crucial role in the developments of the techniques reported here. GSECARS is supported by the National Science Foundation – Earth Sciences Program (EAR-1634415) – and by the Department of Energy–Geosciences (DE-FG02-94ER14466). Use of the Advanced Photon Source was supported by the U.S. Department of Energy, Office of Basic Energy Sciences, under Contract No. DE-AC02-06CH11357.