1 Introduction
On a global scale, coastal environments have been strongly impacted by rivers (Stanley, 1997; Stanley and Warne, 1994). Rivers are considered the principal sediment delivery method towards marine environments and are closely dependent on climatic and human pressure (Syvitski, 2003; Syvitski and Kettner, 2011). In this context, several studies have been carried out in the Mediterranean basin to reconstruct the historical evolution of the river system (Bourrin, 2007; Duboul-Razavet, 1956; Guillen and Palanques, 1997; Roussiez et al., 2005). The increase of the Mediterranean population from 276 million in 1970 to 466 million in 2010 (GRID, 2013) is highly concentrated in coastal and deltaic areas and is associated with multiple human activities.
The decrease in sediment discharge caught by dams and water quality deterioration are some examples of the anthropogenic pressure suffered by the river. Similarly, deltaic coasts suffer from sediment loads restriction as their equilibrium is regulated by river feeds (Sánchez et al., 2010; Walling, 2006). The coastline regression and the coastal ecosystem degradation are the main consequence of the river discharge reduction.
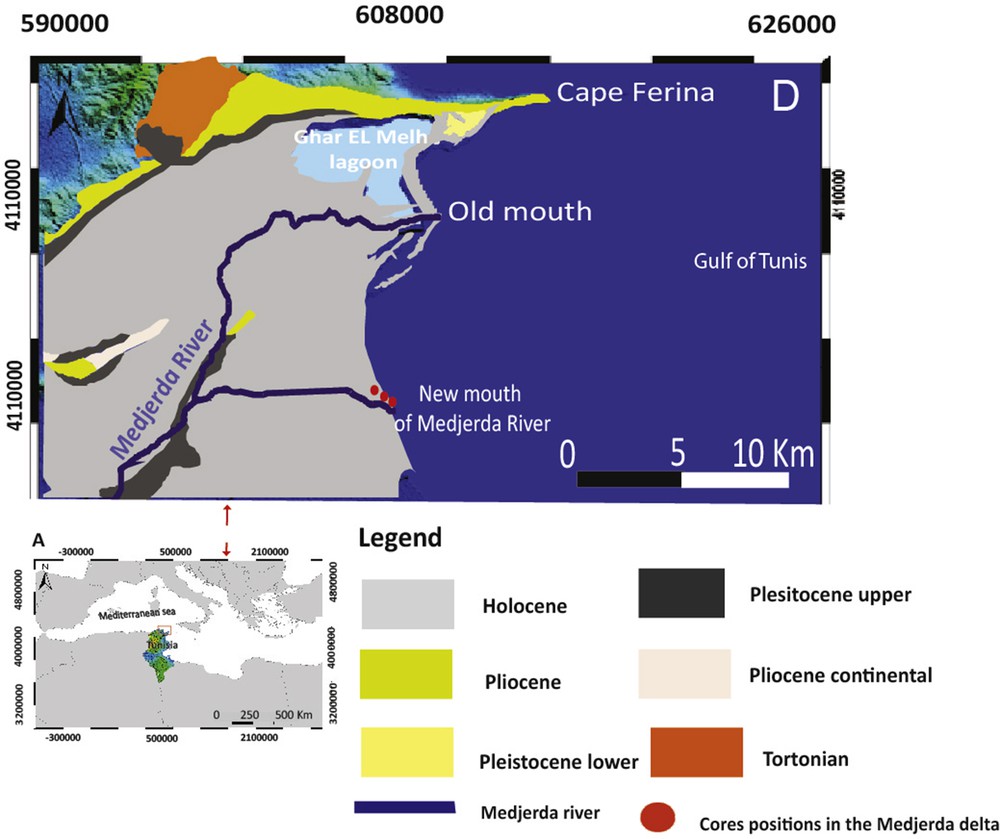
The shoreline configuration of the northern bay of the Gulf of Tunis in Tunisia (Fig. 1B) was deeply modified during this historical period mainly by the alluvial discharge of the Medjerda River (Paskoff, 1994).
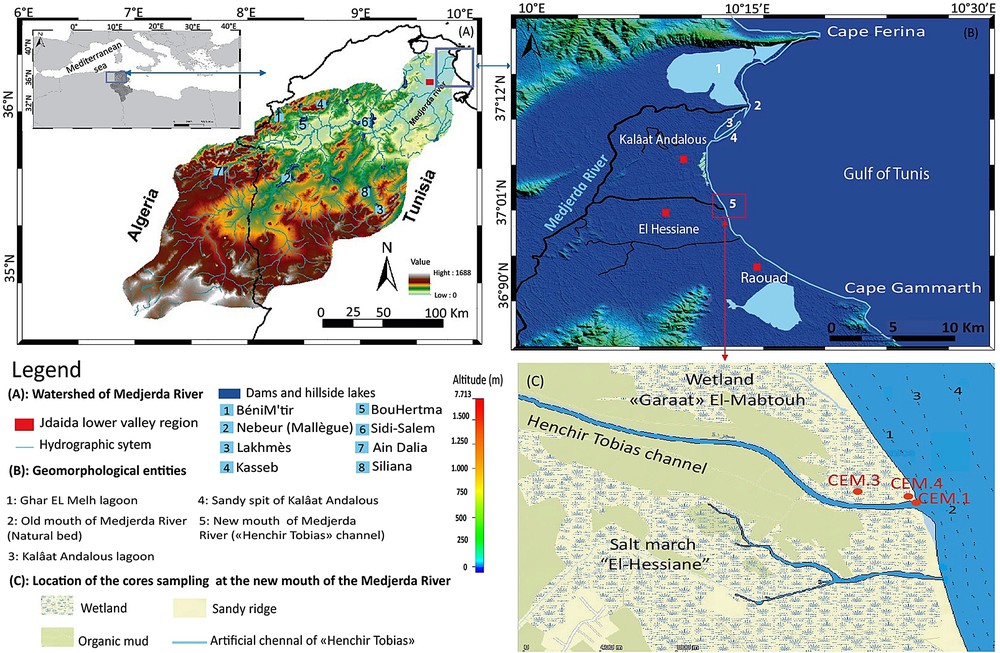
Location map of study area: the delta plain of the Medjerda River (Northern Bay of the Gulf of Tunis). (A) General location in the Mediterranean Sea, indicating the watershed of the Medjerda River with the main implemented dams. (B) Geomorphological entities. (C) Location of the cores sampling at the new mouth of the Medjerda River, the red square indicates the sediment cores positions.
From the beginning of the 20th century, the Medjerda River delta has been the subject of major hydraulic activities. These anthropogenic actions largely contributed to the modification of the morphology of the alluvial coastal plain (Paskoff, 1994). After the great flood of 1931, an artificial channel, “Henchir Tobias” was impounded in 1936, intended to evacuate the excess flow of the Medjerda River (Fig. 1A and B). This diversion reduces the Medjerda's main stream from a point located 10 km inland and 12 km south of the river's former mouth. This new mouth, object of this paper, is calibrated to absorb 70% of the flow of medium floods and leads directly to the sea in the El-Hessian region (Fig. 1B), (Paskoff, 1978).
A river sand bar has formed at the new mouth from successive sandy ridges due to the exploitation of the new channel (Paskoff, 1981). From 1973 onwards, the old natural bed was completely clogged (Paskoff, 1994). Only the new artificial channel was functional, so the creation of a new delta took place in the nearshore of the Gulf of Tunis at the new mouth. It is estimated that four years later the new delta had prograded over 35 ha in the nearshore (Paskoff, 1981). However, after the impoundment of the Sidi-Salem Dam in 1981 (Fig. 1A) (Zahar et al., 2008), the solid discharge of the Medjerda River was considerably reduced in the lower valley. The impact on the new channel of the Medjerda River is the object of this paper.
The same significant morphological and sedimentological changes were observed along the coastal region of the Gulf of Tunis after the anthropogenic changes made to the Medjerda River. Several morphological indicators of beach erosion were observed in this region during the past century as a result of the socio-economic development. This coastal area displays negative sedimentary levels especially in urbanized areas. Sediment storage reduction has been emphasized by previous studies (Amrouni el al, 2014; Benmoussa et al., 2017; Louati and Zargouni, 2009; Oueslati, 2004, 2010) which have shown a tendency towards erosion (Hzami et al., 2018; Louati et al., 2014). Shoreline retreat has been estimated to be −42.6 m/yr on the coast around the Medjerda River mouth during the period between 1972 and 2013 (Louati et al., 2014). However, few comprehensive data are available in the literature on the morpho-sedimentological changes inflicted by the new mouth of the Medjerda River on the southern coastal zone of the Gulf of Tunis.
The aim of this study is to provide a detailed insight of the human-induced impact on the deltaic-coast near the mouth of the Medjerda River in the Gulf of Tunis, through the morpho-sedimentological study of the Medjerda River sediment cores. A combination of approaches has been used including satellite imagery time series analysis, and sedimentological and geochemical investigations to assess the progradation and the retrogradation of the deltaic plain.
A qualitative study based on the multi-dates images was used to follow the shoreline evolution at the new mouth of the Medjerda River between 1936 and 2016. The sedimentological study, based on sediment cores, and performed at the mouth of the new channel of the Medjerda River, was necessary to follow the grain size and geochemical evolution of the sedimentary discharge in the new artificial channel “Henchir Tobias” to the sea. The 210Pbex, 137Cs radiometric dating has been used to establish a fine chronological scale of the morpho-sedimentological evolution of the coastal zone at the new mouth since 1936.
2 Study area
2.1 Physical setting
The Medjerda deltaic coast is located in the western bay of the Gulf of Tunis (Fig. 1). The Medjerda River originates in Algeria and crosses the North of Tunisia in the SW–NE direction toward the Gulf of Tunis. It is 460 km long with a watershed of 22,000 km2. The coastal system is characterized by three main geomorphological entities: the Kalâat Andalous lagoon, the delta plain of the Medjerda River and the Raoued beach. The backshore area near the new mouth in the south is occupied by the salt march “El-Hessiane” and the wetland of “Garâat El Mabtouh” (Fig. 1B and C).
The marine Quaternary covers the Medjerda River's lower valley and the surrounding highland (El Arrim, 1996; Jauzein, 1971). The lower valley of the Medjerda River occupies the old Gulf of Utique, filled by successive river floods during the Holocene period (Chelbi et al., 1995; Paskoff, 1994; Pimienta, 1959) (in Supplementary material: Fig. SM1). Thus, the coastal ridge has developed through alluvial deposits driven by the Medjerda River since ancient occupation of the Gulf of Utique (Oueslati, 1999).
The Medjerda River delta is characterized by high interannual discharge variability and a very high flood peak. The river has an annual average flow of 30 m3/s and reached 3500 m3/s in the exceptional flood of March 1973 where solid discharge reached 100 g/l (Claude et al., 1977). The river's average sediment yield is of about 10 g/l (Ben Mammou, 1998). The Medjerda water storage represents 22% of the country's renewable water resources.
2.2 Climatic environment
Medjerda region is located in a semi–arid area. The annual rainfall data shows that the rainiest period was between 1949–50 and 1958–59 with an annual average of about 553 mm, while this average was about 351 mm for the driest period between 1941–42 and 1950–51 (Fehri, 2014; Kotti et al., 2016). The Medjerda delta recorded several exceptional floods mainly in the middle of the 20th century: 1953–1954, 1957–1958, 1969–1970, 1972–1973, 1975–1976 and 2002–2003. These exceptional floods have greatly changed the morphology of the Medjerda delta (Depois, 1955).
The statistical analysis of wave data recorded from 2012 to 2017 (INM, 2017) shows a seasonal variability. The winter period is marked by strong and frequent landward winds from the W-NW and E–NE marine direction. During the summer period, winds blowing from the east and southeast are frequently recorded. The Gulf of Tunis is characterized by low tide ranges of about 0.20 m (Ben Charrada and Moussa, 1997).
2.3 History of human infrastructures
Since 1902, several hydraulic pumps have been implemented along the course of the Medjerda River, mainly in the Jdaida lower valley region (Fig. 1A). Since the beginning of the 20th century, management measures of the Medjerda River watershed were built to mitigate extreme flood hazards (Cherif, 1998). During the early 20th century, between 1932 and 1936, the artificial “Henchir Tobias” channel was dug out to occasionally deviate the excess flow of the Medjerda flood towards the sea (Samaali, 2011). In 1973 after important floods, the natural river course of the Medjerda River was naturally derived towards the “Henchir Tobias” channel which became the single new Medjerda River stream course towards the sea with a new mouth (Oueslati et al., 1987), while the former Medjerda lower course became used as an irrigation channel.
The watershed of the Medjerda River provides 109 m3 of water per year. Dams have been built along the Medjerda and its tributaries. The most important dams are: BéniM'tir (1954), Nebeur (Mallègue) (1955), Lakhmès (1966), Kasseb (1969), BouHertma (1976), Sidi-Salem (1981), Ain Dalia (1986, Algeria) and Siliana (1990) (Kotti et al., 2018; Zahar and Benzarti, 2008) (Fig. 1A). The Sidi-Salem Dam, the biggest one, has an initial storage capacity of about 5.5 × 10⁶ m3 and a surface area of 4300 ha.
3 Data and methodology
3.1 Spatio-temporal shoreline monitoring
We used satellite images to investigate the coastline evolution at the new mouth of the Medjerda River between 1936 and 2016.
The shoreline data position was extracted from Spot1 (1988), Landsat5 (1984), Spot4 (1999) and SentinelA2 (2016). We also analyzed aerial photographs taken in 1948 and1974 and topographic maps dating from 1936, 1952 and 1974.
The geographical data were classified under the Universal Transverse Mercator projection system (UTM) with zone 32 north under the World Geodetic System (WGS84). The synthetic maps were made with ArcGIS 10.2. From the processing of the satellite imageries, topographic maps and aerial images, we could record and map the land/sea limit over time. The coastline 1936 was taken as a reference line.
The shoreline, which is defined as the position of the land–sea interface at one instant in time (Gens, 2010) is a highly dynamic feature and is an indicator of coastal evolution. We completed the temporal shoreline monitoring using the Digital Shoreline Analysis System (DSAS) version 4.3 developed by Bush and Young (2009), Thieler and Danforth (1994), Thieler et al. (2009). The DSAS software was used to create transects across the delta and shoreline and analyze the different time positions of the shoreline so as to derive the amount of progradation/retrogradation (Net Shoreline Movement or NSM) and the rate of change (End Point Rate or EPR) of the shoreline position over time and at specific time intervals (Thieler and Danforth, 1994). Transects were 1 km long and spaced every 200 m to study the changes along the delta mouth of the Medjerda River and the coastline behavior. The baseline was built offshore and parallel to the general trend of the coastline. All the different shorelines were compared to the reference (1936) shoreline. We used linear regressions to analyze the measures. This work allowed visualizing the evolution of the coastline during a period of 80 years and determine its morphological changes. An error of ±12 m/yr was adopted for the NSM, and of 0.1 m/yr for the EPR (Hapke et al., 2006).
3.2 Sedimentological surveys
3.2.1 Core sampling
In December 2015 we sampled three sediments cores on the delta of the Medjerda River at the new mouth using a PVC tube (CEM-1: 1.68 m, CEM-3: 0.42 m and CEM-4: 0.48 m) (∅ = 80 mm) (Fig. 1C). We study the sedimentological evolution of alluvial deposits transported by the “Henchir Tobias” channel to the sea since its impoundment in 1936. The first sediment core (CEM-1) was taken from the coastline which separates a clayey platform from the sea. The purpose was to collect the deltaic sediments deposited on the former beach at the new mouth. To correlate the lithostratigraphic, sedimentological and geochemical results of the CEM-1 core analysis, we sampled CEM-3 from the backshore in the marshes area. This allowed us to follow the succession of alluvial deposits during a delta progradation process before and after the impoundment of the new mouth. The CEM-4 core was sampled from the recent dunes which are formed on the alluvial clayey platform. With this we aim to follow the recent marine sediment inputs in the deltaic zone at the new mouth. This sampling method allows a spatial survey of the sedimentological changes of the study area along a cross-shore profile from the backshore to the coastline. We describe below the analysis of the three cores.
3.2.2 Grain size analysis
The grain size analysis was performed directly on the sediment cores, every 1 cm, using a Beckman Coulter © LS 13 320 granulometer. Each sample was sieved to 1 mm, suspended in deionized water and gently shaken to obtain disintegration.
3.2.3 Geochemical analysis
The semi-quantitative geochemical analysis was carried out directly on the surface sediment cores using the mobile X-ray fluorescence (Nitron) (Croudace et al., 2006; Dezileau et al., 2011; Raji et al., 2015; Richter et al., 2006; Weltje and Tjallingii, 2008). An ultralene film was used to avoid contamination of the XRF unit and sediment desiccation. The International powder standards (MESS-3 and WS-E) were used to calibrate the analytical error and for accuracy of measurement (<10% for Fe, Al, Ti, Pb, and Ca).
The common multivariable data statistical Principal Component Analysis (PCA) method was applied to: 1) establish the common geochemical data sets (Grunsky and Smee, 1999); 2) determine the several poles related to potential sediment sources supplies. We choose the Fe, Cr, K, Rb, V, Ti, Ca, Sr, Pb, Zn, and Sr elements due to their good detection by the mobile XRF. We established the calculation factors F1 and F2 of the geochemical dataset using the XLSTAT statistical software.
3.3 137Cs and 210Pbex dating method
To date the sediments, we calculated the age of a radioactive sample based on the half-life of a radioactive constituent such as 210Pbex and 137Cs. The 137Cs and 210Pbex analyses were performed on the fraction <150 μm by gamma spectrometry using the CANBERRA broad-energy Ge (BEGe) detector. The 210Pbex is a natural radionuclide commonly used for dating in order to quantify the sedimentation rate (Dezileau et al., 2006; Goldberg, 1963; Krishnaswamy et al., 1971; Robbins and Edgington, 1975). The 137Cs is an anthropogenic radionuclide present in the environment between 1954 and 1980 (nuclear test). The 137Cs atmospheric releases started in 1953, with a maximum atmospheric production reached in 1963 (Robbins and Edgington, 1975). The calculation of the sedimentation rate is established from the age-depth relationship in the CEM-1 core. In this case the approach adopted by Pennington et al. (1976) and Noller (2000) was used.
4 Results
4.1 Temporal shoreline rate evolution
The synthetic map of the spatio-temporal shoreline evolution is illustrated in Fig. 2. Although the general shoreline rate trends reveal an increase, the mesoscale qualitative monitoring displays a non-linear shoreline and plain flood evolution. Three periods can be individualized. 1) The natural progression between 1936 and 1952. 2) The shoreline progression at the mouth of the new artificial channel, from 1952 to 1981. 3) The shoreline rate evolution after the man-made construction between 1981 and 2016.
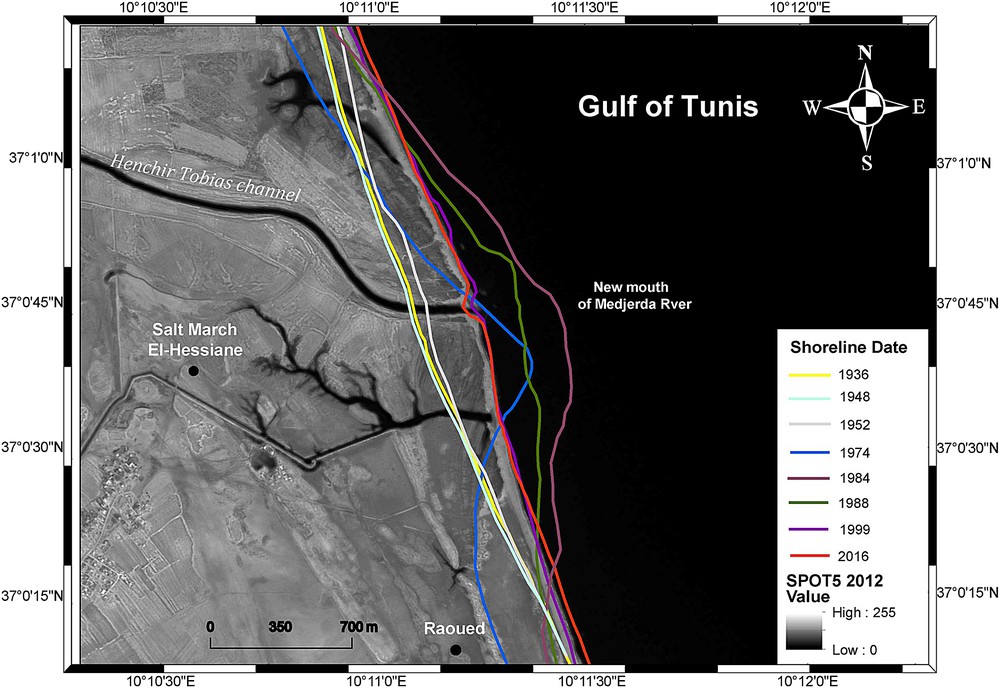
Synthetic graphic of the different time positions of the shoreline evolution of the new mouth of the Medjerda River.
The first timescale shows a linear shoreline evolution with no significant accretion rate. The second period is marked by the increase of the shoreline level and the deltaic plain as well until 1981. Furthermore, the 1981 date is related to the maximum coastal plain progradation.
The erosion trend must logically start in 1981 and it shows an asymmetric pathway of the deltaic mouth northward as revealed in the image of 1988. The general trend is a decrease of the shoreline rate during this period, and especially up until 1999. This decrease is smaller between 1999 and 2016; however, there is a notable change in the delta mouth which is visible in the last image of 2016.
Fig. 3 summarizes the quantitative evolution and change rates in the shoreline position for the 1936–2016 period at the new Medjerda delta. The evolution rate was based on the global change of the Net Shoreline Movement position (NSM) and the detailed rate of the End Point Rate (EPR) which are maximums in the new mouth and minimums in the periphery (south and north of the Medjerda River's new mouth). In fact, the general temporal progradation of the new Medjerda delta is significant, with a high accretion of 300 m ± 0.15 m (NSM) at the delta/coast flood plain (Fig. 3A). There, the detailed regional shoreline rate evolution, calculated from the EPR method, displays several evolution rates of the deltaic mouth and neighbor landforms. In fact, the EPR shoreline rate during 1936–1974 reveals an active progradation of the new deltaic mouth (+13m ± 0.15 m/yr). The neighboring river mouth beaches indicate a shoreline erosion rate with an average of –8 m ± 0.15 m/yr. Between 1974 and 1988, the deltaic plain had an accretion rate of 20–22 m ± 0.15 m/yr associated with a stable mouth (Fig. 3B). The shoreline rate at the river mouth decreases during the 1988–1999 period (maximum rate erosion of −20 m ± 0.15 m/yr). Moreover, the adjacent landform reveals a dissymmetric shoreline accretion from +10 m to 12 m ± 0.15 m/yr south and north, respectively. Finally, the recent temporal shoreline evolution for the period 1999–2016 shows a stable rate throughout the deltaic plain.
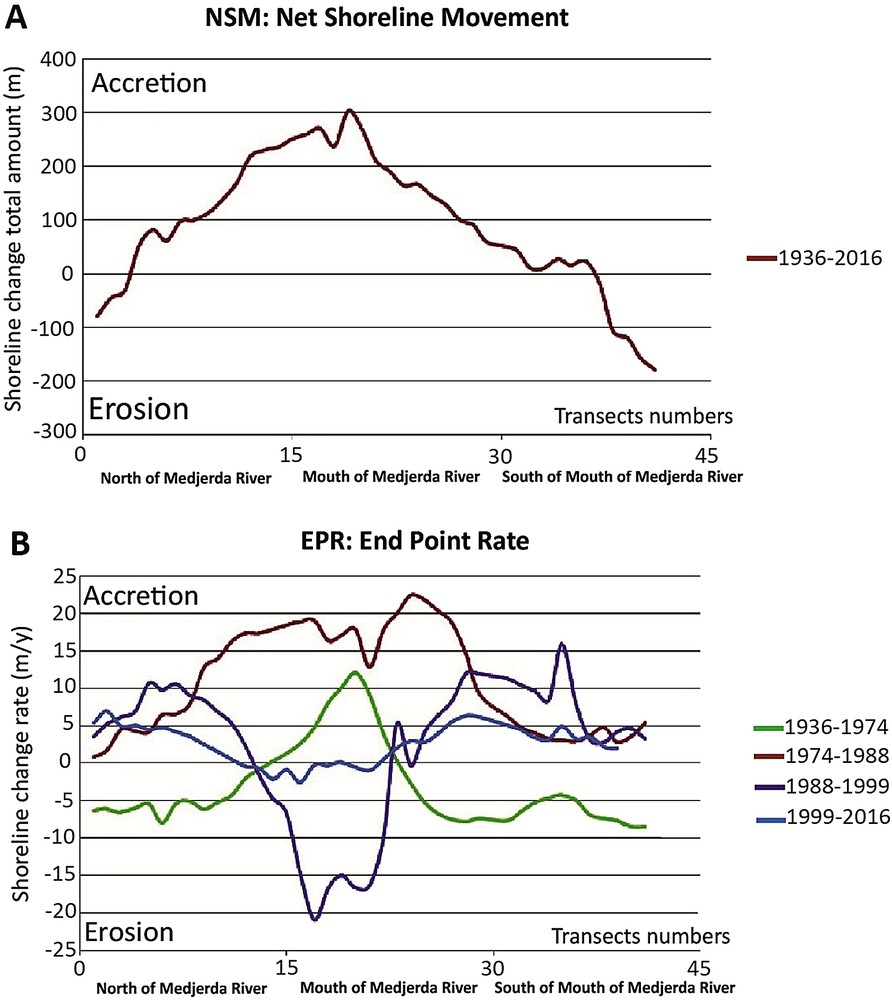
Shoreline evolution analysis at the new mouth of the Medjerda River. (A) The Net Shoreline Movement (NSM) during the 1936–2016 period. (B) The End Point Rate (EPR) during the 1936–2016 period. These transects were generated every 1 km in length and 200 m in spacing using the DSAS tool.
4.2 Sedimentological evolution
4.2.1 Granulometric composition
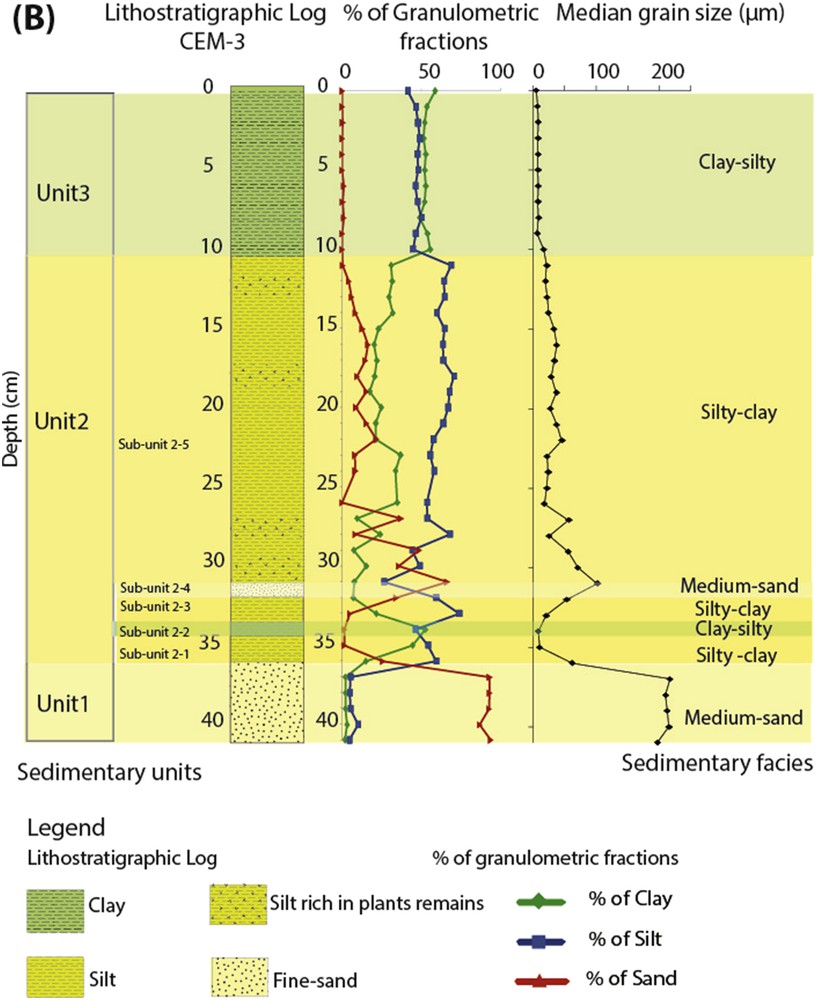
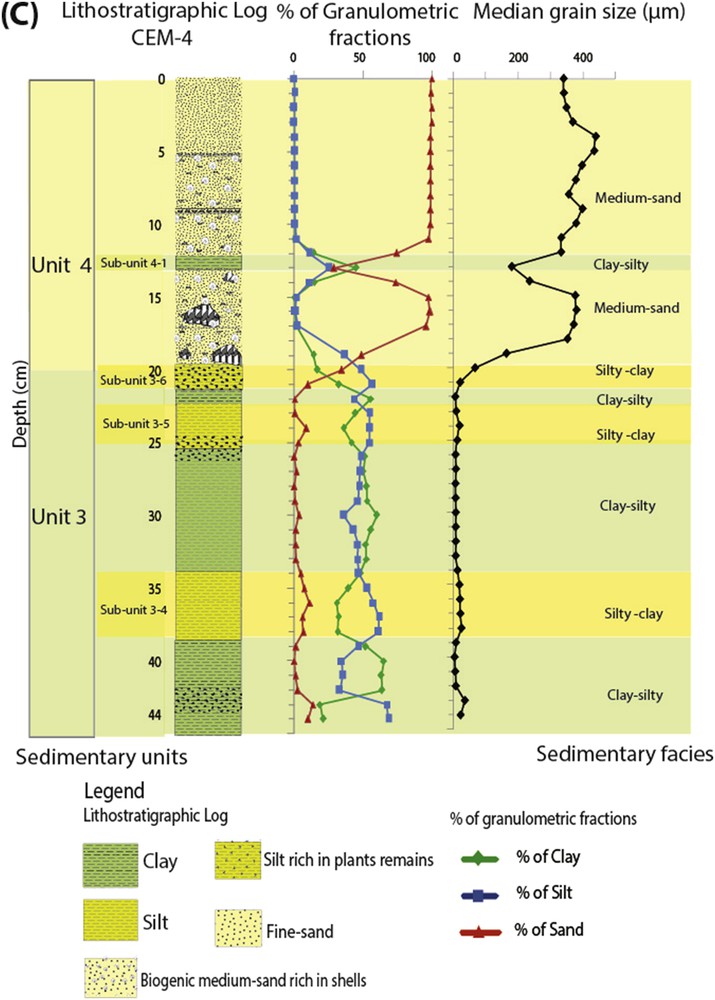
The high-resolution granulometric analysis of the sediment cores shows the presence of four well-differentiated sedimentary units (Fig. 4 and in Supplementary material: Fig. SM2, SM3).
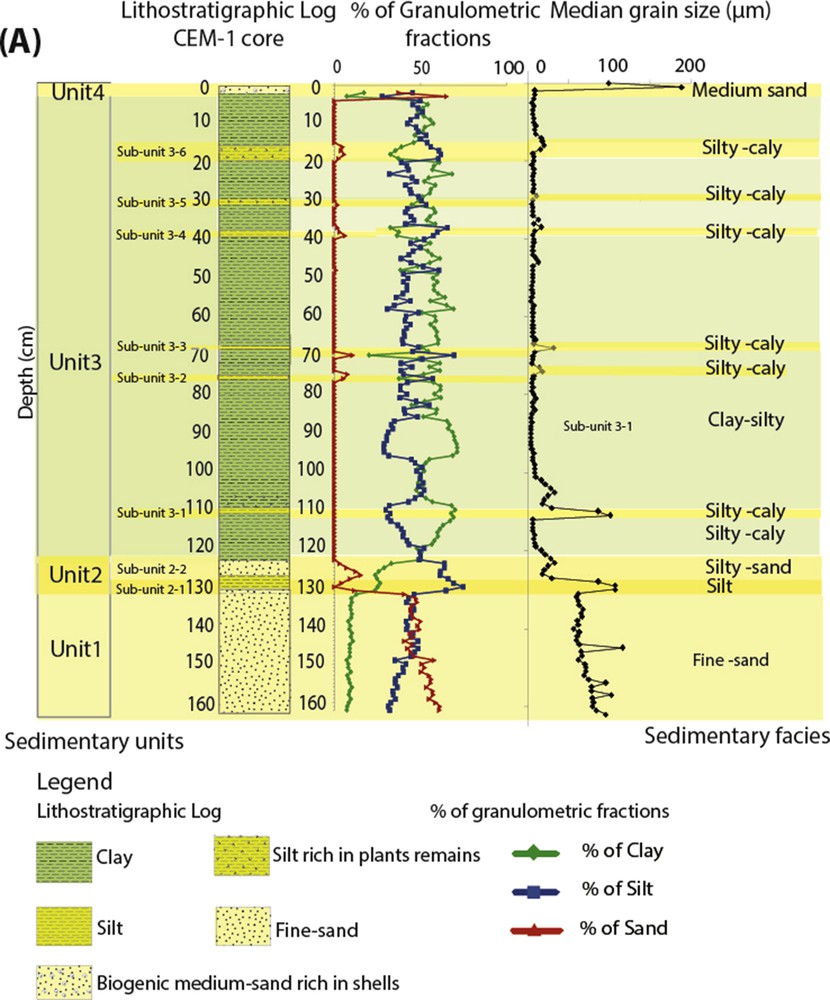
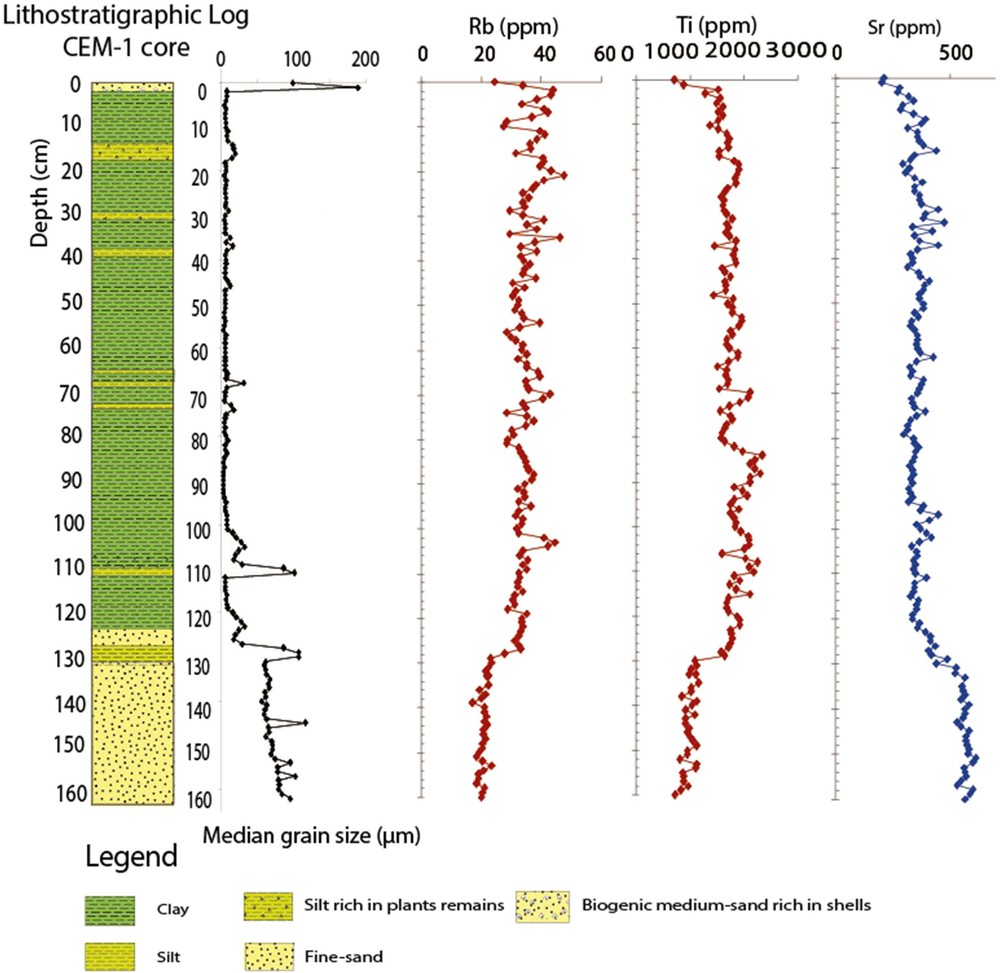
Downcore grain-size distribution. Four main sedimentary units are recognized for sedimentary facies (Unit 1, Unit 2, Unit 3 and Unit 4) of the CEM-1 core.
Unit 1: A basal layer dominated by very fine sands (Md = 0.08 mm) lies between 167 and –130 cm of the CEM-1 core (Fig. 4). This facies is located between −42 and −36 cm in the CEM-3 core (Fig. SM2) as is dominated by fine to medium sands (Md range from 0.18 to 0.20 mm).
Unit 2: A layer of 12 cm, at the −130 and −118 cm levels, is mainly composed of silt with the presence of a sandy fraction in the CEM-1 core (Fig. 4), and a layer of 10 cm, between −36 and −26 cm, composed of a sediment mixture in the CEM-3 core (Fig. SM2). This layer is subdivided into 3 subunits. From bottom to top, clay-silty, sandy and laminated clay are distinguished.
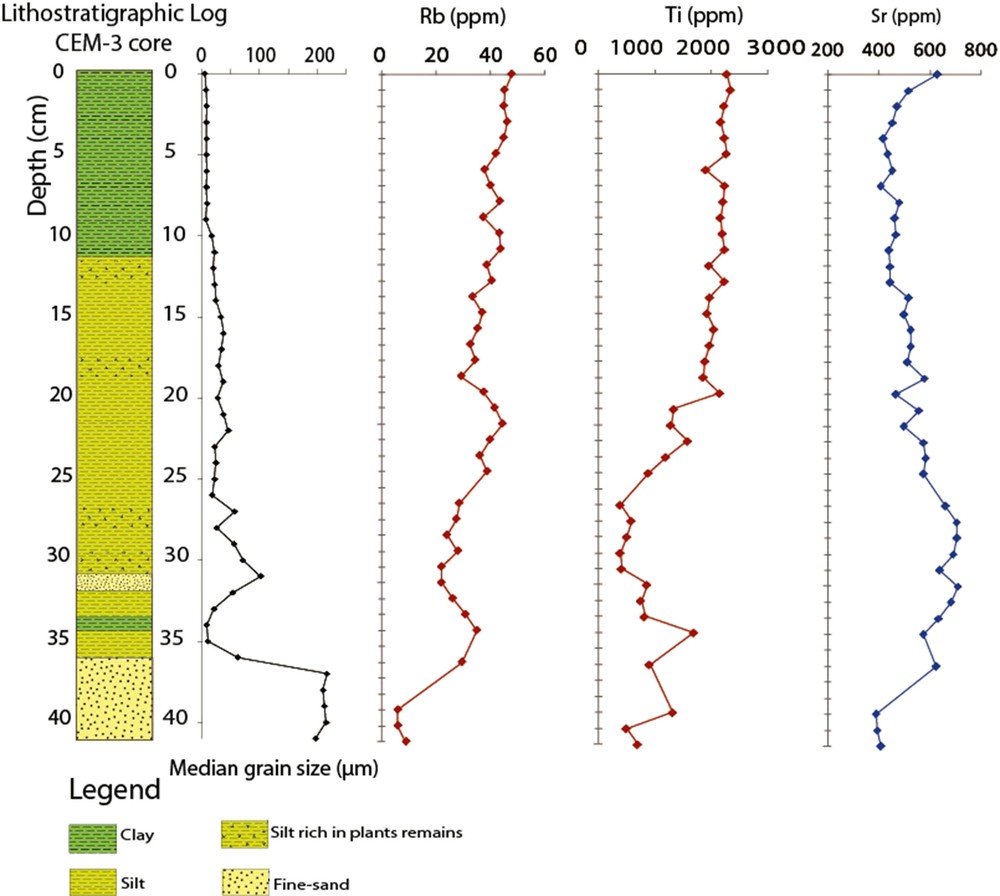
Unit 3: A layer of 100 cm, from −118 cm to −12 cm, characterized by rich clay and silt facies (Md < 0.063 mm) and by continental plant debris is observed in the CEM-1 core (Fig. 4). In the CEM-3 core (Fig. SM2), the top layer (10 cm) is essentially composed of clay and silt rich in plant debris.
Unit 4: The upper layer (Unit 4) is the thickest in CEM-4 (20 cm) (Fig. SM3) and is essentially constituted of very fine (Md = 0.07 mm) to medium sand (Md ranges from 0.350 to 0.440 mm) and is rich in shell debris. However, this layer is the equivalent to the 2 cm thin layer in the CEM-1 core (Fig. 4).
4.2.2 Geochemical characteristics
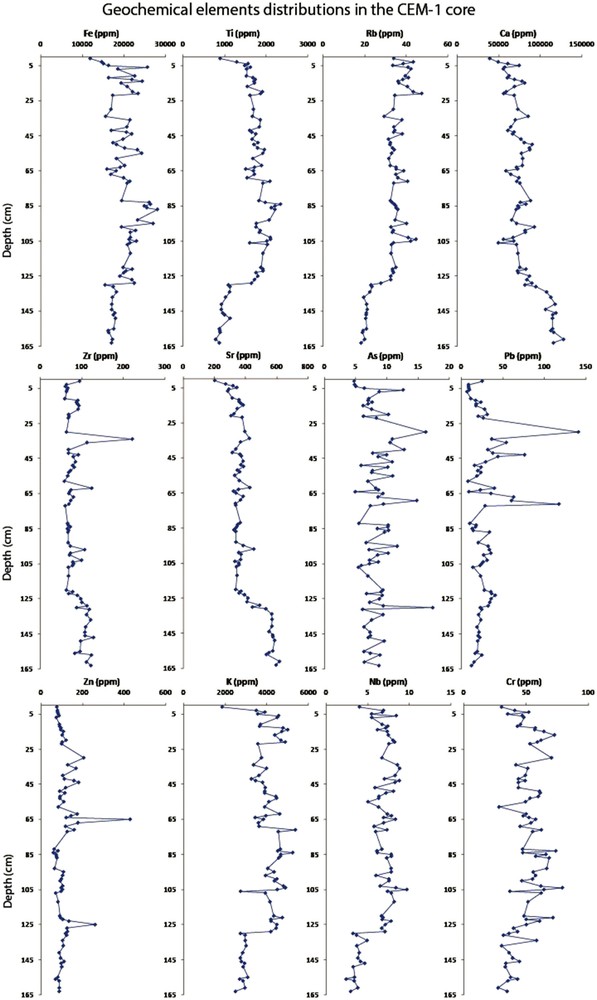
The geochemical results of the downcore (CEM-1 and CEM-3) show the variation in the concentration of chemical elements such as Fe, Ti, Rb, Ca, Zr, Sr, As, Pb, Zn, K, Rb and Cr. The PCA (Principal Component Analysis) of the CEM-1 shows the presence of three well-differentiated poles (Fig. SM6). The first pole regroups the terrigenous elements (K, Ti, V, Cr, Fe, Ni, Cu, Rb). The second pole is formed by the marine component such as Ca and Sr. The third pole gathers the Metal Trace Element such as Zn, Pb and As. The F1 and F2 statistical variables reveal a good correlation between the elements present in the same pole (66%), while the geochemical component related to terrigenous elements presents an anti-correlation with the marine element.
The detailed temporal evolution of the chemical elements along the sedimentary column CEM-1 and CEM-3 are illustrated in the Supplementary material: Fig. SM4 and SM5. In the CEM-1 core, the chemical elements (Rb, Ti) show a proportional increase in evolution from −160 to 130 cm. The Sr element pattern rate is inferred from the inverse trend (Fig. 5). According to the chemical signature of the CEM-1 core, two sedimentary units are well-differentiated: the marine layer and the terrigenous one.

Principal Component Analysis (PCA) of the new delta. The three poles associated the geochemical data from the CEM-1 core sediments with the major and trace elements concentrations. Iron (Fe), rubidium (RB), potassium (K), titanium (Ti), vanadium (V), chromium (Cr), lead (Pb), zinc (Zn), arsenic (As), calcium (Ca), and strontium (Sr).
The CEM-3 core displays similar peaks of the three related elements: Rb, Ti and Sr. Ca at the base of the core is found at 40–35 cm (Fig. SM-7). The 36 to 10 cm layer shows a non-linear evolution of the geochemical component at the beginning. Besides, the general evolution of the Rb and Ti profiles show an increase in content rate while the Sr concentration decreases. The signal fluctuation seems to be more stabilized at the end of the lithostratigraphic layer.
4.2.3 Chronological framework of recent alluvial deposits
The dating spectrum of the CEM-1 by 210Pbex and 137Cs radionuclides is illustrated in Fig. 6A and B.
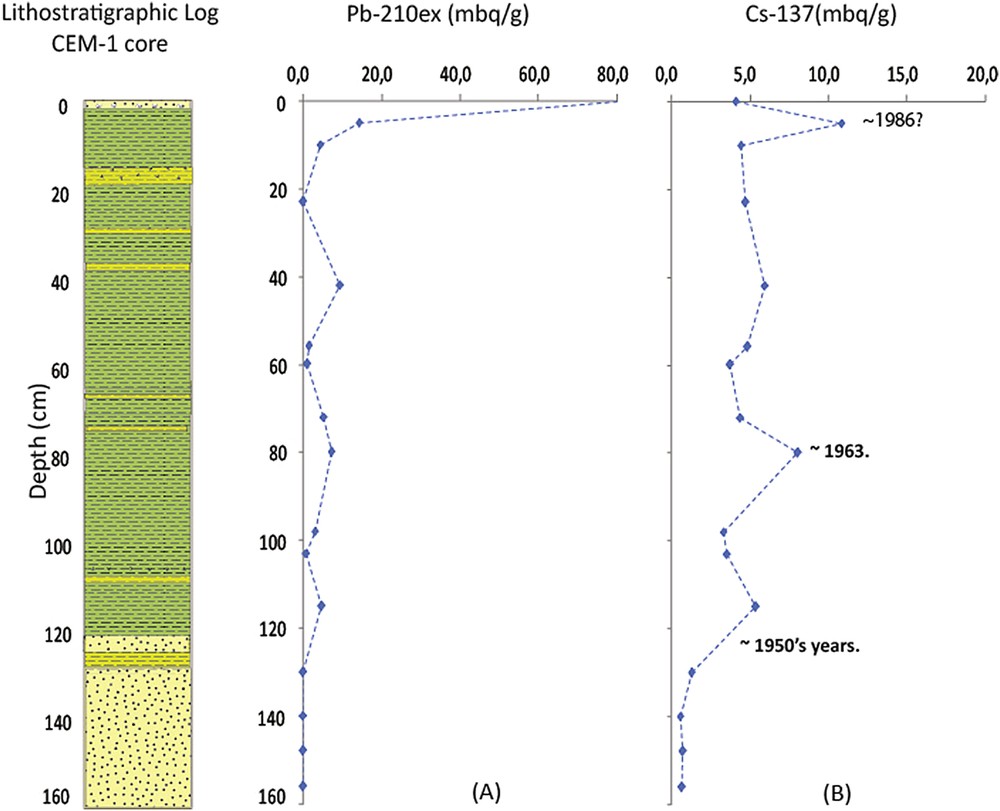
Geochronology of CEM-1 downcore using 210Pbex and 137Cs activity–depth profiles. (A): The 210Pbex activity profile; (B): 137Cs activity profile.
Fig. 6A shows that the 210Pbex presents a profile with very weak activities at 10 mbq between 5 and 140 cm in depth. This profile does not allow us to use the different models we have for calculating the sedimentation rate (C.I.C, C.F.C.S, C.R.S).
However, the activity profile of the down-core 137Cs (Fig. 6B) shows the increase of 137Cs activity at 115 cm which could be associated with the decade of the 1950s. The maximum activity of 137Cs at 80 cm is attributed to the period of maximum radionuclide fallout in the northern hemisphere associated with the peak of atomic weapon testing in 1960's. Based on the 137Cs activity profile in the CEM-1 sediment core, the accumulation rate is estimated at 3.3 cm/yr after 1960.
5 Discussion
The spatio-temporal monitoring of the morphology of the coastal zone in the new mouth of the Medjerda River, completed through the sedimentological, geochemical and chronological study of sediment cores, has allowed us to reconstruct a fine chronological framework of the recent morpho-sedimentological changes caused by the impact of human activity on the Medjerda River with the following keys dates:
- 1) the anthropogenic creation of the new mouth of the Medjerda River through the “Henchir Tobias” channel in 1936;
- 2) the start of the delta progradation processes with alluvial deposits caused by a rainy period in 1950;
- 3) the clogging of the natural main bed of the Medjerda River after the great flood of 1973;
- 4) the building up of the Sidi Salem Dam in 1981.
We divide this chronological framework into three main periods:
- 1) evolution of the new Medjerda coastal plain (1936–1952);
- 2) progradation of a new delta (1952–1981);
- 3) retrogradation of the new Medjerda delta after the dam construction (1981–2016).
5.1 Evolution of the new Medjerda coastal plain (1936–1952)
The damages caused to the Medjerda flood plain by the dramatic floods in 1931 led the national authority to create a new channel, the “Henchir Tobias”, which was started in 1932 (Samaali, 2011). The flow rate of the river started to divide into two channels in 1936 (Ben Mammou, 1998). The creation of the new channel provided an occasional human deviation of the flood sediment yields to the coast. Since most of the detrital river supply was driven by the natural flume of Medjerda until 1973, the study case located southward did not show any significant evolution (Fig. 2).
5.2 The progradation of a new delta (1952–1981)
The spatio-temporal evolution of the shoreline level associated with the sediment analysis reveals the progradation of the new anthropogenic delta since the 1950s at the new mouth of the “Henchir Tobias” channel. The climatic data for this period shows it was a rainy one with an annual average rainfall exceeding 500 mm/yr. The net accretion rate over the study area obtained from the NSM shows an accretion amount of 300 m ± 0.15 m.
The wave-dominated deltaic coast of the gulf of Tunis is also manifested by the dissymmetric pattern of the spatial deltaic mouth progradation along the northern ridge.
Furthermore, this period of new fluvial deposits is clearly seen in the sedimentary data core records with four units. Unit 1 is mainly sandy grains (where Md ranged from 0.08 to 0.20 mm). The geochemical components, such as Ca and Sr, confirm the marine origin. The first appearance peak of 137Cs illustrated in Unit 1 shows the historic sandy backshore before 1952. The spatial grain size distribution of Unit 1 to Unit 2, Unit 3 and Unit 4 throughout the three cores CEM-1, CEM-3 and CEM-4, clearly expresses the upcoming of the terrigenous sediment to the coast with the silty muddy facies covering the sandy substratum. The finest grain size is associated with terrestrial infilling by the new delta flume of the littoral plain and confirmed by the increasing rate of the Rb and Ti elements. The 210Pbex and 137Cs profiles confirm the functioning of the new channel by the 1950's.
5.3 The retrogradation of the new Medjerda delta after the construction of the dam (1981–2016)
According to the available spatial data of the shoreline level (1974–1984 and 1988) the beach erosion seems to be manifested especially starting in 1988. Both the shoreline rate erosion (−20 m ± 0.15 m/year) and the biogenic marine facies of the upper core layers (Unit 4) confirm this statement. Nonetheless, 1981 marks the construction of the Sidi-Salem Dam downstream of the watershed of the Medjerda River. The shoreline regression is mostly the response to such construction.
Besides, the increasing trend of silty to muddy depositional facies of the coastal deltaic plain confirms the trapped coarser fraction in the dam reservoir (Benmoussa et al., 2018; Kotti et al., 2018).
The 210Pbex and 137Cs mark the accorded event of the lithostratigraphic deposit due to the Chernobyl emission (1986), associated with the lowest sedimentation rate (0.10 cm/yr) in the 20th century. Those results were similar to the previous qualitative diagnostic of shoreline regression after the dam construction (Oueslati, 2004; Saïdi et al., 2014; Samaali, 2011).
The current shoreline evolution seems to have stabilized at the regression level since 1999 and is associated with a low sedimentation rate of the fluvial supplies. It can be also associated with the climate change effect where, lately, conditions are close to the driest period registered with the lowest precipitation rate and the highest sea level rise fluctuation (GIEC, 2007; IPCC, 2013). In Supplementary material, Fig. SM8 (A and B) summarizes the historical evolution of the anthropogenic Medjerda delta and the main temporal factors responsible for its development and retrogradation during the 20th century in the Gulf of Tunis.
6 Conclusion
The present study gives an insight of the deltaic progradation as a result of the Medjerda River deviation between early 1932 and 1952. Four sedimentary units were well-differentiated in the sediment core ranging from the marine sandy layer to the clay facies rich in terrigenous components such as K, Ti, V, Cr, Fe, Ni, Cu, Rb. The sedimentological records of the incoming discharge from the main tributaries in the land-coast river plain reveal a maximum level rate in the 1974–1981 period. The End Point Rate statistical method shows that the maximum shoreline accretion rate of the river mouth ranges from 20 to 22 ± 0.15 m/yr. As terrigenous chemical elements (i.e. K, Ti, V, Cr, Fe, Ni, Cu, Rb) increase and form sediments, matter yields from the new Medjerda discharge are expected. Thus, the 137Cs and 210Pbex radiometric dating confirm the functioning of the new river flow by the 1950s with the highest sedimentation rate being 3.3 cm/yr.
The shoreline retreat, the large scale of the clay facies in the delta front and the decreasing sediment rate of fluvial flow are all due to the dam construction in 1981. Therefore, deltaic progradation and retrogradation processes of the new Medjerda River have mainly been controlled by anthropogenic factors during the last century.
Unfortunately, we could not sample any other sediment cores in the nearshore of the Gulf of Tunis to have a broader survey of the sedimentological impact of the new mouth (calculate the sedimentary surface and the quantification of the volume transported by the new channel towards the sea). This will be the object of future studies.
Acknowledgements
This study was conducted as part of the research project RYSCMED funded by the Joint Committee of PHC-UTIQUE-CMCU Project (No. 16G1005). The fieldwork was carried out and financed by the “Institut national des sciences et technologies de la mer”, Salammbô, Tunisia. The analyses were carried out in the “Laboratoire of géosciences” of Montpellier, France. The authors would like to thank Pr. Alberto Sànchez (“Centro Interdisciplinario de Ciencias Marinas, Instituto Politécnico Nacional”, La Paz, Baja California Sur, México.) for his valuable comments. The authors are particularly indebted to Prof. Isabelle Manighetti, who so carefully handled and improved the quality of our paper and thank also the anonymous reviewer for his valuable and helpful comments.
Appendix A Supplementary data
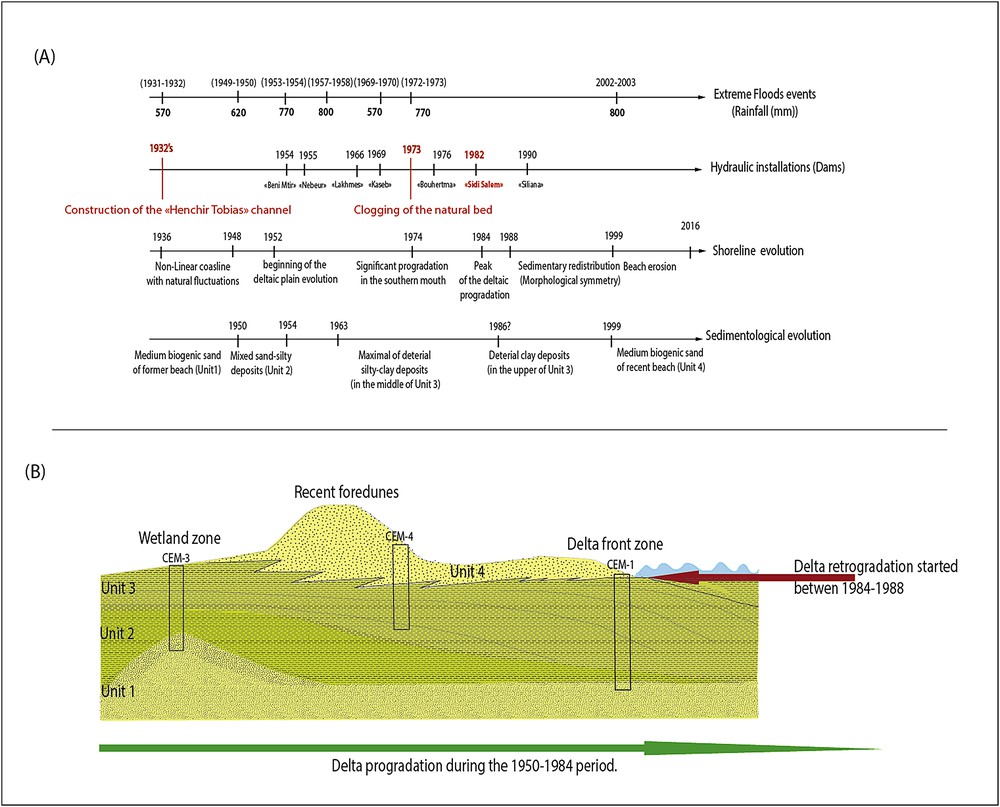
The following are the Supplementary data to this article: Geological map of study area: the delta plain of the Medjerda River (Northern Bay of the Gulf of Tunis). Downcore grain size distribution. Four main sedimentary units are recognized for the sedimentary facies of the CEM-3 core carried out in the wetland zone. Downcore grain size distribution. Four main sedimentary units are recognized for the sedimentary facies of the CEM-4 core carried out on the recent beach. Distribution of the geochemical elements in the CEM-1 core sediment. Distribution of the geochemical elements in the CEM-3 core sediment. Plots of the evolutions of rubidium (RB), titanium (Ti), and strontium (Sr) as geochemical elements according to the lithostratigraphic log of the downcore and the median grain size (Me) evolution of the CEM-1 (A) downcore. Plots of the evolution of rubidium (Rb), titanium (Ti), and strontium (Sr) as geochemical elements according to the lithostratigraphic log of the downcore and the median grain size (Me) evolution of CEM-3 (B) downcore. (A) Temporal scale of the hydraulic installations, the shoreline evolution and the grain size distribution at the new Medjerda delta Plain. (B). Synthetic diagram of the morphological changes involving the development and the retrogradation of a new delta of the Medjerda River during the 20th century.