

1 Introduction
Soil surface parameters such as soil moisture and soil surface roughness are key elements in many environmental studies, including earth surface water cycles, energy exchange, agriculture, and geology (Herrmann et al., 2016; Paloscia et al., 2012; Sellami et al., 2014; Zhang et al., 2015). Moreover, these parameters can be used to investigate natural hazards, such as floods, droughts, and climate changes (Costantini, 2016). Soil moisture and soil surface roughness are especially critical parameters that well describe soil surface. Soil moisture represents the abundance of water in soil on a volumetric or gravimetric basis (Zhao and Li, 2013). Soil moisture has received much attention because it affects various processes involved in atmosphere–surface interactions and has been reported as an essential climate variable (Al-Yaari et al., 2014). Another main feature of the ground is its surface roughness (Baghdadi et al., 2002). In particular, the latter influences water infiltration. Therefore, obtaining information on soil moisture and soil surface roughness is critical to many applications.
Traditionally, soil moisture data has been collected by field measurements. Yet those only provide sparse point measurements. In recent decades, researchers proposed several methods to estimate the soil water content using remote sensing data in the thermal and microwave domains (Haider et al., 2004; Maltese et al., 2013a, b; Minacapilli et al., 2012; Rao et al., 2013). Synthetic-aperture radar (SAR) is increasingly becoming a vital sensor used to retrieve soil surface parameters because it overcomes the limitations of the thermal sensors by providing higher spatial resolution and weather condition data acquisition (Aubert et al., 2013; Bousbih et al., 2017; Capodici et al., 2013; Dong et al., 2013; El Hajj et al., 2017, 2018; Gao et al., 2017).
The backscattering coefficient (σ0), which is the signal returned from that SAR sensor, is affected by the soil's dielectric constant, which is linked to soil moisture and to soil surface roughness (Bertoldi et al., 2014; Kornelsen and Coulibaly, 2013). The dielectric constant is defined as the number of water dipoles per unit volume fraction (Dobson and Ulaby, 1986). In soil surface parameters retrieval from SAR data, it is common to use a backscattering model that represents the relation between the soil surface parameters and the SAR returned signal (Sahebi et al., 2002). In particular, the backscattering models may be composed of soil surface parameters and sensor configurations such as incidence angle, polarization, frequency, and backscattering coefficients. Therefore, it can be stated that the backscattering models are employed to simulate the relation between SAR backscattering coefficient (σ0) value and sensor-surface condition. Clearly sensor–surface condition refers to soil surface parameters and sensor configurations. It should be noted that sensor configurations are provided as the metadata hence the only unknown parameters are the soil surface parameters. Professionally, the backscattering coefficient is thereby determined by the sensor configurations and soil surface parameters (MirMazloumi and Sahebi, 2016). Researchers have developed various backscattering models, which can be classified into three groups: 1) theoretical models, based on electromagnetic wave scattering, such as the Integral Equation Model (IEM) (Fung et al., 1992) and the modified IEM (Baghdadi et al., 2015); 2) empirical models that have been developed based on corresponding ground soil surface parameters and SAR backscattering coefficient measurements (Attema and Ulaby, 1978; Sahebi et al., 2003); and 3) semi-empirical models that have been developed based on the relation between dielectric constant and signal behaviour as well as laboratory measurements by scatterometer (Dubois and VanZyl, 1994; Oh et al., 1992). Common backscattering models are composed of two or three surface parameters simultaneously, and therefore multi-incidence angle (Srivastava et al., 2009), multi-polarization (Baghdadi et al., 2015; Bourgeau-Chavez et al., 2013), and multi-frequency (Pierdicca et al., 2008) SAR data are required to retrieve the soil surface parameters. Another methodology has been to use multi-temporal SAR data based on the assumption that temporal changes in surface roughness occur over a longer time than data acquisition delays (Lievens and Verhoest, 2012). Therefore, the main limitation of retrieving soil moisture and soil surface roughness simultaneously from SAR data using backscattering models is the necessity to acquire multi-configuration SAR data.
The Modified Dubois Model (MDM) is one of the SAR backscattering models for soil surface parameters retrieval from SAR data (Sahebi and Angles, 2010; Sahebi et al., 2003; Zhang et al., 2015). Since the MDM is composed of two unknown variables, including soil dielectric constant (soil moisture) and soil surface roughness, it is inevitable to use multi-configuration (Rao et al., 2014; Sahebi and Angles, 2010; Sahebi et al., 2003) or multi-temporal (Zhang et al., 2015) SAR data to retrieve soil surface parameters. Multi-frequency techniques suffer from diverse penetration depths of the different frequency SAR signals in the soil, which means that various dielectric constants affect the SAR returned signal. The main downside of multi-polarization techniques is the low sensitivity to soil surface roughness of the different polarizations (Sahebi et al., 2002). A serious criticism of multi-incidence angle methods is that they assume that soil moisture values are constant over time, since multi-incidence angle SAR data must be acquired in different days. Therefore, the goal of this study is to propose a methodology based on the genetic algorithm (GA) to retrieve both dielectric constant (soil moisture) and soil surface roughness from single-acquisition single-configuration SAR data in an optimization approach. The GA is an optimization algorithm that had been used in remote sensing for different applications (Almeida and Torres, 2017; Zhang et al., 2017).
2 Data
In this study, we have used two types of data: 1) ground truth data, which are field measurements of the two soil surface parameters, 2) SAR data. Three SAR datasets with corresponding ground measurements from the USA (one site) and Canada (two sites) in HH (horizontal transmit and horizontal receive) polarization and C band are used. The first dataset includes twenty field measurements with the corresponding AIRSAR C band SAR data from the Little Washita Experimental Watershed (LWREW) located in Oklahoma; it was acquired during the Soil Moisture Experiments (SMEX03) (Jackson and Cosh, 2006). Eleven and eighty-four field measurements with corresponding Radarsat-1 and SIR-C data in the C band were used from Quebec and Ontario provinces, respectively. Soil surface roughness values were calculated through digitizing of photographed grid boards and the soil moisture values were measured with impedance probe (ThetaProbes) for all three datasets. These values were measured for agricultural parcels. In particular, a different number of measurements (regarding the size of each parcel) were conducted within an agricultural parcel and then the mean value was devoted to each parcel as the ground truth measurement. The specifications of the three data sets are provided in Table 1. The soil moisture values are converted into dielectric constant and reverse (Delta-T Devices Ltd, 2017).
SAR data specification for each study area used for the proposed methodology evaluation.
| Specifications | Study area | ||
| Oklahoma | Quebec | Ontario | |
| Number of ground measurements | 20 | 11 | 48 |
| Incidence angle of SAR acquisition (degree) | 62–69 | 44–46 | 33–44 |
| Dielectric constant | 3–11 | 7–17 | 9–22 |
| Soil surface roughness | 0.4–3 cm | 2–5 cm | 1–5 cm |
The detailed pre-processing explanation steps and data descriptions of the Quebec, Oklahoma, and Ontario datasets are provided in Sahebi and Angles (2010) and MirMazloumi and Sahebi (2016), respectively. Hence, the pre-processing steps are only briefly provided herein. At first, we have applied a radiometric calibration on three SAR datasets to convert the DN value to the backscattering coefficient. Afterward, the SAR datasets of both Quebec and Ontario were geo-referenced using ground control points collected by GPS while the AIRSAR dataset of Oklahoma was geo-referenced using a digital ortho photo quadrangle. Finally, the mean value of the backscattering coefficient for each (same as the ground measurements) parcel was calculated for the three datasets.
3 Methodology
We have used the modified Dubois model (MDM) which has been used by Sahebi and Angles in (2010) as the backscattering model in this study. We have chosen the MDM based on two reasons. In our previous investigation, we recognized that the MDM has the most precise performance to establish the relation between ground truth and modeled (using MDM and SAR data) soil surface parameters. The MDM was calibrated for HH polarization with multi-incidence angle measurements as shown in Eq. (1):
| (1) |
Optimization approaches can be utilized to solve an equation with two unknowns when only one observation is available. Moreover, the optimization approach does not require to invert the backscattering model. This can reduce the complexity of retrieving soil surface parameters especially in cases that backscattering models are not invertible and requires numerically iterative solutions (Oh et al., 1992).
The GA is a subclass member of evolutionary algorithms that are inspired by the natural selection process (Pal and Wang, 2017; Sastry et al., 2014). Simply, the goal of the optimization is to minimize or maximize a function by selecting the best element from different input values (soil dialectic constant and soil surface roughness in our case). In particular, this best element is the global minimum of the corresponding function. In this study, the cost function is a reformation of the MDM, as shown in Eq. (2).
| (2) |
In an ideal situation, the difference between the first term (backscattering coefficient) and the second term (including the soil dielectric constant and soil surface roughness as unknown variables) must be zero. It is worth noting that the other variables in Eq. (2) are provided in the metadata of the satellite data.
In the first step, an initial number of random populations (initial populations), which are candidate solutions, are generated by the GA. In our case, each candidate solution is composed of a pair of soil dielectric constant and soil surface roughness values. These values are randomly selected within a pre-defined upper and lower boundary of each variable. The upper and lower boundaries are determined based on the conditions each dataset. The information regarding the conditions of the datasets are provided based on field studies and ground truth values. This will decrease the possibility for the GA to fall into local minima and also help the GA find the best solution faster.
These candidate solutions are used to minimize Eq. (2). In particular, the second term of Eq. (2) is calculated from the metadata and each pair of candidate solutions. Then the final form of Eq. (2) is calculated. A score value based on the final value of Eq. (2) is assigned to each candidate pair. It is clear that any candidate solution that leads Eq. (2) to be closer to the ideal situation will be assigned a better score. In the next step, the tournament selection (TS) procedure is applied to choose the suitable (with a high score in the previous step) candidates as parents for the crossover stage. TS is a selection mechanism for selecting candidate solutions for the further stage of the GA named crossover (Miller and Goldberg, 1995). In the crossover stage, two candidate solutions from TS are combined to produce a new solution. Also, a number of new solutions are produced based on a random change in the soil surface parameters value from the initial population, which is called mutation. The reproduced solutions in the crossover and mutation stages are evaluated (computing their score) based on Eq. (2). All the solutions from the initial population, crossover, and mutation stages are sorted based on their score and a pre-defined number of best solutions are selected. These solutions will be the population in the new iteration. The GA continues to produce new generations (set of solutions) and all operation above including TS, crossover, and mutation is applied to each solution. At last, the operation stops when the soil surface roughness and dielectric constant pair (candidate solution) validates the stopping criterion. In this study, the stopping criterion is set based on the final value of Eq. (2). In particular, if the calculated value from Eq. (2) for one solution is smaller than 105, the GA will stop. Obviously, the final optimum solution is the corresponding solution that validates the stopping criterion. Fig. 1 represents the flowchart of the proposed methodology.
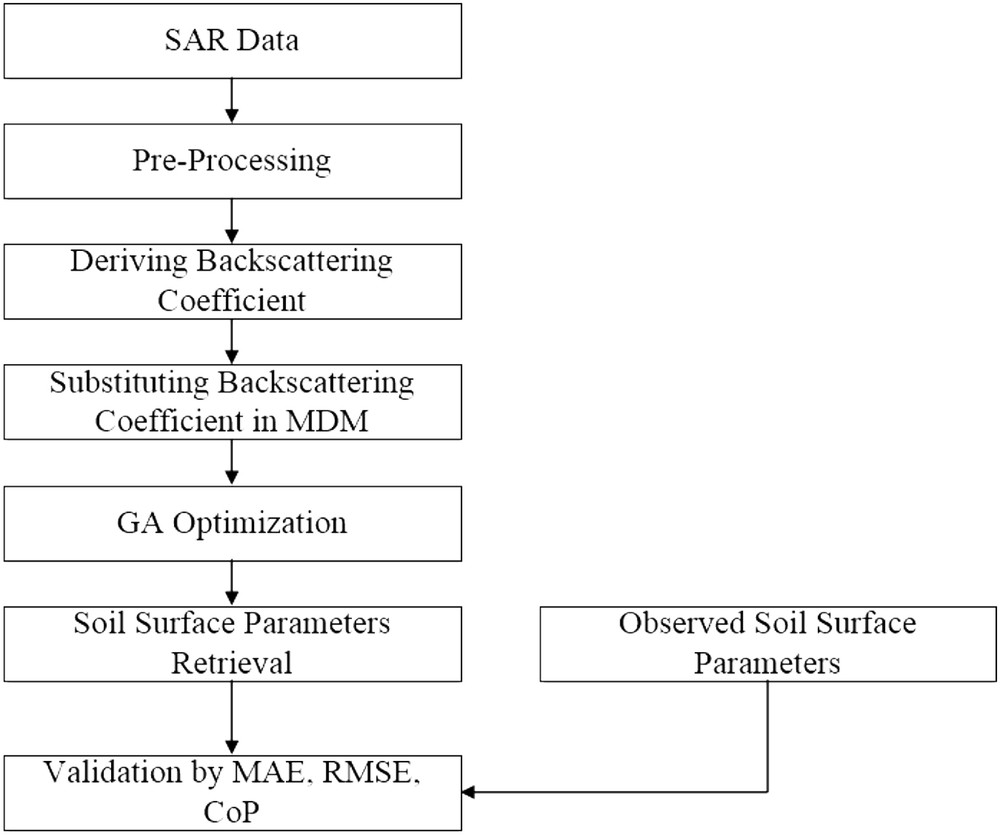
Flowchart of the proposed methodology.
After the retrieval procedure using the GA, we have compared the retrieved values of soil surface parameters with the ground truth measurements. We have used four criteria, including correlation coefficient (CC), mean absolute error (MAE), root mean squared error (RMSE), and the coefficient of performance (CP) (James and Burgess, 1982) to evaluate the performance of the proposed methodology. The CP is an error evaluation criterion that allows the comparison of retrieved and ground measured values of the soil surface parameters, which is shown in Eq. (3):
| (3) |
4 Results and discussion
Table 2 represents the values of MAE, RMSE, and CP of the soil dielectric constant, soil moisture, and soil surface roughness for each dataset separately.
Obtained values (MAE, RMSE, and CP) of the dielectric constant, soil moisture, and soil surface roughness with genetic optimization for three datasets.
| Parameters and criteria Dataset | Soil dielectric constant | Soil moisture (%) | Soil surface roughness (cm) | ||||||
| MAE | RMSE | CP | MAE | RMSE | CP | MAE | RMSE | CP | |
| Quebec | 0.51 | 0.71 | 0.68 | 2.32 | 2.71 | 0.98 | 3.97 | 4.63 | 0.96 |
| Oklahoma | 0.71 | 1.05 | 2.52 | 1.35 | 2.11 | 0.67 | 3.25 | 4.65 | 0.64 |
| Ontario | 1.02 | 1.3 | 1.34 | 3.23 | 4.27 | 1.69 | 4.89 | 6.37 | 1.69 |
Table 2 shows that the retrieval procedure based on the GA provided promising results with only single-acquisition single-configuration SAR data. Fig. 2 shows the correlation between the retrieved values of the soil dielectric constant, soil moisture, and soil surface roughness, and the corresponding ground measurement values. Generally, it can be seen in soil dielectric constant and soil moisture scatterplots of Fig. 2 that there are two clusters of values. The reason is that soil dielectric constant and soil moisture of two datasets (out of three datasets) have nearly the same ranges, as can be seen in Table 1. In addition, these clusters are related to the physical characteristics of agricultural parcels that have been used in this study. In addition, a number of outlier points can be seen in Fig. 2. Falling into local minima can be the reason for this behavior. In particular, the best candidate solution of the GA which has satisfied the stopping criterion may have fallen into local minima. Local minima are defined as a point in which the candidate solution may result in satisfying the stopping criterion while it is not the actual (close to ground measurements) best solution. This issue shall happen if the cost function has several local minima around the global minima. Whatever it be, Fig. 2 suggests that the optimization approach for the retrieval of soil surface parameters provides promising results based on the satisfying correlation coefficients between retrieved and ground measurement values of the soil surface parameters.
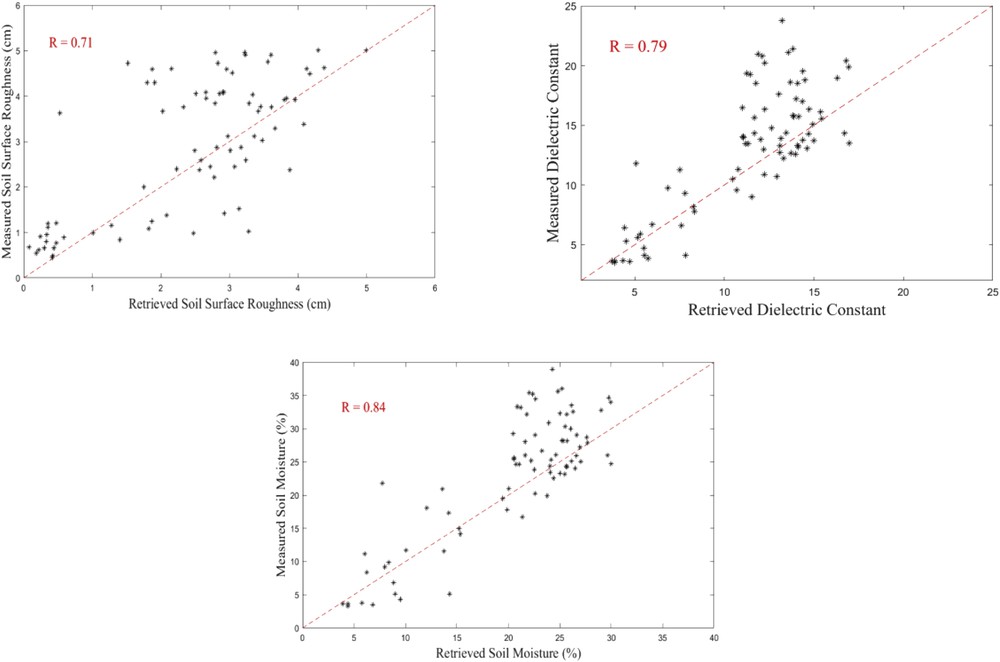
Comparison between measured and retrieved soil surface parameters for all three datasets (Quebec, Ontario, Oklahoma).
Also, we have investigated the relationship between the soil surface parameters retrieval error (the difference between retrieved and ground measurement values) and the incidence angle (Fig. 3). According to this investigation, the retrieval errors of the soil dielectric constant, soil moisture, and soil surface roughness in the optimization approach do not have any dependency on the SAR incidence angle. According to Fig. 3, it can be understood that each cluster (the first cluster from 30 to 40, the second cluster from 40 to 50 and the third cluster from 60 to 70) of soil surface parameters generally experience the same range of retrieved error. in other words, Fig. 3 illustrates that the retrieval error does not have a dependency on the incidence angle.
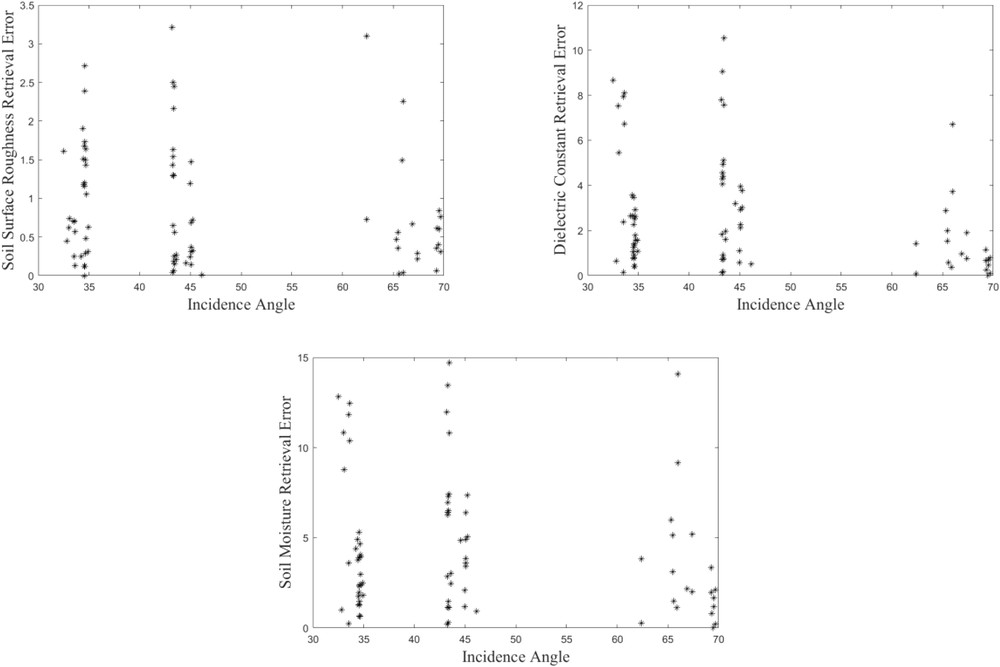
Investigating the relation between the incidence angle and the retrieved soil surface parameters for all three datasets (Quebec, Ontario, and Oklahoma).
Fig. 4 presents the relation between the retrieved soil surface parameter errors and the ground-measured values of the soil surface parameters. It shows that the higher values of the soil dielectric constant, soil moisture, and soil surface roughness contain higher retrieval errors. This behavior can be explained through the inherent issue in the MDM. The MDM backscattering model is sensitive to high values of the soil surface parameters (Angles, 2001). In particular, the Dubois model has been developed for moderate soil surface roughness and, therefore, it may have less accuracy in simulating the relation between high soil surface values to backscattering coefficient (Dubois and VanZyl, 1994). Also, it should be noted that each backscattering model has a validity range that shows the range in which the model performs robustly, and the confidence of the model should decrease out this range (Ulaby et al., 1982).
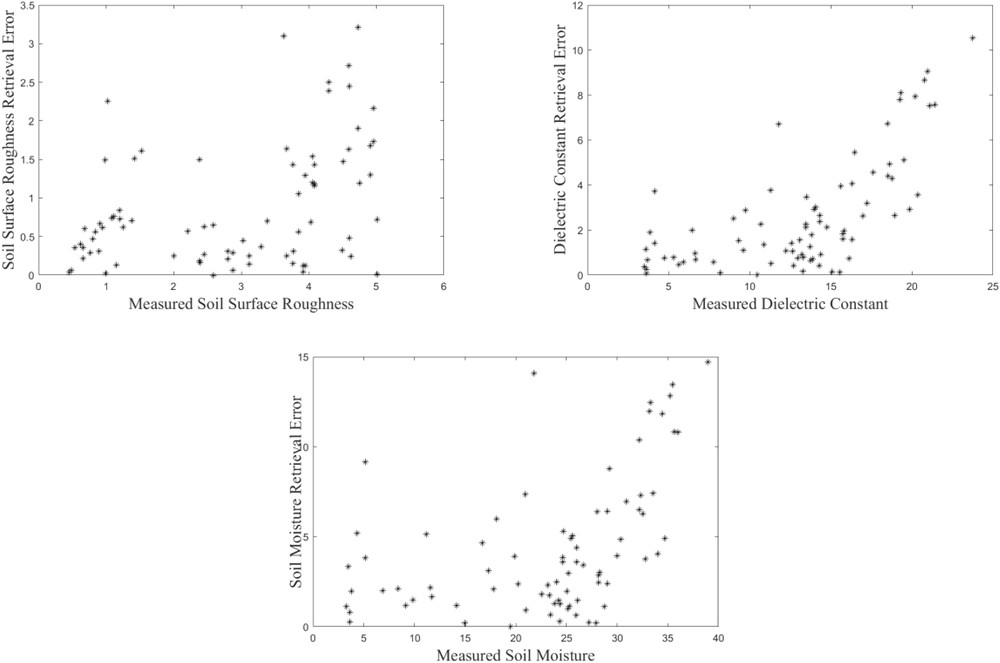
Investigating the relation between measured values of soil surface parameters and retrieval (the GA) errors for all three datasets (Quebec, Ontario, and Oklahoma).
For a more comprehensive performance evaluation of the proposed methodology, we compared our results with alternative available approaches that employed multi-incidence angle (Sahebi and Angles, 2010; Sahebi et al., 2003), multi-incidence angle and multi-polarization (Rao et al., 2014), and multi-frequency and multi-temporal (Zhang et al., 2017) SAR data. It is worth noting that these approaches used an inversion procedure to retrieve soil surface parameters that require multi-configuration SAR data. Table 3 provides the results when using the other approaches. The two latter approaches (Rao et al., 2014; Zhang et al., 2017) have used further assumption to eliminate soil surface roughness from their computations. Zhang et al., (2017) assumed that soil surface roughness is constant during the period of SAR data acquisition. As the result, soil surface roughness was omitted in the inversion approach and, therefore, no retrieval for this soil surface parameter was done. Rao et al., (2014) have used a cross polarization ratio (HV/HH) to retrieve soil surface roughness and then the other soil surface parameter was calculated using the inversion method.
Comparison of the results of the current study with data from works by other scholars carried out with alternative solutions.
| Year | BM | Technique | Soil surface roughness (cm) | Dielectric constant | Soil moisture (%) | ||||
| MAE | RMSE | MAE | RMSE | MAE | R | RMSE | |||
| Sahebi et al. (2003) | MDM | Inversion Multi-angle |
2.49 | 1.39 | 3.5 | 1.25 | – | – | – |
| Sahebi and Angles (2010) | MDM | Inversion Multi-angle |
1.23 | – | 2.46 | – | 3.88 | – | – |
| Rao et al. (2014) | MDM | Multi-angle Multi-polarization |
Correlating root mean square height with polarizations | Cross | – | – | – | 0.87 0.77 |
2.87 3.20 |
| Co | – | – | – | 0.78 0.91 |
4.99 2.60 |
||||
| Zhang et al. (2015) | MDM | Inversion Multi-band |
Assuming constant soil surface roughness during the period of SAR acquisition | – | – | – | 0.84 0.82 |
2.07 2.32 |
|
| Current study | MDM | Optimization GA Single-configuration |
0.87 | 1.17 | 2.63 | 3.64 | 4.89 | 0.84 | 5.76 |
Since the evaluation criteria have been explained earlier, it can be understood from Table 3 that the proposed methodology achieved promising results while only single-configuration SAR data were used. In particular, the proposed methodology retrieved both the dielectric constant of the soil (soil moisture) and soil surface roughness simultaneously without any further assumption (Zhang et al., 2015), or use of any auxiliary procedure (Rao et al., 2014).
5 Conclusion
This study presents an optimization approach using the GA to the retrieval of soil dielectric constant, soil moisture, and soil surface roughness values from single-configuration SAR data. We have used the MDM as the backscattering model for the retrieval of the soil surface parameters. The satisfying correlation coefficients between the retrieved and ground-measured values of the soil surface parameters (R-soil surface roughness = 0.71, R-dielectric constant = 0.79, and R-soil moisture = 0.84) suggest the feasibility of employing the GA. Despite the common inversion methods that require multi-frequency, multi-incidence angle, and multi-polarization SAR data, the optimization approach can be applied to single-configuration SAR data without any further assumption. Besides, the proposed methodology does not share the drawbacks associated with multi-configuration SAR data. We have obtained promising results suggesting the capability of employing the GA to retrieve soil surface parameters simultaneously from a single-configuration SAR data. We believe our approach would be well suited for use by other SAR backscattering models and different frequency SAR data. Our investigations into this area are still in progress.
Acknowledgments
The authors would like to thank SMEX, CARTEL (“Université de Sherbrook”), and Dr. H. McNairn for providing Oklahoma, Quebec, and Ontario datasets. In addition, we appreciate the great works by the anonymous reviewer and by Dr. Isabelle Manighetti, which have definitely raised the quality of this research.