

1 Introduction
Ground deformation monitoring is of upmost importance in various domains of geoscience, including highways built on soft clay (Zhu et al., 2019), city subsidence caused by underground water exploitation (Lu, 2019), international airport affected by human activities around (Gao et al., 2019), long-span bridges connecting two separate places (Zhang et al., 2018) and surface subsidence caused by the extraction of mineral resources (Stephen et al., 2019). China is the world's largest coal producer, with coal production accounting for 42% of the global production. Ninety-six percent of that production is derived from underground coal mining (Dong et al., 2015; Jiang et al., 2011; Liu, 2014). Underground coal mining inevitably causes land subsidence and seriously affects surface conditions. The exploitation of underground mineral resources has produced enormous material wealth, but it has also destroyed the natural environment. Surface subsidence induced by mining causes a series of serious consequences, such as farmland reduction, building collapse, and road damage (Jiang et al., 2009; Strozzi et al., 2003). Therefore, from a safety point of view, it is necessary to monitor surface deformation accurately during mining activities so as to take actions to mitigate subsidence (Liu, 2014).
The data used for measuring the deformation caused by coal mining are generally obtained directly in the field. Traditional measurement methods include leveling and total station measurements (Kuşcu, 1991; Li and Wu, 2005; Maciaszek, 2008; Petr and Blin, 2007; Vrubel and Vetrovsky, 2001). However, these methods have disadvantages, including point preservation difficulties, high work intensity in the field, and low availability of effective data (Ma et al., 2016). Gao et al. (2019) applied RTK-GPS (Real Time Kinematic-GPS) to mining subsidence monitoring. While this method was faster than field measures in terms of working time, it still experienced problems similar to those associated with traditional measurement methods. The accuracy of RTK-GPS is approximately 1–4 cm horizontally and 2–8 cm vertically (Shi and Gao, 2014). The measurement quality is also sensitive to multipath effects (Yi et al., 2011), satellite signal blocking, and weather conditions (Prochniewicz et al., 2017).
Synthetic Aperture Radar (SAR) is also widely used in subsidence monitoring. For instance, Ben et al. (2011) deduced phosphate mine subsidence in southern Atlas of Tunisia through differential SAR image data. Perski (2000) used differential interferometric SAR (D-InSAR) to monitor mining subsidence in the Upper Silesia mines. Ge et al. (2005) used multi-source SAR data to conduct monitoring experiments on coal mining subsidence in southwestern Sydney. However, the amount of deformation detected in each pixel of InSAR is limited, and accurate surface deformation cannot be obtained beyond the critical gradient (Lazechy, 2017). Chen and Zebker (2002) indicated that a phase change between the unit pixel and neighboring pixels that does not exceed 1/4 wavelength could eliminate phase unwrapping, thereby increasing the maximum settlement D-InSAR could monitor. However, the maximum value that can be monitored by different satellite systems is still of a few centimeters to tens of centimeters (at a mining depth of 100 m) (Yao, 2016). It is therefore difficult to monitor large-magnitude deformations related to subsidence.
TLS (Terrestrial Laser Scanning) is a high-precision 3D measurement technology that can allow measuring hundreds to thousands of points per square meter. The technology has been applied in many fields, including geographic modeling, agriculture and vegetation analysis, geological hazard mapping and analysis, and industrial and building modeling (Lague et al., 2013; Lichti, 2007; Tian et al., 2010; Vosselman and Maas, 2010). In recent years, TLS has been applied to monitor stability problems induced by surface or underground mining activities (Walker, 2013). The results show that the method can effectively obtain information on deformation in mining areas (Fanti et al., 2013; Gigli and Casagli, 2011; Viero et al., 2013). However, the point cloud acquired by TLS is located in a local, scanner coordinate system. Therefore, to integrate the TLS measurements into large-scale, long-term deformation monitoring requires a third-party method to calculate the global coordinates of the measurement station. Traverse surveys and leveling are thus used, but those still face the problems of large workloads. Furthermore, static GPS has long measuring times and it is difficult to preserve the measuring points. According to previous studies, its accuracy does not meet the requirements of mine deformation monitoring (Zhou et al., 2014).
In this study, we construct a combined measurement system that synchronously uses 1) TLS to collect point cloud data, and 2) differential GPS data for the retro-reflective target location measurement. The system acquires GPS data during the TLS acquisition without affecting laser-scanning efficiency. The system is described here, and the precision of the data fused from the two methods, TLS and GPS, is analyzed experimentally.
2 Theoretical basis and problem solving
2.1 TLS working principle
The TLS scanner acquires the three-dimensional coordinates of the point cloud representing the surface of an object based on the three-dimensional Cartesian coordinate system. As shown in Fig. 1, the laser is emitted from the origin, lateral scanning occurs along the x-axis, and vertical scanning occurs along the z-axis. The timer records the round trip time between the scanner and the object surface. Using this time, the distance S between the points on the surface of the target object and the scanner can be calculated. The horizontal and vertical angles of the instantaneous laser emitted by the scanner are recorded by the precision clock control encoder in the instrument, and the three-dimensional coordinates of each point can be obtained according to Eq. (2–1), where O represents the origin of the coordinate system and also the center of the sensor, S represents the distance between the surface of the object and the scanner, θ represents the intersection angle between the sector and the plane xOy, represents the intersection angle between the projection of vector on the plane xOy and the x-axis.
| (2–1) |

Principle of the 3D laser-scanning system.
TLS can measure a large amount of point data with millimeter precision in a short time (for example 1-mm resolution depending on the distance between the setting station and the target object, and centimeter-level over long distances, e.g., Van Rentergem et al., 2017).
In the experiment that we describe here, during data acquisition, the step width of angle at horizontal and vertical was set as 0.002°, and the height of the instrument was about 1.65 m. According to the chord length formula (Eq. (2–2)), when S is 60 m, the horizontal and vertical resolution e is about 1.7 mm.
| (2-2) |
2.2 GPS differential positioning principle
Differential GPS is a relative positioning technique employing three (or more) stationary receivers simultaneously tracking the same satellites. Two receivers, the base receivers, are set up over points with precisely known coordinates. Other receivers, the remote receivers, are set up over points with unknown coordinates. After processing, the coordinates of the unknown points are yielded. In China, for instance, the relevant technical regulations for control networks at all levels are specified in “GPS Measurement Specification” (2009). The shortest observation time requirement is longer than 40 min (GBT, 18314-2009).
2.3 Challenges to apply the fusion system, TLS and GPS, in mining deformation monitoring
2.3.1 Data collection efficiency
According to the requirements in Global Positioning System (GPS) Measurement Specification GBT 18314-2009, the observation time of static GPS should be longer than 40 min to obtain the requested precision. Meanwhile, in one TLS scan (for instance with Rigel VZ1000 laser scanner), the time consumption to conducting a full circle scan with a radius of 50 m and a sampling interval of 5 mm at a distance of 70 m is about 30 min. Therefore, if we first use static GPS to obtain the three-dimensional coordinates of the TLS scanner, and then conduct 3D laser scanning, we need about 1.5 h per scan to obtain the scanning data in global coordinates (some time is needed for station setup and move). This time is too long.
2.3.2 Data accuracy
In China, for instance, the point accuracy requirements for deformation monitoring in coal mining areas are , (DZ/T 0287-2015).
The accuracy of the data collected by the TLS is limited by the distance between the scanner and the target object. The nominal point accuracy of the instrument is 5 mm at a scanning distance of 100 m; the static GPS accuracy depends on the acquisition time and the accuracy of an E-level network with an observation time of 40 min. The root mean square error (RMSE) for the planar position can reach 20 mm, and the RMSE for elevation can reach 40 mm.
Therefore, the problem that must be solved is how to combine the scanning data with the E-level GPS network data. Additionally, we must determine whether the post-fusion data accuracy can meet the subsidence monitoring requirements in a coal-mining area.
2.4 Proposition of a new, combined measurement system
To solve the efficiency problem of acquiring data using the two methods, we developed a new, joint measurement device that combines GPS and TLS (Figs. 4 and 5). This device realizes the synchronous acquisition of GPS data and scanning data. The duration for the synchronous acquisition of data was set at 30 min, based on the time consumption required for a single TLS scan. However, GPS data still uses the static positioning method.

TLS + GPS synchronous measurement.

GPS + Retro-reflective joint target.
If the TLS and GPS data are simply fused, they do not reach the requested high precision. We thus developed a data processing method to improve the accuracy of the fused data; the method uses only global GPS coordinate information and relative positional relationship between the points (based on scanning data).
We conducted an experimental field to verify that we obtain high-precision data. Based on this experiment, we could assess the data acquisition and accuracy analysis of the joint positioning system.
3 Establishment of the precision test field
3.1 Determination of the size of the experimental field
According to actual experience in field operations, which are affected by the height of the instrument and the reflectivity of the point cloud, the effective working radius of the on-site TLS scan ought to not exceed 50 m. Therefore, the size of the experimental field is about 100 m. Considering the realities of on-site scanning, the arrangement of the retro-reflective target points satisfies a 360-degree full circle distribution, and the distance between these points and the scanner has a uniform distribution, as shown in Fig. 2.

Point layout in the experimental site.
In Fig. 2, point 00 is fixed as the TLS setting station, and points 01–08 are the retro-reflective targets and GPS setting station. The test points appear to be arranged in a full circle around the frame site, with the farthest distance between the TLS and the station points being 66.58 m, and the nearest being 35.72 m. This layout covers all the situations required for field data collection.
3.2 Required accuracy for controlling points and measurement plan determination
The accuracy required for the control points is determined according to the purpose of the experiment. The present experimental site is set to test the accuracy of the TLS–GPS fusion. Therefore, the accuracy of the control point must be determined from the combined accuracy of TLS and GPS.
3.2.1 Elevation accuracy and measurement method determination
In our experiment, the nominal distance measurement accuracy for the REIGL VZ1000 TLS is 5 mm within 100 m, and the nominal angular resolution is 0.0005°. When the instrument height is 1.7 m, the theoretical error for point elevation measurements at 50 m is 3.63 mm (Zhou, 2017).
In the experiment, we performed leveling measurements using a “RUIDE DL2007” digital level. For this specific instrument, the standard deviation of elevation measurements is 0.7 mm per km. The leveling measurements have an accuracy and an order of magnitude higher than those of the TLS or GPS elevation measurements, which makes them appropriate for comparison with the fused measures.
3.2.2 Determination of plane accuracy and measurement methods
Xu et al. (2016) design related experiments and the distance error of the Rigel VZ-1000 instrument can be calculated as follows, where S represents the distance between the center of the sensor and the surface of the object:
| (3–1) |
The maximal side length of the datum net (Fig. 2) is about 70 m. According to Eq. (3–1), the ranging error of the TLS is about 1.2 mm, the plane accuracy of the static GPS E-level network is 20 mm.
In our experiment, we used a Leica TM30 total station to measure the angle and the distance. The angle measurement error for the TM30 is 0.5″, the accuracy of the distance measurement is 0.6 mm + 1 ppm × L mm (ppm means “part per million” and L is the distance between the center of the instrument and the target). The distance between the data points in the selected area is within approximately 50 m. Therefore, the accuracy of the distance measurement is within 0.65 mm. The accuracy of the plane measurement is an order of magnitude higher than the ones of the TLS or GPS plane measurements, which can be used for inspection purposes. Therefore, plane control measurements were performed using the TM30.
3.3 Control point data acquisition and processing
3.3.1 Level data acquisition and processing
To ensure the accuracy of the datum net, we used the plane of the point No. 00, which is the scanner preset station, as the datum level. The data is as follows.
The total length of the leveling route is 0.435 km. The error of closure is −0.47 mm < 4 × = 2.638 mm, and therefore, the measurement results meet the specifications.
Leveling weighting is determined according to distance. The level of the leveling network is set to the second class, and the closed height difference is 4 × . The elevations of the points after adjustments are shown in Table SM2.
3.3.2 Traverse survey and data processing
The points 01–08 were used as the starting edge of the traverse survey. The 01 coordinate is set as (1000, 1000) and the local coordinate system is established with the 01–08 direction as the positive direction of the x-axis. The TM30 was used to accurately measure the distance of 01–08 six times, and take the average. The reliable distance of the 01–08 side was 47.9526 m.
Edge 01–08 was taken as the starting edge and a traverse survey was conducted. The observed data is shown in Fig. 3, where the red numbers represent the distance between the adjacent points, and the blue numbers represents the angle of the adjacent edges.
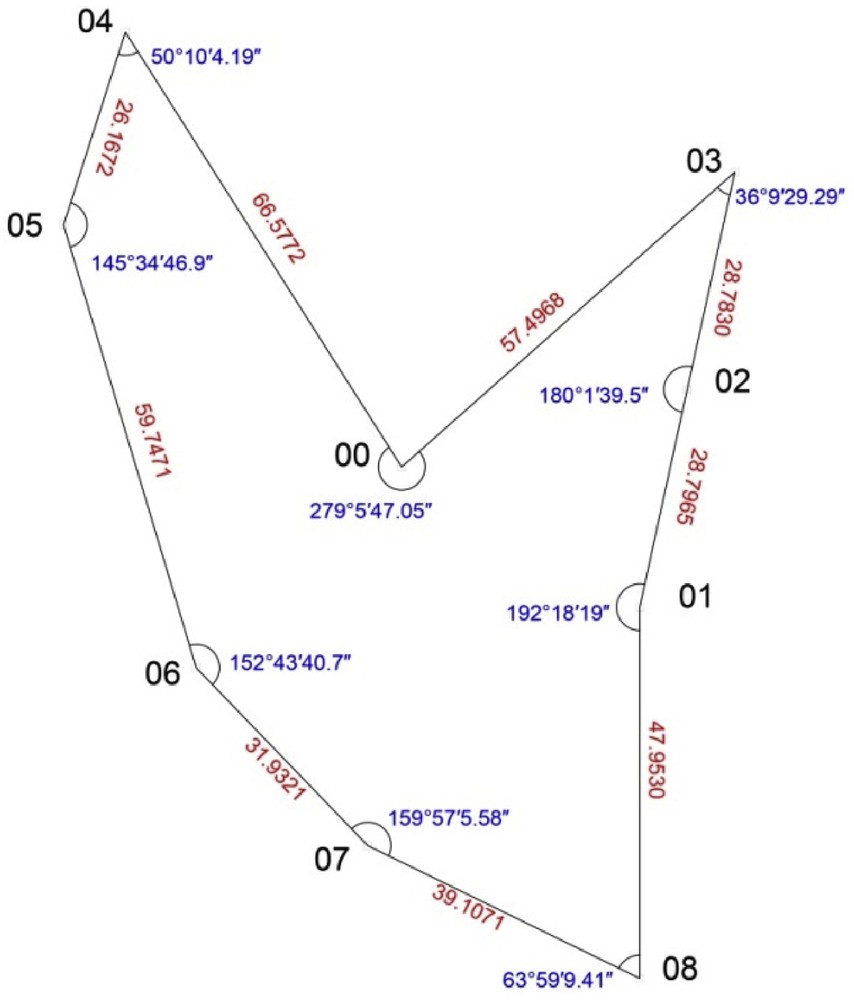
Measured results of traverse survey.
According to the field observation data, the angle closure difference is 1.6″ < 1 × = 3″, meeting the requirements.
The level of the horizontal control network is set in the adjustment parameters of the “Chinese second-class”, which means that the side length of the traverse network should be shorter than 300 m, the mean square error of the angle in the network should be less than ±8″ and the relative mean error of distance should be less than 1/20000 (JGJ/T 408-2017). The standard unit weight error prior to testing is 0.5″. The error distribution is shown in Table SM3.
From the table, the RMSE of all points in the traverse survey are within 4 mm; the RMSE of the weakest point (No. 04) is 3.5 mm. For the points at a distance of 50 m, the theoretical scanning error according to the 3D laser scanner is 3.63 mm (Zhou, 2017), and the GPS plane point error is 20 mm. Therefore, the plane coordinates of the datum points obtained by the traverse survey meet the accuracy check requirements of the fusion data.
4 Acquisition and accuracy analysis of joint positioning experimental data
4.1 Acquisition of experimental data
To realize differential GPS and laser-scanning synchronization, in addition to connecting the GPS receiver to TLS (Fig. 4), a specific GPS retro-reflective target is processed (Fig. 5), and the GPS receiver is connected to the joint target. There is a fixed constant distance of 6.5 cm between the receiver and target center.
When the differential GPS and the laser scanner conduct simultaneous measurements, because of the limitations of field working conditions, points 03, 07, and 08 are blocked or destroyed. The reflective targets and GPS receivers are placed only at the remaining points, and GPS differential measurements and laser scanning are simultaneously performed.
The CHCNAV X91 dual-frequency GPS receiver combined with the Rigel VZ1000 laser scanner were used to acquire data during five time periods, with each period lasting 30 min.
In the five data sets, the GPS data is in WGS84 coordinate system, and the TLS data is in the scanner coordinate system. The data used in the experiment was acquired at different times. During the total time of the experiment, some of the points (#3, 7 and 8) were lost (points were identified with nails, and some of those nails were destroyed by the ongoing construction works); they were thus ignored in the analysis. To realize the unification of the coordinate system, coordinate transformation was performed based on experimental field reference data obtained in § 3.3.2. After subtracting the instrument constant, the five transformed data sets are shown in Tables SM5 to 9.
4.2 Accuracy analysis of measured data
4.2.1 Analysis of raw data error
As presented in Tables SM5 to 9, we obtained the RMSE of GPS data and scan data for each point. The results are shown in Figs. 6 and 7 and in Table SM10.

GPS data error distribution.
TLS data error distribution.
The coordinate data acquired by GPS has an elevation error of up to 20.2 mm and a plane error of up to 22.9 mm. The measurement results are equivalent to the E-level network accuracy index indicated in the specification, which is slightly worse than the E-class network accuracy; this is because the length of the GPS data acquisition period for this experiment was 30 min.
As can be seen from Fig. 7 and Table SM10, the maximum RMSE in the elevation of the scanning data is 1.5 mm and the maximum RMSE in the plane is 1.2 mm, which are better than the theoretical calculation results. The measured accuracy of the instrument is thus better than the nominal accuracy.
4.2.2 Data fusion and error analysis
- (1) Data fusion
The measured scanning data points are much more accurate than the GPS data (Table SM10); however, the 3D laser-scanning data cannot obtain global coordinate information. To utilize the global coordinate information of the GPS data, data fusion must be performed. The fusion method uses location information from the GPS and information regarding the relative positional relationships between points from the scanning data.
The iterative closest point (ICP) was adopted to fuse the GPS and TLS data acquired in section 4.1. The original ICP algorithm is based on the least-square optimal matching principle, which iteratively processes the rigid transformation (Besl and Mckay, 1992). This algorithm only requires a procedure to find the closest point on a geometric entity on a given point and always converges monotonically to the local minimum of a mean-square distance metric. The detailed introduction of the algorithm is presented in Appendix A (Supplementary Material).
The data processing flow is as follows: ① the ICP algorithm is used to register the TLS data with the GPS data based on the GPS data for each period; ② the GPS data is replaced with the registered TLS data as the global coordinates.
- (2) Error analysis of the fused data
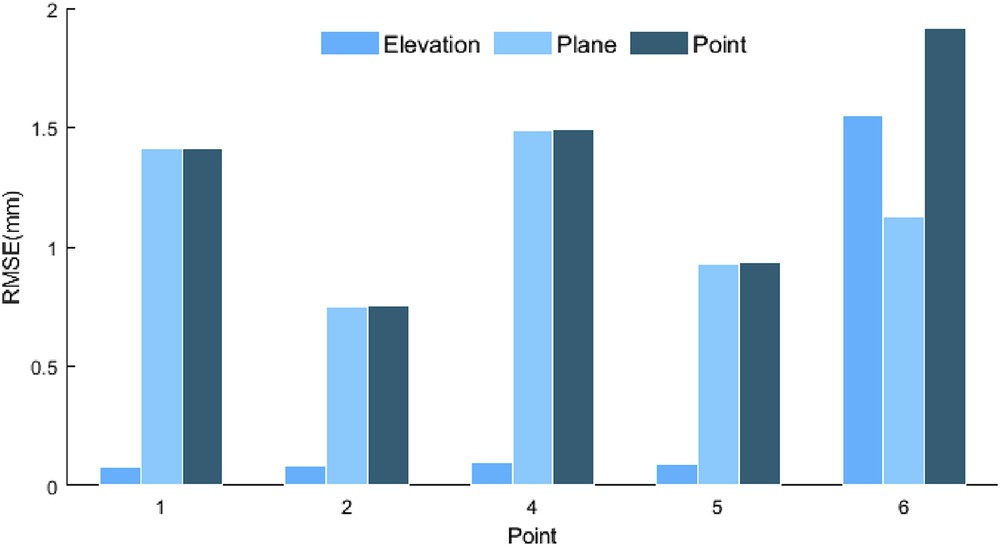
In the data for each period, the relative positional relationship between points is based on the scanning data, and the position matching and replacement are performed with GPS data according to the least squares method in the registration process. The coordinates of the fused data points for each period are shown in Tables SM11–15, and the RMSE distribution is shown in Fig. 8 and Table SM16.

Fusion data RMSE distribution.
The fusion data has significantly better plane accuracy stability and position accuracy than the GPS data. The maximum plane RMSE is 2.0 mm, and the elevation RMSE is at most 2.1 mm. Therefore, the plane and point accuracy both reach the level of the millimeter. Compared with the precision index in Chinese Coal Mine Measurement Regulations, the accuracy meets subsidence monitoring requirements.
Therefore, through the presented experiment, we determined that a full-circle 3D laser scan with radius less than 60 m, combined with a short-baseline static GPS measurement whose measurement time is not less than 30 min can produce point cloud data with very accurate global positioning. The data accuracy can actually satisfy coal mining subsidence monitoring requirements.
5 Application
We here apply the new combined instrument to a specific problem.
A middle school teaching building with a L-shaped structure is located in a planned mining-affected area in Jining City, Shandong Province. To evaluate the impact of mining on the teaching building, we used the method developed in this study to acquire the point cloud data of the teaching building under the global coordinate system. This data will serve as a reference to measure the deformation of the building once the coal mining has started.
To acquire data, seven joint targets were arranged for simultaneous GPS and 3D laser-scanning measurements. The layout of the points is shown in Fig. 9. To ensure the accuracy of the basic data, duplicate measurements were taken. The data obtained by merging the GPS coordinates and the laser-scanning data for the two periods are presented in Table SM17. The point cloud data for the teaching building obtained in the first period is shown in Fig. 10.
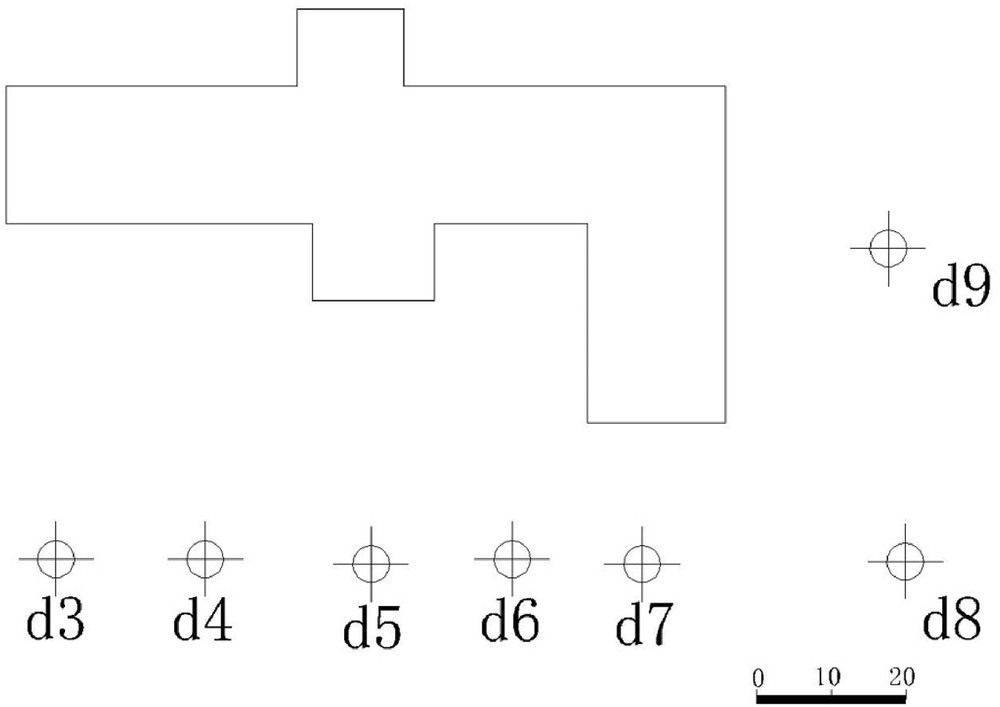
Joint measurement target layout.
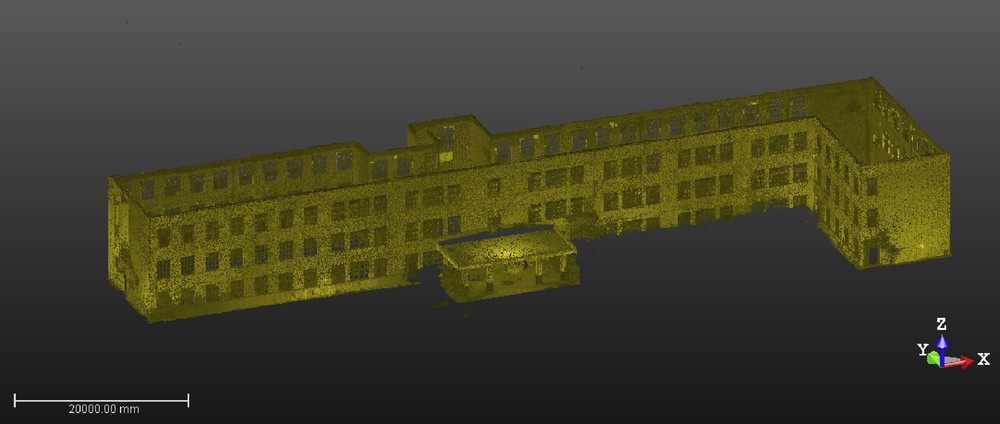
Research object point cloud.
The maximum elevation difference for the two period points is 6 mm, and the maximum plane position difference is 4.9 mm, indicating that data accuracy is equal to that of the experimental results, and meets the accuracy requirements for coal mine measurement regulations. As a result, the data acquired through the method developed in this article is reliable, and the method can be used to monitor subsidence caused by mining activities.
It is difficult to determine global coordinates when laser scanning is applied to large-scale deformation monitoring. To address this problem, we carried out an experimental study using fusion data from terrestrial laser scanning and GPS. A three-dimensional laser-scanning and GPS data acquisition device was developed, and a high-precision experimental field was established. Five experimental data sets were acquired over 30-min sampling periods, and GPS and scanning data were fused using ICP. The experimental results show that the RMSE values for the elevation, plane, and points of the fusion data achieved millimeter-level precision. Our new method thus looks robust.
6 Conclusion
We have built a joint measurement device that combines GPS and terrestrial laser scanning to realize the synchronous acquisition of GPS data and scanning data of points that are then collocated in a global coordinate system. With the new device, the time spent in data acquisition is shortened compared to acquisitions with GPS or TLS separately. We used the device in an experimental site. The GPS and TLS data were fused with an original iterative closest point (ICP) algorithm. The accuracy of the fused data reached the level of the millimeter. The data obtained with our device are thus much more accurate than those acquired with standard GPS. This allows using them to measure small deformations, such as those occurring in coal mining areas. The joint device developed in this article should thus be useful to many domains concerned with small deformations of the Earth surface.
Acknowledgments
The authors gratefully acknowledge the financial support from the National Natural Science Foundation of China (NSFC) (Grants No. 51504239, 51604266). They thank the two reviewers S. Dominguez and C. Crosby, and the Associate Editor I. Manighetti, whose comments helped improve the manuscript.