

1 Introduction
The quantification of magmatic processes represents a long-term endeavor in Earth Sciences. Nowadays, determining magmatic variables such as temperature, pressure, melt water concentration, and oxygen fugacity increasingly makes use of crystallization softwares such as MELTS (Ghiorso and Sack, 1995) or COMAGMAT (Ariskin et al., 1993). These pieces of software, based on thermodynamic models for multicomponent melts and crystalline phases, have become quite popular and are mostly applied to compositions for which experimental data are non-existent. However, it is also interesting to test these pieces of software against new experimental data, when they become available. This coming and going between experiments and models allows identification of potential problems and ultimately ensures the development and the extension of crystallization softwares.
One system of major importance and for which critical experimental data are still missing is the granite system. Following pioneering studies (Luth et al., 1964; Steiner et al., 1975; Tuttle and Bowen, 1958; Whitney, 1975), the granite system has continued to be investigated during the 1980s (e.g., Manning, 1981; Pichavant, 1987) and 90s (e.g., Becker et al., 1998; Holtz et al., 1992; Kirschen and Pichavant, 2001; Pichavant et al., 1992). Yet, the effect of key components still awaits to be worked out. This is the case especially for the anorthite (An) component which, for silicic magmas such as granites and rhyolites, is the fourth most important component after quartz (Qz), albite (Ab) and K-feldspar (Or). In this paper, original near-liquidus equilibrium data on the effect of An in the granite system (Weber, 1985) are presented. The experimental results are compared with calculations using both empirical (Blundy and Cashman, 2001; Wilke et al., 2017) and thermodynamic (Gualda et al., 2012; Holland and Powell, 2001) models for silicic magmas. The comparison provides a test of the performance of equilibrium crystallization softwares for granites and rhyolites.
2 Previous work
Among previous experimental studies in the haplogranite system, only one has examined the influence of the An component on phase relations. James and Hamilton (1969) determined crystal–melt equilibria for 3, 5, 7.5, and 10 wt% An added to the Qz–Ab–Or-H2O system under H2O-saturated conditions at 100 MPa. During the 80s, the melting relations of plagioclase feldspars in simple systems attracted considerable interest (Johannes, 1980, 1984; Weber, 1985). Yet, systematic investigations on the influence of An on phase equilibria have been performed only recently (Wilke et al., 2015, 2017). It should be pointed out here that, to fully describe the phase relations in the quinary Qz–Ab–Or–An–H2O system, the effect of no less than three parameters (An content, pressure, melt H2O content) must be specified (in addition to the effects of Qz, Ab and Or components previously investigated by Luth et al., 1964 and Tuttle and Bowen, 1958). Therefore, the number of experiments to be carried out is very large and this legitimates the use of thermodynamic models to interpolate and possibly extrapolate the data and reduce the experimental workload.
The two most recent studies cited above (Wilke et al., 2015, 2017) have investigated compositions chemically more complex than the quinary Qz–Ab–Or–An–H2O system, containing small amounts of FeOt (1–2.5 wt%) and TiO2 (0.2–0.4 wt%). H2O-undersaturated conditions were also imposed (Wilke et al., 2015, 2017). Therefore, reference experimental data are still missing for the “simple” Qz–Ab–Or–An–H2O system. For this system, crystal–liquid equilibria were investigated under H2O-saturated conditions at 300 MPa by Weber (1985). However, the results of that study have remained unpublished. Given (1) the exceptional importance of the Qz–Ab–Or–An–H2O system, (2) the present lack of experimental data, and (3) the need to continuously develop and improve thermodynamic models for granites and rhyolites, the detailed presentation of the Weber (1985) results seems warranted and is the subject of this paper.
3 Experimental and analytical methods
3.1 Starting materials and charges
Fourteen glasses with precisely 5 wt% An and various Qz/Ab/Or proportions were made from gels prepared using classical methods (e.g., Pichavant, 1987). Therefore, only the 5 wt% An plane of the Qz–Ab–Or–An tetrahedron (see James and Hamilton, 1969; Wilke et al., 2015) was investigated. Tetraethyl orthosilicate was used as the source of Si, Al nitrate for Al and carbonates for Na, K and Ca. After drying, the gels were melted at 1500 °C, 1 atm in welded Pt capsules during 3–8 h. Two cycles of melting with grinding in between yielded chemically homogeneous glasses, which were analyzed by electron microprobe (Table s1).
Experimental charges were made up of 90 wt% of silicate material (in the form of glass ground to about 50 μm) plus 10 wt% doubly distilled deionized water. Although H2O solubilities in Qz–Ab–Or–An melts have not been systematically investigated, an addition of 5 wt% An should not appreciably modify the H2O solubilities determined in the Qz–Ab–Or system (see Benne and Behrens, 2003). At 300 MPa in Qz–Ab–Or melts, H2O solubilities are <8 wt% (Johannes and Holtz, 1996) and, consequently, addition of 10 wt% H2O ensures that all charges in this study are H2O-saturated. Experimental charges were loaded indifferently in either Au or Pt capsules (20 × 2.5 mm, thickness 0.2 mm), which were closed by arc welding.
3.2 Equipment
The experiments were all performed at CRPG, Vandœuvre-lès-Nancy, France, using René 41 cold-seal pressure vessels working horizontally with either H2O or Ar as the pressure medium. For each vessel–furnace pair and pressure medium, the hot-spot zone was determined under pressure with an internal sheathed dual type-K thermocouple, previously calibrated against the melting point of NaCl. With the vessel in optimum position inside the furnace, the temperature (T) gradient along 25 mm ranged from 2.5 to 5.5 °C depending on temperature. Under running conditions, temperatures were measured by an external sheathed type-K thermocouple also calibrated against NaCl, and recorded permanently. External thermocouple readings were corrected against the internal thermocouple, with maximum corrections of 5 °C. Daily temperature fluctuations were <2 °C. Overall, the maximum error on temperature is ±10 °C. Pressure (P) was measured with a Heise Bourdon tube gauge with an uncertainty of ±2 MPa. Several capsules tied together were often loaded in the same bomb to allow comparison of results for different melt compositions. About 3 h were necessary to reach steady P–T conditions and charges were quenched under pressure by removing the bomb out of the furnace (quenching time between 15 and 45 min).
3.3 P-T paths and types of experiments
Both forward and reversal experiments were performed for each glass composition. Forward runs were conducted by bringing the charge directly at the desired temperature and pressure (300 MPa) and keeping it steady for durations ranging for 70–242 h, depending on temperature. For a given composition, forward runs were repeated at decreasing temperatures until crystalline phases appeared in run products. A limited number of experiments were also performed at temperatures below the liquidus to crystallize cotectic (feldspar plus quartz) and eutectic (2 feldspars plus quartz) phase assemblages. Reversals consisted in two-stage runs (e.g., Pichavant, 1987). In the first stage (48–167 h), temperature was kept at a value known (from forward runs) to produce partial crystallization. Then, temperature was increased isobarically to the final (second stage) value and kept for 73–313 h, depending on temperature.
3.4 Analytical techniques
After checks for leaks by weighting, the capsules were opened and run products recovered. Solid materials were slightly crushed and mounted in thin section under refractive index oil for petrographic examinations. Initially (in 1985), the appearance of crystals was detected optically and XRD techniques were used to distinguish between alkali feldspar and plagioclase. Later (in 2018), selected charges were examined by scanning electron microscopy (SEM) to confirm the optical identification of phase assemblages and characterize the crystal textures. A Zeiss Merlin Compact electron microscope (ISTO, Orléans) operated at 15 kV acceleration voltage was used.
Glasses (both starting and experimental glasses) and experimental feldspars were initially (in 1985) all analyzed with the Camebax electron microprobe of the University of Nancy-1. The analytical conditions were: acceleration voltage, 15 kV; sample current, 6–8 nA; counting time on peak, 6 s. Silicate crystals were used as standards and the data corrected with ZAF procedures. To minimize the migration of Na and K during glass analysis, the beam was defocused to a size of ~10 μm. For crystals, a conventional beam size (1–2 μm) was used. Multiple analyses were averaged, a minimum of 10 for the starting glasses and of around 5 for the experimental glasses. For feldspars, we tried to analyze at least 5 crystals per charge, but this was not always possible because of limited feldspar proportions and sizes.
Later (in 2018), critical charges from starting glass compositions 0 and 13 were re-analyzed to confirm compositions of experimental glasses and complete the analysis of experimental feldspars. The analyses were performed on the Cameca SX Five (ISTO, Orléans) operated under an acceleration voltage of 15 kV, with a sample current of 6 nA and a counting time on peak of 10 s. Glasses were analysed with a beam size of ~15 μm and Na2O and K2O concentrations were corrected upwards using the procedure of Pichavant (1987). Correction factors were determined to be +10% for Na2O and 0% for K2O.
Phase proportions in selected experimental charges were calculated by using a least-squares mass balance routine computed after Albarède (1995), using electron microprobe compositions of starting glasses and of coexisting experimental glasses and feldspars. The regression was based on all the five major oxides, H2O being excluded.
4 Experimental results
4.1 General
Experimental conditions and results are summarized in Table 1. A total of 51 charges are considered. Phases encountered include quartz (Qz), alkali feldspar (Af) and plagioclase (Pl), in addition to glass (L) in all charges. Quartz forms small bipyramids, often aggregated, and mostly <5 μm across. Alkali feldspars and plagioclases appear as small euhedral platelets, rarely >10 μm in width and optically undistinguishable from each other. The silicate melt always quenched to a fluid inclusion-rich glass. SEM observations show that crystals are distributed homogeneously in experimental charges.
Conditions and results of the near-liquidus H2O-saturated 300 MPa experiments.
| Glass | Temperature (°C) | Duration (hours) | Results | Proportions L/Qz/Pl/Af | TL (°C) Forward |
TL (°C) Reversal |
| 0 | 735 | 168 | L | 100 | 722–735 | 725–739 |
| 722 | 168 | L, Pl (An30) | 99/0/1/0 | |||
| 675 | 93 | L, Pl (An24) | 93/0/7/0 | |||
| 665 | 72 | L, Pl (An18), Qz | 89/tr/11/0 | |||
| 716 →725 | 167 →313 | L, Pl | ||||
| 722 →739 | 167 →313 | L | ||||
| 2 | 736 | 100 | L, (Qz) | 728–736 | −737 | |
| 728 | 147 | L, Qz | ||||
| 715 →737 | 98 →169 | L | ||||
| 5 | 720 | 100 | L, (Qz) | 714–720 | 717–730 | |
| 714 | 242 | L, Qz | ||||
| 704 | 139 | L, Qz | ||||
| 684 →703 | 77 →99 | L, Qz | ||||
| 698 →717 | 98 →169 | L, (Qz) | ||||
| 710 →730 | 49 →89 | L | ||||
| 6 | 715 | 100 | L | 705–715 | −716 | |
| 705 | 112 | L, Qz | ||||
| 705 →716 | 108 →188 | L | ||||
| 7 | 707 | 112 | L | 690–707 | −708 | |
| 690 | 93 | L, Qz | ||||
| 689 →708 | 79 →98 | L | ||||
| 8 | 707 | 112 | L, (Qz) | 690–707 | 706–715 | |
| 690 | 93 | L, Qz | ||||
| 690 →706 | 48 →78 | L, (Qz) | ||||
| 700 →715 | 79 →98 | L | ||||
| 9 | 715 | 112 | L | 699–715 | 696– | |
| 699 | 93 | L, (Qz) | ||||
| 677 | 95 | L, Qz | ||||
| 678 →696 | 48 →78 | L, (Qz) | ||||
| 10 | 735 | 70 | L, (Qz) | 735– | 735– | |
| 715 | 112 | L, Qz | ||||
| 715 →735 | 72 → 82 | L, (Qz) | ||||
| 11 | 720 | 70 | L, (Qz) | 720– | −735 | |
| 705 | 112 | L, Qz | ||||
| 699 | 93 | L, Qz | ||||
| 715 →735 | 72 →82 | L | ||||
| 13 | 704 | 103 | L | 100 | 685–704 | −704 |
| 685 | 139 | L, (Af) | 100 | |||
| 675 | 93 | L, Af (Or74), Pl (An29) | 100/0/tr/tr | |||
| 664 | 72 | L, Af (Or71), Qz, Pl (An18) | 98/tr/1/1 | |||
| 684 →704 | 49 →89 | L | ||||
| 14 | 704 | 103 | L | 100 | 685–704 | −704 |
| 685 | 139 | L, Af (Or87) | 92/0/0/8 | |||
| 685 →704 | 49 →89 | L, (Af) | 100/0 | |||
| 15 | 736 | 139 | L | 100 | 716–736 | −735 |
| 716 | 103 | L, Af (Or93) | 96/0/0/4 | |||
| 715 →735 | 49 →73 | L | 100 | |||
| 16 | 750 | 75 | L | 100 | 736–750 | −750 |
| 736 | 139 | L, (Af) | 100/0 | |||
| 716 | 103 | L, Af (Or97) | 82/0/0/18 | |||
| 730 →750 | 49 →73 | L | 100 |
For a given melt composition, liquidus temperatures were approached both from “above” (i.e. using a crystal-free starting product as in the forward experiments) and from “below” (i.e. using a crystal-bearing starting product as in the reversal experiments). Constraints on liquidus temperature are available from both types of experiments, as specified in Table 1. In the forward experiments, the liquidus temperature is located between a charge that yielded only glass and another with crystals present. For most compositions, liquidus temperature brackets are 10–20 °C and exceptionally <10 °C. Only half brackets (lower bounds) are available for compositions 10 and 11, but only trace amounts of Qz are present in each of the two highest temperature charges, suggesting that liquidus temperatures are closely approached (Table 1). In the reversal experiments, the liquidus temperature is located between a charge with crystals still present (either growing or dissolving) and another with only glass. For most compositions, only half brackets are available, either upper (2, 6, 7, 11, 13, 14, 15, 16) or, more rarely, lower (9, 10) bounds (Table 1). Three compositions (0, 5, 8) have their liquidus bracketed from reversals and only one (#0) was bracketed both by reversal and forward experiments. However, the important point is that, for all glass compositions, liquidus temperature brackets and half brackets in forward and reversal experiments overlap. This demonstrates general agreement between the two types of experiments, a strong indication for a close attainment of equilibrium. This further indicates that crystal nucleation was relatively easy. Our experimental charges contain no detectable signs for nucleation delay/difficulty and melt supercooling (e.g., Wilke et al., 2017).
4.2 Liquidus phase relations
The liquidus phase relations are represented in Fig. 1, which is a projection of crystal–liquid equilibria for 5 wt% An added to the quaternary Qz–Ab–Or–H2O system (see James and Hamilton, 1969, and Wilke et al., 2015, for details about the geometry of the quinary system). Three primary phases (Qz, Af, Pl) appear on the liquidus. Most starting glass compositions (8 on a total of 13 because composition 12 was not investigated) crystallized Qz as the primary phase, 4 Af and 1 Pl. The nature of feldspars, either Pl or Af, as determined initially (in 1985), was later (in 2018) confirmed using SEM and additional electron microprobe analyses. The position of the three cotectic curves is constrained directly from the primary phase fields and refined with conjugation lines, 3-phase triangles and 4-phase volume drawn from experimental compositions (glasses and feldspars). It is important to point out that not all phases belong to the 5 wt% An plane of the quinary system and, so, to be plotted, the compositional data must be projected (Fig. 1). For example, experimental Pl have normative An much higher than 5 wt%, whereas Af are very CaO-poor. As a consequence, melts crystallizing Pl as the primary phase (e.g., composition 0) tend to become depleted in normative An when compared to their respective starting glasses whereas the opposite is true for melts crystallizing primary Af (e.g., compositions 13, 14, 15, 16) or Qz (e.g., compositions 2, 5, 6, 7, 8, 9, 10, 11).
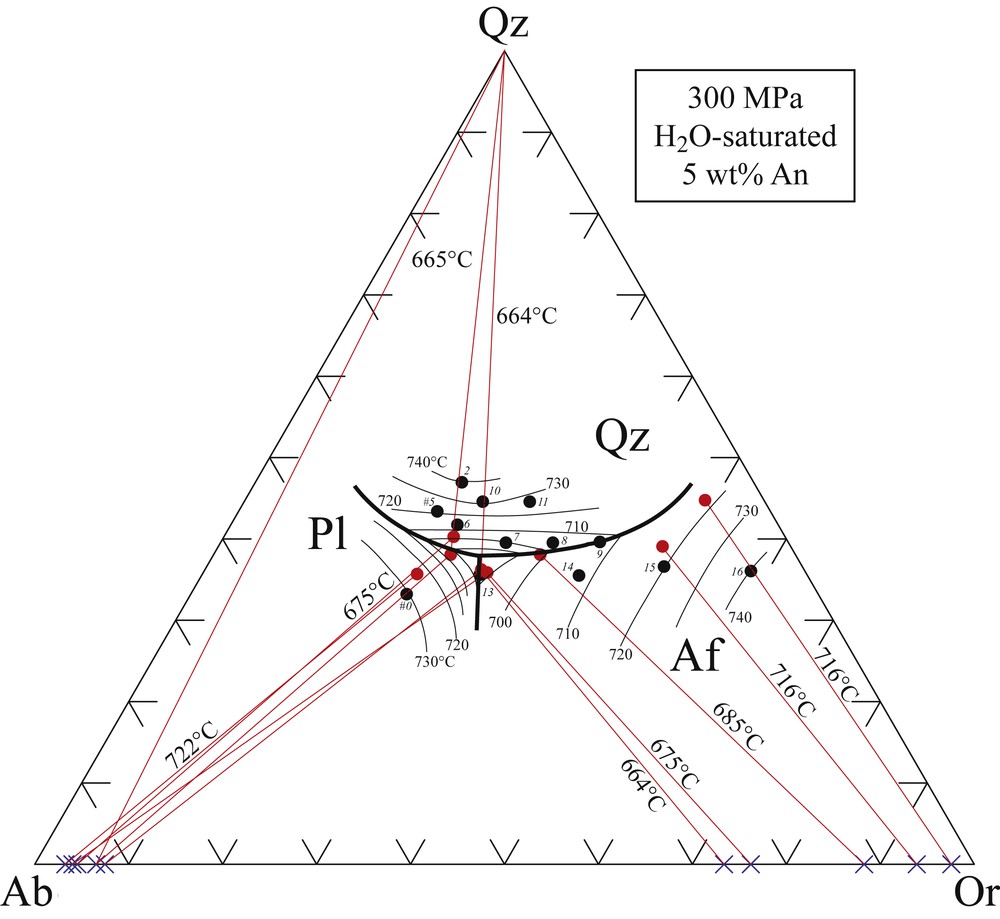
Liquidus phase diagram (concentrations in wt%) for the Qz–Ab–Or system with 5 wt% added An at 300 MPa under H2O-saturated conditions. Black dots: compositions of starting glasses, labelled with numbers referring to Table s1; red dots: compositions of experimental glasses coexisting with feldspars; blue crosses: compositions of experimental feldspars. All compositional data are projected (see text). Black solid curves: isotherms on the liquidus surface labeled with temperature in °C. Red straight lines: conjugation lines, three-phase triangles and 4-phase volume connecting quartz, feldspar and experimental glass compositions, with experimental temperatures indicated in °C. The three bold solid lines are univariant curves separating the primary fields of quartz (Qz), plagioclase (Pl) and alkali feldspars (Af). The piercing point is at the intersection between these three curves. See text for the termination of the Pl–Af univariant curve. Masquer
Liquidus phase diagram (concentrations in wt%) for the Qz–Ab–Or system with 5 wt% added An at 300 MPa under H2O-saturated conditions. Black dots: compositions of starting glasses, labelled with numbers referring to Table s1; red dots: compositions of experimental glasses coexisting ... Lire la suite
Isotherms on the liquidus surface, drawn at 10 °C intervals, were constructed from liquidus temperature constraints determined for each glass composition (Table 1). Although tightly constrained in the Qz and Af primary fields, they are more loosely defined in the Pl field because only one composition plots in that field. The isotherms also tend to be flatter in the Af than in the two other fields. Temperatures indicated by ends of conjugation lines, three-phase triangles and four-phase volume (defined by experimental glass compositions, Fig. 1) are in reasonable agreement with temperatures on the liquidus surface (defined by liquidus temperature data, Table 1). This implies a near-equilibrium proportion of crystals in the subliquidus charges.
The location of the eutectic or, more correctly, of the “piercing point” for 5 wt% An according to the geometrical analysis of the quinary system (James and Hamilton, 1969), is tightly defined from cotectic curves, isotherms on the liquidus surface and experimental results on compositions 0 and 13 (Table 1). These two compositions were crystallized at progressively lower temperatures under the liquidus to constrain the composition and the temperature of the eutectic. For composition 0 at 722 °C, a divariant Pl–L assemblage is obtained. Upon decreasing temperature, the proportion of plagioclase increases from 1 wt% at 722 °C to 7 wt% at 675 °C (Table 1). Qz appears at 665 °C and the liquid composition defines a point on the Pl–Qz cotectic univariant curve, the 3-phase triangle pointing toward the Or apex (Fig. 1). In that charge, Qz is present in amounts <1 wt% (together with 11 wt% Pl, Table 1) and Af was carefully looked for but not found. Including Af in the mass balance calculations generates negative Qz and Af proportions suggesting that Af is actually absent at 665 °C. Composition 13 has Af as the liquidus phase at 685 °C and is joined by Pl at 675 °C and, so the liquid composition defines a point on the Af–Pl cotectic univariant curve, the 3-phase triangle pointing toward the Qz apex. Qz appears at 664 °C (Table 1) so that the melt composition in that charge defines the position of the eutectic point (invariant 4-phase Pl–Qz–Af–L volume). Proportions of crystals in charges 13 at 675 and 664 °C remain very low (Table 1) and residual liquid compositions stay very close to each other, consistent with starting glass 13 having a near-eutectic composition. These results constrain the 300 MPa, H2O-saturated 5 wt% An piercing point to be located at 39 wt% Qz, 33 wt% Ab and 28% Or (Fig. 1). A temperature of 665 (±10 °C) is determined for this piercing point, despite Af is missing in the 665 °C composition 0 charge. Two-feldspar thermobarometric calculations (Wen and Nekvasil, 1994) on composition 13 yield 675 °C for both the 675 °C and the 664 °C charges, in good agreement with experimental results. A temperature of 665 °C for the eutectic point is consistent with experimental solidus determinations performed in the quinary Qz–Ab–Or–An–H2O system (Weber, 1985), which yielded 662–666 °C for the beginning of melting of a Qz–Af (Or67)–Pl (An14) mineral mixture (which corresponds approximately to ~5 wt% An) at 300 MPa under H2O-saturated conditions.
Three univariant curves (Qz–Pl, Qz–Af, Pl–Af) emanate from the piercing point (Fig. 1). Our experimental data and previous results indicate that both the Qz–Pl and Qz–Af curves extend up to their respective binary systems. However, there is uncertainty on the extension of the Pl–Af curve in the ternary diagram. Our results with composition 13 demonstrate that two feldspars crystallize at equilibrium with liquid and, therefore, the Pl–Af curve extends to at least 30 wt% normative Qz in the ternary diagram (Fig. 1). Yet, there is no requirement that two feldspars (instead of one feldspar solid solution) continue to be stable with liquid in Qz-poor (Qz < 30 wt%) haplogranodioritic melts with 5 wt% An at 300 MPa under H2O-saturated conditions (see Boettcher, 1980; James and Hamilton, 1969; Luth, 1976; Stewart and Roseboom, 1962; Yoder et al., 1957). Therefore, the Pl–Af univariant curve has been arbitrarily terminated at 30 wt% normative Qz (Fig. 1).
4.3 Experimental compositions
Experimental glass and feldspar compositions are detailed in Tables s2 and s3, respectively. Electron microprobe analyses of experimental glasses reveal high summation deficiencies (Table s2), consistent with elevated dissolved H2O concentrations, most probably in the ~8 wt% range. For all glasses but one (the Pl-bearing charge 0 with An = 3.9 wt%), An contents are kept within ±1% absolute of the targeted 5 wt% An, being either lower or higher depending on the feldspar crystallizing at equilibrium, Pl and Af, respectively. Experimental glasses are all slightly corundum (Co) normative (Table s2). However, the Co of experimental glasses show no significant increase compared to starting glasses (Table s1) indicating that Na and K concentrations have been correctly measured in these hydrous glasses. Most feldspar analyses show satisfactory totals and structural formulae (Table s3). However, Af in charge 13 at 675 °C has total cations in alkali site <1 and Pl in charge 13 at 664 °C has a low analytical total. The Pl An content generally decreases with decreasing temperature, from An30 (722 °C), An24 (675 °C) to An18 (665 °C) for charges of composition 0. In composition 13, the same trend is observed from An29 (675 °C) to An18 (664 °C), in excellent agreement with the charge for composition 0 at the same temperature (An19). The Or content in Pl ranges from 2 to ~6% (Table s3; Fig. 1). Af compositions are between Or71 and Or97, their Or content increasing with the Or/Ab proportion of the equilibrium glass (Table s2, s3).
For compositions 0 and 13 (see above) as well as for other compositions crystallizing primary Af, mass balance conditions between reactants and products were found to be satisfied (Table 1). Af, starting glasses and experimental glass compositions are approximately colinear (Fig. 1). For compositions 14 (685 °C), 15 (716 °C), and 16 (716 °C), Af proportions are 6.8, 2.6 and 17.5%, respectively. The success of the mass balance calculations (sums of residuals < 0.3, crystal proportions for a given composition progressively increasing when lowering T) confirms the validity of the analytical data and strengthens further the consistency of the experiments.
4.4 Plagioclase-liquid partitioning
Plagioclase-liquid Ca–Na distribution coefficients [Kd = (Ca/Na)Plag/(Ca/Na)liquid] derived from this study are shown in Fig. 2. The data points define a strong dependence with temperature, Kd decreasing significantly from 722 to 664 °C. The influence of the melt H2O concentration on plagioclase–liquid Ca–Na partitioning appears clearly when comparison is made between this study (
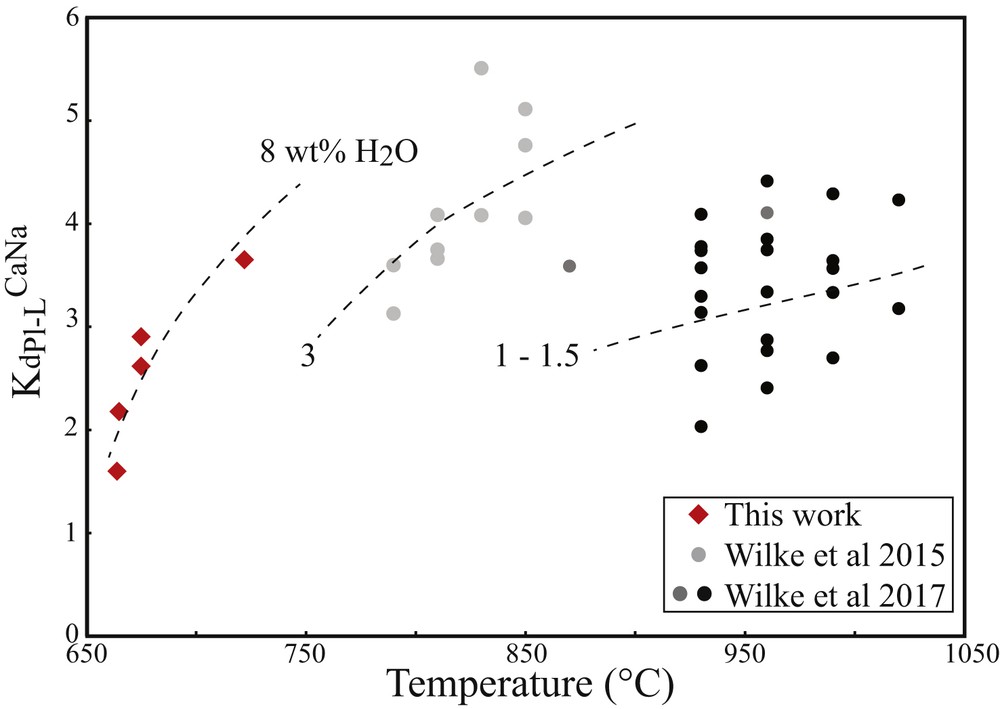
Ca–Na plagioclase–liquid partition coefficient (Kd Pl–LCa–Na = (Ca/Na)Plag/(Ca/Na)liquid)) plotted as a function of temperature for compositions in the Qz–Ab–Or–An–H2O system. Data at < 750 °C and for ~8 wt% H2O in the melt are from this study (5 wt% An, red symbols). The data from Wilke et al. (2015, 2017) are for higher temperatures and lower H2O concentrations, and melt compositions contain small amounts of FeOt (1–2.5 wt%) and TiO2 (0.2–0.4 wt%). The Wilke et al. (2015) data are for 3.5 wt% An (light grey) and the Wilke et al. (2017) data are for 3.5 (medium grey) and 7 wt% An (black symbols). Notice the strong influence of temperature and melt H2O concentration on Kd Pl–LCa–Na and the interplay between these two variables. Masquer
Ca–Na plagioclase–liquid partition coefficient (Kd Pl–LCa–Na = (Ca/Na)Plag/(Ca/Na)liquid)) plotted as a function of temperature for compositions in the Qz–Ab–Or–An–H2O system. Data at < 750 °C and for ~8 wt% H2O in the melt are from this study (5 wt% An, red symbols). ... Lire la suite
5 Discussion
5.1 Effect of An on phase relations in the granite system
Compositions of minimum and eutectic points in the Qz–Ab–Or–An system, as projected in the Qz–Ab–Or system, are summarized in Table 2 and shown in Fig. 3. Since the discussion below is centered on the H2O-saturated haplogranodiorite (Qz–Ab–Or–An) and related systems, only one An-bearing minimum point at 200 MPa (Wilke et al., 2015) has been plotted in Fig. 3 because melts from that study are H2O-undersaturated and contain small amounts of FeOt (1–2.5 wt%) and TiO2 (0.2–0.4 wt%). Data at the different pressures (100, 200, and 300 MPa) clearly define a systematic shift of minimum and eutectic points away from the Ab apex and toward the Qz–Or sideline as the melt An content is increased. During this evolution, the Pl primary volume expands and both the Af and Qz primary volumes shrink, the Af more than the Qz. Previous studies (Becker et al., 1998; Holtz et al., 1992; Pichavant, 1987; Pichavant et al., 1992) have clarified the respective individual influences of pressure and melt H2O concentration on minimum liquidus points, as shown by vectors in Fig. 3. The influence of the An component (also represented in Fig. 3) can be deciphered from the data at 100 (James and Hamilton, 1969) and at 300 MPa (this study). Although the results at 200 MPa combine the influences of An, melt H2O content, and the presence of FeOt and TiO2, the data demonstrate an effect of An consistent with that found at the two other pressures on FeOt- and TiO2-free melts. Examination of the dataset for the FeOt- and TiO2-bearing rhyolitic liquids at 200, 500 MPa and for various melt H2O concentrations (Wilke et al., 2015, 2017) shows that the influence of An on phase equilibria is the same whatever the system, either rhyolitic or haplogranodioritic.
Compositions of minimum and eutectic points in the Qz–Ab–Or–An–H2O system (see Fig. 3).
| Pressure (MPa) | 100 | 100 | 100 | 100 | 200 | 200 | 300 | 300 |
|
|
1 | 1 | 1 | 1 | 1 | 0.5 | 1 | 1 |
| wt% Qz | 38.0 | 39.0 | 42.0 | 47.0 | 35.0 | 42.0 | 33.0 | 39.0 |
| wt% Ab | 33.0 | 32.0 | 22.0 | 11.0 | 39.0 | 21.0 | 42.0 | 33.0 |
| wt% Or | 29.0 | 29.0 | 36.0 | 42.0 | 26.0 | 37.0 | 25.0 | 28.0 |
| Total | 100 | 100 | 100 | 100 | 100 | 100 | 100 | 100 |
| wt% An | 0 | 3 | 5 | 7.5 | 0 | 3.5 | 0 | 5 |
| Reference | a | b | b | b | a | c | a | d |
| wt% Qz calculateda | 38 | 40 | 42 | 44 | 33 | 37 | 35 | 36 |
| wt% Ab calculateda | 33 | 28 | 23 | 18 | 42 | 33 | 39 | 33 |
| wt% Or calculateda | 29 | 32 | 35 | 38 | 25 | 30 | 26 | 31 |
| Pressure (MPa) DERPb | 66 | 234 | 177 | 110 | 256 | 69 | 414 | 406 |
a Calculated using the inverse formulation of the Blundy and Cashman (2001) projection scheme. See also text.
b Calculated for the appropriate H2O content using the DERP geobarometer of Wilke et al. (2017). See also text and Fig. 5.
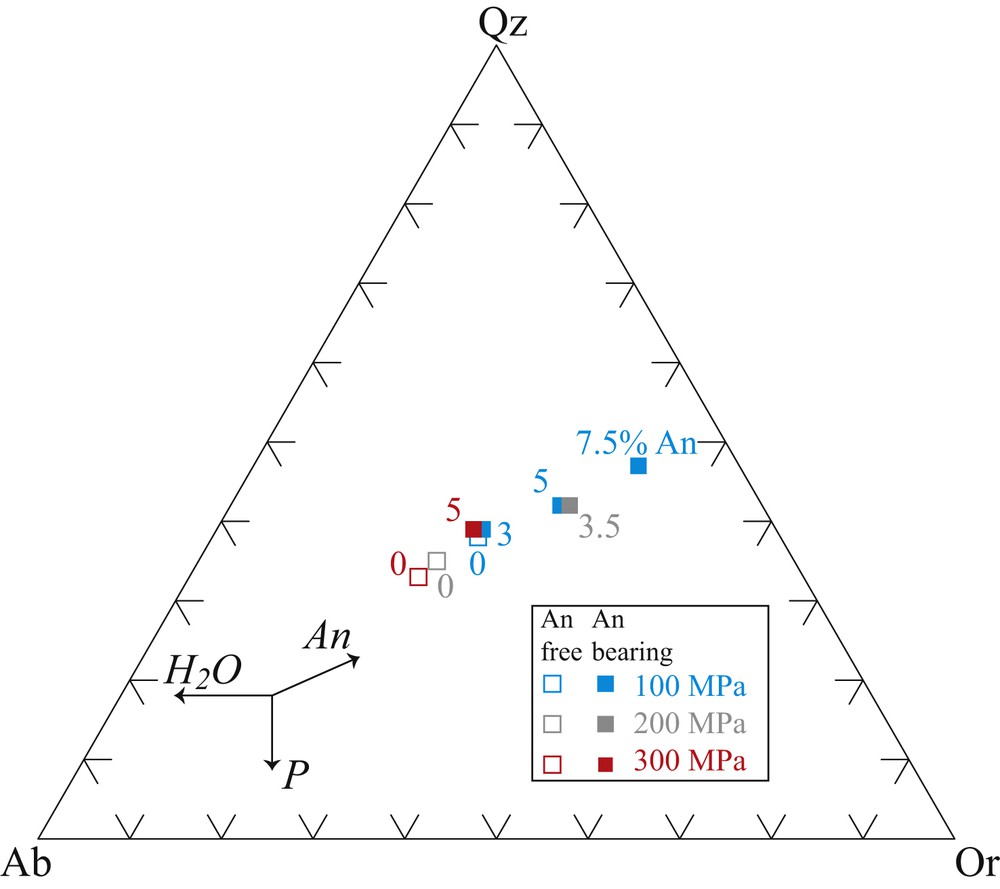
Compositions of minimum and eutectic points in the Qz–Ab–Or–An system projected in the Qz–Ab–Or system (Table 2). Open symbols indicate An-free compositions and filled symbols An-bearing compositions (labeled with An contents in wt%). Experimental pressures indicated with different colors. All points were determined under H2O-saturated conditions (
Compositions of minimum and eutectic points in the Qz–Ab–Or–An system projected in the Qz–Ab–Or system (Table 2). Open symbols indicate An-free compositions and filled symbols An-bearing compositions (labeled with An contents in wt%). Experimental pressures indicated with different colors. ... Lire la suite
More in detail, compositions of minimum liquidus points from the different studies follow an apparently single well-defined trend with increasing An (“An trend”), irrespective of pressure. This indicates that the composition of quartz-two feldspar-saturated granitic liquids (see geometrical relations in James and Hamilton, 1969; Wilke et al., 2015) is weakly dependent on pressure in Qz–Ab–Or projection or, more correctly, that the individual influences of pressure, melt H2O content (whose increase under H2O-saturated conditions goes along with an increase in pressure) and An content combine to produce what appears to be a single trend (Fig. 3). Differences, however, can be noted between studies. The 200 MPa 3.5 wt% An point shows a more marked shift along the An trend than the 100 MPa 3 wt% An point, a consequence of the lower melt H2O content in the former than in the latter (see also Wilke et al., 2017). The 5 wt% An points determined both by James and Hamilton (1969) and in this study both plot on the same An trend, but their positions are not coincident (Fig. 3) and mutually consistent with differences in pressure (100 vs. 300 MPa) and melt H2O concentrations (~4.5 vs. ~8 wt%) between the two studies. This illustrates the interplay between the three variables pressure, H2O concentration and An content and stresses the level of sensitivity needed to use compositions of quartz-two feldspar-saturated granitic liquids for barometric purposes (e.g., Blundy and Cashman, 2001; Wilke et al., 2017 and see below).
5.2 Comparison with empirical crystallization models
Two empirical models have been considered. Because of the lack of experimental data at the time, Blundy and Cashman (2001) introduced a simple projection scheme to estimate the influence of An on the crystallization of silicic liquids. Their approach is applicable to low pressure (P ≤ 200 MPa), mainly H2O-saturated, melts crystallizing a silica phase and at least one feldspar. Although originally constructed to eliminate the influence of An and, thus, to allow the Qz–Ab–Or system to be used as a geobarometer, the projection scheme can be inverted to quantitatively predict the effect of An on phase equilibria. Using the inverted formulation, Qz, Ab and Or contents of minimum liquidus points have been calculated (Table 2). Results reproduce the increase in Qz and Or of minimum liquidus points upon increasing An (Fig. 4a; b). The agreement between experimental and calculated Qz and Or is particularly good at 100 MPa, because these data (James and Hamilton, 1969) are those that served to calibrate the model. The two P > 100 MPa points (3.5 wt% An, 200 MPa and 5 wt% An, 300 MPa) yield Qz contents lower than their respective experimental values (Fig. 4a), which could indicate the need for a more sophisticated, pressure-dependent, projection scheme than the one of Blundy and Cashman (2001). Note that the influence of
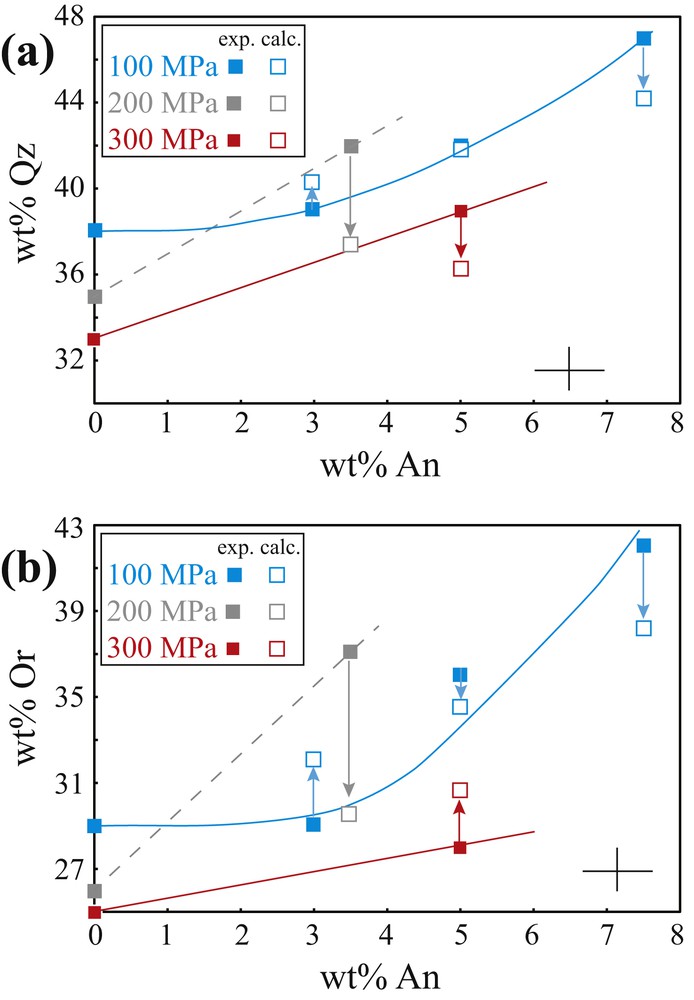
Comparison between experimentally determined (exp.) and calculated (calc., after Blundy and Cashman, 2001) compositions of minimum liquidus points (a: wt% Qz; b: wt% Or) in the Qz–Ab–Or–An system. Experimental data (filled symbols) and calculated compositions (open symbols) are from Table 2. Experimental errors on the location of minimum points are indicated. The arrows emphasize differences between experimental and calculated results. For each pressure, data points and isobars are distinguished using the same color code as in Fig. 3. The 100- and 300-MPa isobars are shown as solid light lines and the 200 MPa isobar as a dashed line because the 3.5 wt% An point is for a rhyolitic melt undersaturated with H2O that contains small amounts of FeOt (1–2.5 wt%) and TiO2 (0.2–0.4 wt%). All other points are for H2O-saturated Qz–Ab–Or–An melts. Masquer
Comparison between experimentally determined (exp.) and calculated (calc., after Blundy and Cashman, 2001) compositions of minimum liquidus points (a: wt% Qz; b: wt% Or) in the Qz–Ab–Or–An system. Experimental data (filled symbols) and calculated compositions (open symbols) are from ... Lire la suite
Wilke et al. (2017) have empirically regressed experimental compositions of minimum liquidus points in the haplogranite and haplogranodiorite systems, and in a rhyolitic system containing small amounts of CaO, FeOt, and TiO2. Expanding on the approach introduced by Blundy and Cashman (2001), they constructed a geobarometer (DERP) based on the normative Qz, Ab and Or contents of the melt at equilibrium with quartz and at least one feldspar. The model uses the melt H2O content and the wt% An as the main variables. Pressures of minimum liquidus points (Table 2) were calculated with DERP and results compared with experimental pressures (Fig. 5). Calculated pressures distribute on both sides of the 1:1 line (Fig. 5), the average difference between experimental and calculated pressures being 82 MPa. The two 300 MPa minimum liquidus points yield pressures in the 400-MPa range (Table 2). Compared to Blundy and Cashman (2001), the main improvement is that the role of the different key variables, pressure, melt H2O content and wt% An on compositions of cotectics and minimum points is explicit. However, the model is quite simple (each variable is assumed to be independent from the other and to have a linear effect) and the agreement between measurements and calculations is no better than reasonable (Fig. 5). In addition, neither the DERP nor the Blundy and Cashman (2001) models provide regressions on liquidus temperatures and feldspar compositions.

Comparison between experimental (Pexp) and calculated (Pcalc) pressures for minimum liquidus points in the Qz–Ab–Or–An system, both An-free and An-bearing. The calculated pressures are obtained with the DERP geobarometer (Wilke et al., 2017). Experimental and calculated pressures are from Table 2. Experimental data points for each pressure are distinguished using the same color code as in Fig. 3.
5.3 Comparison with thermodynamic crystallization models
The preceding section underlines several limitations of empirical crystallization models. This section stresses the ability of thermodynamic models in providing a rigorous way to interpolate and extrapolate liquidus phase equilibria. The development of thermodynamic models for silicate melts has been an important research topic during the last 50 years. Essentially two types of models have been constructed. In the first one, focus was placed on relatively simple systems. For example, crystal–liquid equilibria in the system Qz–Ab–Or–H2O were modeled by Kirschen and Pichavant (2001), and granite melting phase equilibria can be calculated for the system CaO–Na2O–K2O–Al2O3–SiO2–H2O with the model of Holland and Powell (2001) for the melt phase. The second type of models, such as MELTS (Ghiorso and Sack, 1995), has followed another strategy by considering from the beginning melts with a large number of components, thus enabling direct application to natural magmas.
Both types of thermodynamic models have been tested. For simple systems, the model of Holland and Powell (2001) has been used as that of Kirschen and Pichavant (2001) does not handle An-bearing compositions. Tests were also performed with the model of Holland and Powell (2011), but results did not significantly change although, in detail, differences were noted with their earlier model (Holland and Powell, 2001). Detailed calculations were performed at 300 MPa on four experimentally investigated compositions (0, 7, 13, 14, Table s1) and for melt H2O concentrations ranging from 5 to 10 wt%. Compositions were selected to tightly bracket the determined minimum liquidus point (Fig. 1) and so to have different phases (Pl, Qz and Af) appearing on the liquidus. However, the same phase (Pl) was found to crystallize on the liquidus for all four compositions tested with the model. In other words, the model finds that all compositions tested should plot in the Pl primary phase field, whereas the experiments tell otherwise (Fig. 1). If results are detailed for composition 0 (Fig. 6), the computed plagioclase liquidus occurs at temperatures much higher than the experimental point (i.e. for H2O-saturated conditions, the calculated liquidus temperature is 860 °C vs. at 730 °C, Fig. 6). Calculated plagioclase An contents reach >65 on the liquidus, i.e. are much above the experimental compositions (maximum An30, Table s3) and imply a Pl–L Ca–Na distribution coefficient > 10, i.e. more than twice the maximum of the experimental range (Fig. 2). For the model to give a H2O-saturated Pl liquidus temperature identical to that in experiments (730 °C), the CaO content of the starting composition needs to be decreased by a factor of 4. These various results emphasize that the experimental results in the haplogranodiorite system are not well reproduced with the model of Holland and Powell (2001), mainly because plagioclase stability appears greatly enhanced. Yet, we note that melt H2O contents at saturation look reasonable, despite a strong temperature dependency (i.e. 7.5–8 wt% at 700–850 °C). For near-eutectic conditions, the crystallization sequence, Qz and Af saturation temperatures, and Pl compositions are close to experimental values.

Experimental and calculated phase equilibria for composition 0 (Table s1) at 300 MPa projected on a temperature (°C) vs. H2O concentration in melt (wt%) diagram. Abbreviations: L, liquid; V, fluid phase; Af, alkali feldspar; Pl, plagioclase; Qz, quartz; An, 100 Ca/(Ca + Na) in plagioclase. Calculated data are shown in black, white and grey, and experimental data in red. The calculated stability fields, phase assemblages and compositions are obtained with the model of Holland and Powell (2001). Dashed lines indicate plagioclase An contents. The large red diamond is the H2O-saturated experimental temperature (plagioclase saturation) point (Table 1). Notice the marked differences between the calculated (860 °C) and the experimental (730 °C) temperature of the H2O-saturated plagioclase saturation point and between the calculated (>65) and experimental (30) An content of the liquidus plagioclase. Masquer
Experimental and calculated phase equilibria for composition 0 (Table s1) at 300 MPa projected on a temperature (°C) vs. H2O concentration in melt (wt%) diagram. Abbreviations: L, liquid; V, fluid phase; Af, alkali feldspar; Pl, plagioclase; Qz, quartz; An, 100 ... Lire la suite
For complex systems, we have used the rhyolite-MELTS model of Gualda and Ghiorso (2015). However, both the formulation and calibration of rhyolite-MELTS are in principle inappropriate for simplified compositions (G. Gualda, personal communication, 2018). Nevertheless, it seemed interesting to test the extrapolating capacity of MELTS (i.e. its response when used on compositions and experimental results outside its calibrating database). Detailed calculations were performed at 300 MPa on the same four experimentally investigated compositions (0, 7, 13, 14, Table s1) as above and for variable melt H2O concentrations until saturation. For all four compositions and despite the ability of rhyolite-MELTS to model at minimum five component melts (e.g., CaO–Na2O–K2O–Al2O3–SiO2, Gualda et al., 2012), small amounts (<0.5 wt%) of TiO2, FeO, and MgO were added to each starting composition. We checked that this additional chemical complexity causes only negligible variations on MELTS results (e.g., <5 °C on computed Qz and feldspar saturation temperatures). For three compositions (0, 7, 14), model liquidus phases and crystallization sequences agreed with experimental data (Table 1). The fourth (composition 13) crystallized Pl on the liquidus and not Af (Table 1). However, feldspar identification in the 685 °C composition 13 charge is somewhat uncertain, since it has not been confirmed by electron microprobe analysis (Table 1). In addition, at H2O saturation for this composition, rhyolite-MELTS finds the three phases Pl, Af, and Qz crystallizing within 10 °C from each other, in close agreement with phase assemblages in the 675 and 664 °C charges (Table 1). We therefore conclude that the piercing point constrained by MELTS lies very close to the experimentally located composition, and thus that Qz- and feldspar-liquid phase equilibria in the haplogranodiorite system are well reproduced by the model.
The calculated compositions of feldspars are in broad agreement with experimental compositions. The maximum An content (An22) computed for near-liquidus Pl in composition 0 is lower than the experimental value (An30) but Pl in model eutectic assemblages have An between 15 and 20, in good agreement with the experimental data (An18, Table 1). Calculated (Or61-79) and experimental (Or71-87) Af compositions overlap. However, model and experiments significantly differ on two aspects. (1) The H2O solubilities (determined by the arrival of water as a phase in the calculations) range from 6.1 (composition 14) to 7.2 wt% (composition 0) according to the model, i.e. are less than the value of ~8 wt% H2O estimated in this paper. (2) The crystallization temperatures calculated with the model are significantly higher than the experimental values. For example, the calculated liquidus temperatures for the four tested compositions are, under H2O-saturated conditions, 766 °C (glass 0, 730 °C according to Table 1), 765 °C (7, 705 °C), 743 °C (13, 685 °C) and 755 °C (14, 695 °C). Note, however, that it is not possible to compare model and experimental liquidus temperatures for identical melt H2O concentrations, since experimental H2O concentrations (~8 wt%) exceed the calculated H2O-saturation limits (6.1–7.2 wt%). It is also interesting to note that the discrepancy between model and experiments greatly reduces if model liquidus curves are extrapolated to melt H2O concentrations beyond the calculated H2O-saturation limits. For example, the liquidus temperature for composition 0 decreases from 766 °C down to ~750 °C (730 °C in the experiments) for 8 wt% H2O in melt (Fig. 7). This could indicate that the two problems, H2O-saturation limits and crystallization temperatures, are related. It seems possible that rhyolite-MELTS, in underestimating the range of possible melt H2O concentrations, minimizes the depressing influence of water on Qz and feldspar crystallization temperatures. Therefore, and although the software satisfactorily reproduces the Qz-, Pl- and Af-liquid phase equilibria, inadequacies are identified, which require corrections for application to silicic magmas.
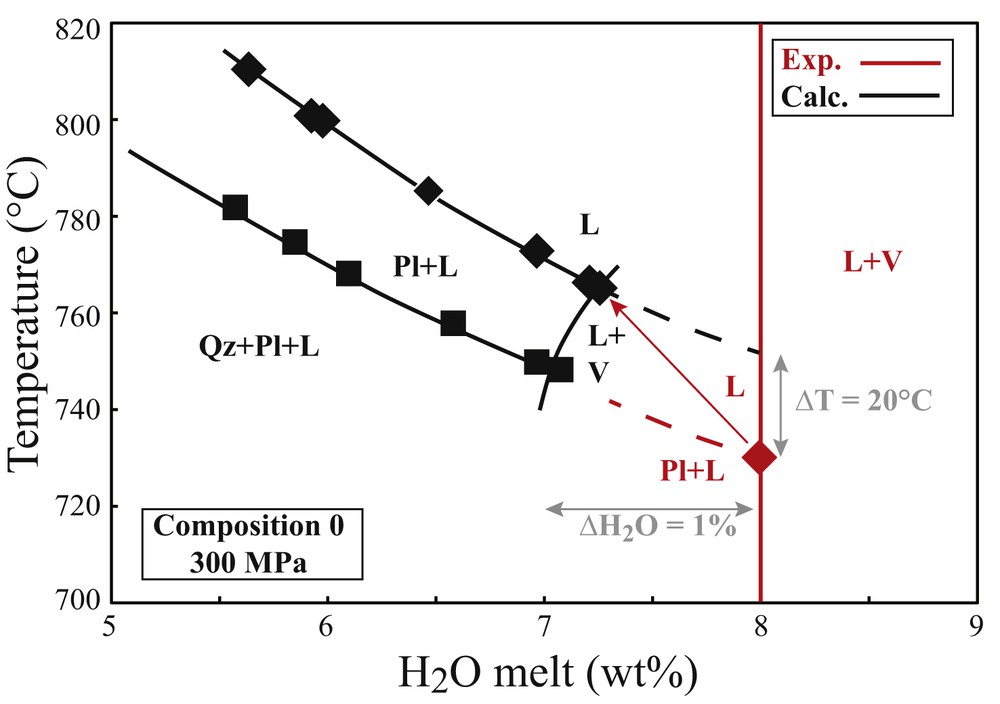
Experimental and calculated phase equilibria for composition 0 (Table s1) at 300 MPa projected on a temperature (°C) vs. H2O concentration in melt (wt%) diagram. Red drawing and lettering refer to experimental data and black drawing and lettering to calculated data. Experimental data are from Table 1. Solid red diamond: H2O-saturated liquidus temperature (plagioclase saturation) point, the slope of the H2O-undersaturated liquidus curve emanating from this point (bold red dashed curve) is estimated. The vertical bold red line marks the H2O-saturation limit estimated at 8 wt% H2O (see text). Calculated data obtained with the rhyolite-MELTS model (Gualda and Ghiorso, 2015), each point corresponding to an equilibrium computation. Black diamonds: calculated liquidus temperatures (plagioclase saturation) points. Black squares: calculated cotectic temperatures (quartz saturation) points. Black curves: Pl and Qz saturation and H2O-saturation limit. Abbreviations: L, liquid; V, fluid phase; Pl, plagioclase; Qz, quartz. Compared to the experimental point, the H2O-saturation limit calculated with rhyolite-MELTS is ~1 wt% less H2O-rich than the experimental estimation and Pl liquidus temperatures are higher (red arrow). Note however that the calculated Pl liquidus, if extrapolated to 8 wt% H2O (black dashed curve), is only ~20 °C above the experimental value. Masquer
Experimental and calculated phase equilibria for composition 0 (Table s1) at 300 MPa projected on a temperature (°C) vs. H2O concentration in melt (wt%) diagram. Red drawing and lettering refer to experimental data and black drawing and lettering to calculated ... Lire la suite
6 Conclusion
New experimental data in the haplogranodiorite Qz–Ab–Or–An–H2O system have been presented and the results contribute to a better evaluation of the influence of the An component on phase equilibria in this system. The effect of An on phase equilibria is qualitatively the same in the haplogranodiorite and in the rhyolitic system investigated by Wilke et al. (2015, 2017). Pressure, melt H2O content, and An content have contrasted individual influences on phase equilibria in the granite system. Compositions of quartz-two feldspar-saturated granitic liquids are weakly dependent on pressure below 300 MPa, and this makes their use for barometric purposes a particularly challenging task. The fact that experimental data on the effect of An are now available basically invalidates the use of empirical oversimplified projection schemes to model natural silicic magmas. Thermodynamic models provide a rigorous way to interpolate and extrapolate liquidus phase equilibria. However, testing of these models against the new experimental data allows problems to be clearly identified. A closer integration between the acquisition of new experimental data and the development of thermodynamic software seems required to more accurately model silicic magmas.
Acknowledgements
The experimental work in Nancy benefited from discussions with P. Barbey, W.L. Brown and F. Holtz. I. Di Carlo helped with analytical work in Orléans. G. Gualda shared his expertise with the rhyolite-MELTS code. The analytical work has been partly supported by Equipex PLANEX. The LABEX Voltaire provided a suitable scientific environment as well as the motivation to present the experimental data. Reviews by F. Holtz, E. Christiansen, and O. Bachmann were very helpful.
Vous devez vous connecter pour continuer.
S'authentifier