

 CC-BY 4.0
1. Introduction
Models for the growth of a single fault usually involve the development of an elliptical surface with zero displacement at the fault tips and maximal displacement at the center of the fault surface [Kim and Sanderson 2006, Walsh and Watterson 1987]. The area of the rupture then grows in all directions as the slip increases. Fault size increases with cumulative displacement, but this development is rarely linear because fault propagation may be modified by many parameters, including layer thickness [Benedicto et al. 2003], contrasting lithological and rheological properties between the different layers of host rock [Soliva 2004, Roche et al. 2012], changes in the stress regime during fault activity [Wibberley et al. 2008], fault surface geometry [Childs et al. 2009], and inherited structures [Camanni et al. 2019].
It is, therefore, widely agreed that a fault should not be seen as a single rupture plane, but as a volume consisting of a fault zone core—the most central part of the fault, where deformation is most intense, in contact with the slip plane [Caine et al. 1996, Evans et al. 1997, Kim et al. 2004, Schultz and Fossen 2008]—and a fault damage zone, a volume of deformed rock around a structural discontinuity formed at any stage in the development of the structure [Constantin et al. 2004, Faulkner et al. 2011, Schultz and Fossen 2008].
According to this view, fault-zone thickness and length generally increase with displacement [Cowie and Scholtz 1992, Dawers et al. 1993, Wibberley et al. 2008], but through processes likely to favor tip-zone rupture, weakening the wall rock, with the incorporation of material into the core zone [Scholz 1987], or to inhibit fault growth, such as host-rock hardening [Faulkner et al. 2003].
The resulting fault zones are, therefore, complex and heterogeneous, with these processes affecting some but not necessarily all zones, the rheological properties of the fault zone, the surrounding host-rock volume and the geometry of the fault surface, which varies during the evolution of a fault system.
Observations of fault tips are required to determine how the fault planes propagate in the host rock and to establish the stages in the development of fault zones. Fault tips are often structurally complex zones of deformation involving a certain volume of rock, within which a damage zone forms, which must be taken into account in analyses of the propagation process [Cowie and Shipton 1998, Kim et al. 2004, McGrath and Davison 1995, Shipton and Cowie 2003, Wilkins and Gross 2002]. Fault growth is generally associated with brittle and ductile deformations of the host rock, but the relative timing of the propagation sensu stricto of the rupture surface and of the development of the entire fault zone is unclear and must be clarified by field observations.
In this study, we performed field observations of the exposed tip of a normal fault, to investigate the spatial and temporal evolution of this tip and the deformation processes involved in fault propagation. In addition, this study provides interesting new data of structural geology in an area, where such data are rare. It is also of interest because the fault studied belongs to a network of faults with low to moderate seismicity [Figure 10 in Duverger et al. 2021].
2. Geological context
The Argence Fault is located in the northern part of the Aquitaine Basin, close to the town of Angoulême. It is part of a cluster of faults running in an average NW/SE direction (Figure 1) cutting across the northern edge of the Aquitaine Basin.
(A) Geological map of the Angoulême area [modified from Bourgueil and Moreau 1970 and Hantzbergue et al. 1984]. The studied outcrop at the tip of the Argence Fault is indicated by the star. The dashed line indicates the cross-section in part B. (B) Geological cross-section. The vertical scale is five times larger than the horizontal scale. The rectangle on section indicates the studied exposure (shown in Figure 2). The thicknesses of the series were obtained from the “La Touche” drilling [Hantzbergue et al. 1984].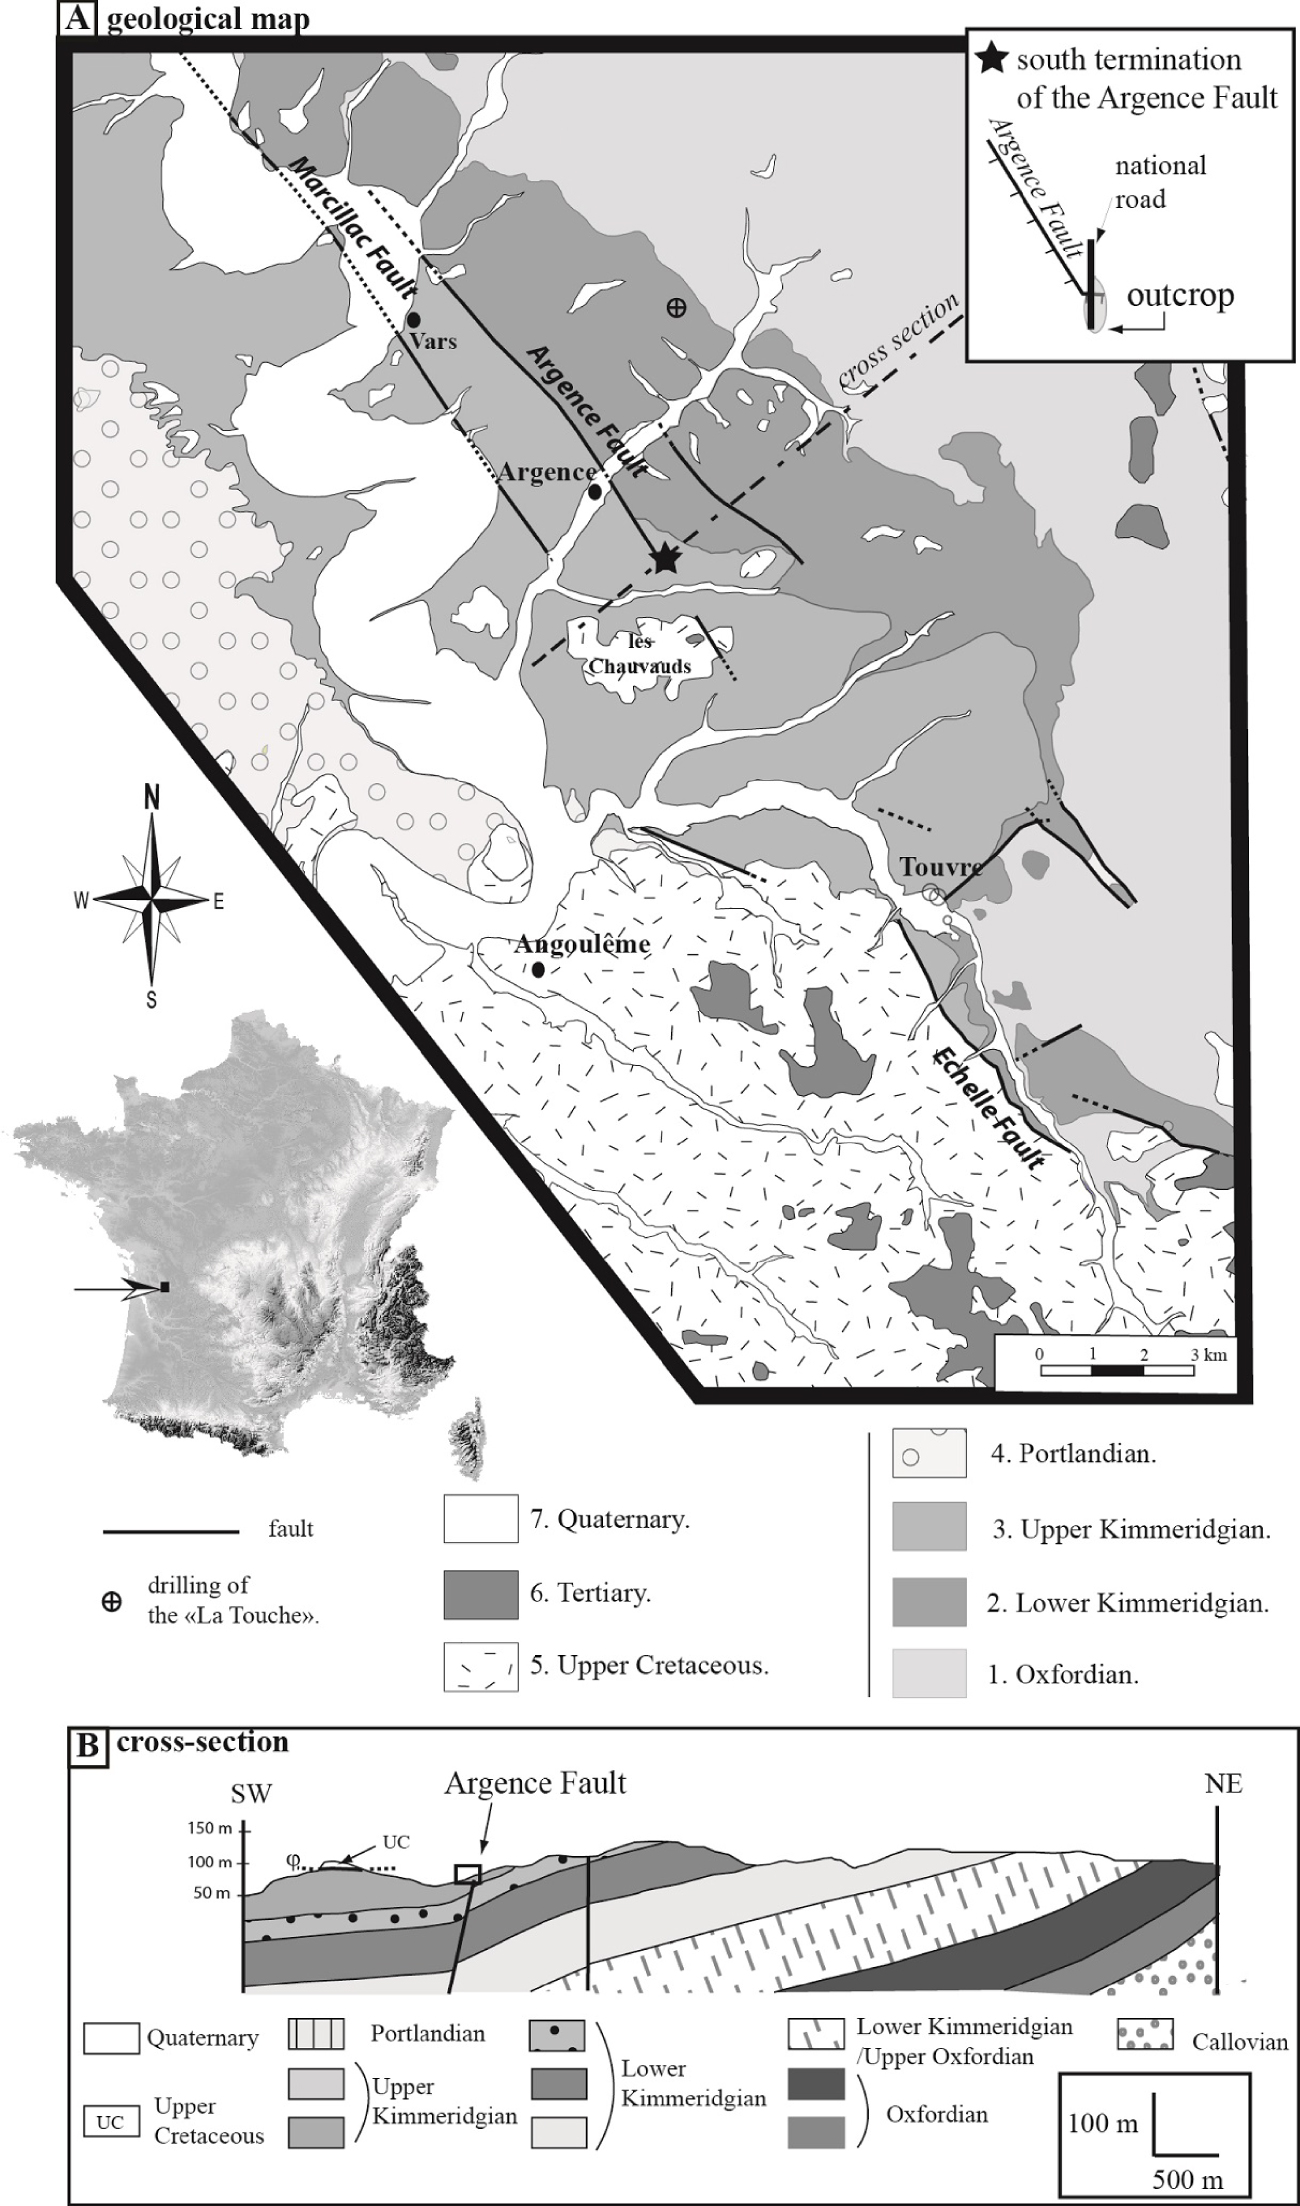
General view and parallel cross-sections of the outcrops of the Argence Fault. The excavations for road construction made it possible to observe the Argence Fault towards the east and west. The two sections are separated by the national highway, which is 20 m wide at this site. The numbers in italics refer to the lithostratigraphic column in Figure 3. T(i) and M(i) indicate the secondary normal faults in the hanging wall and the footwall, respectively. Figures 5 and 6 are located on this section by two rectangles.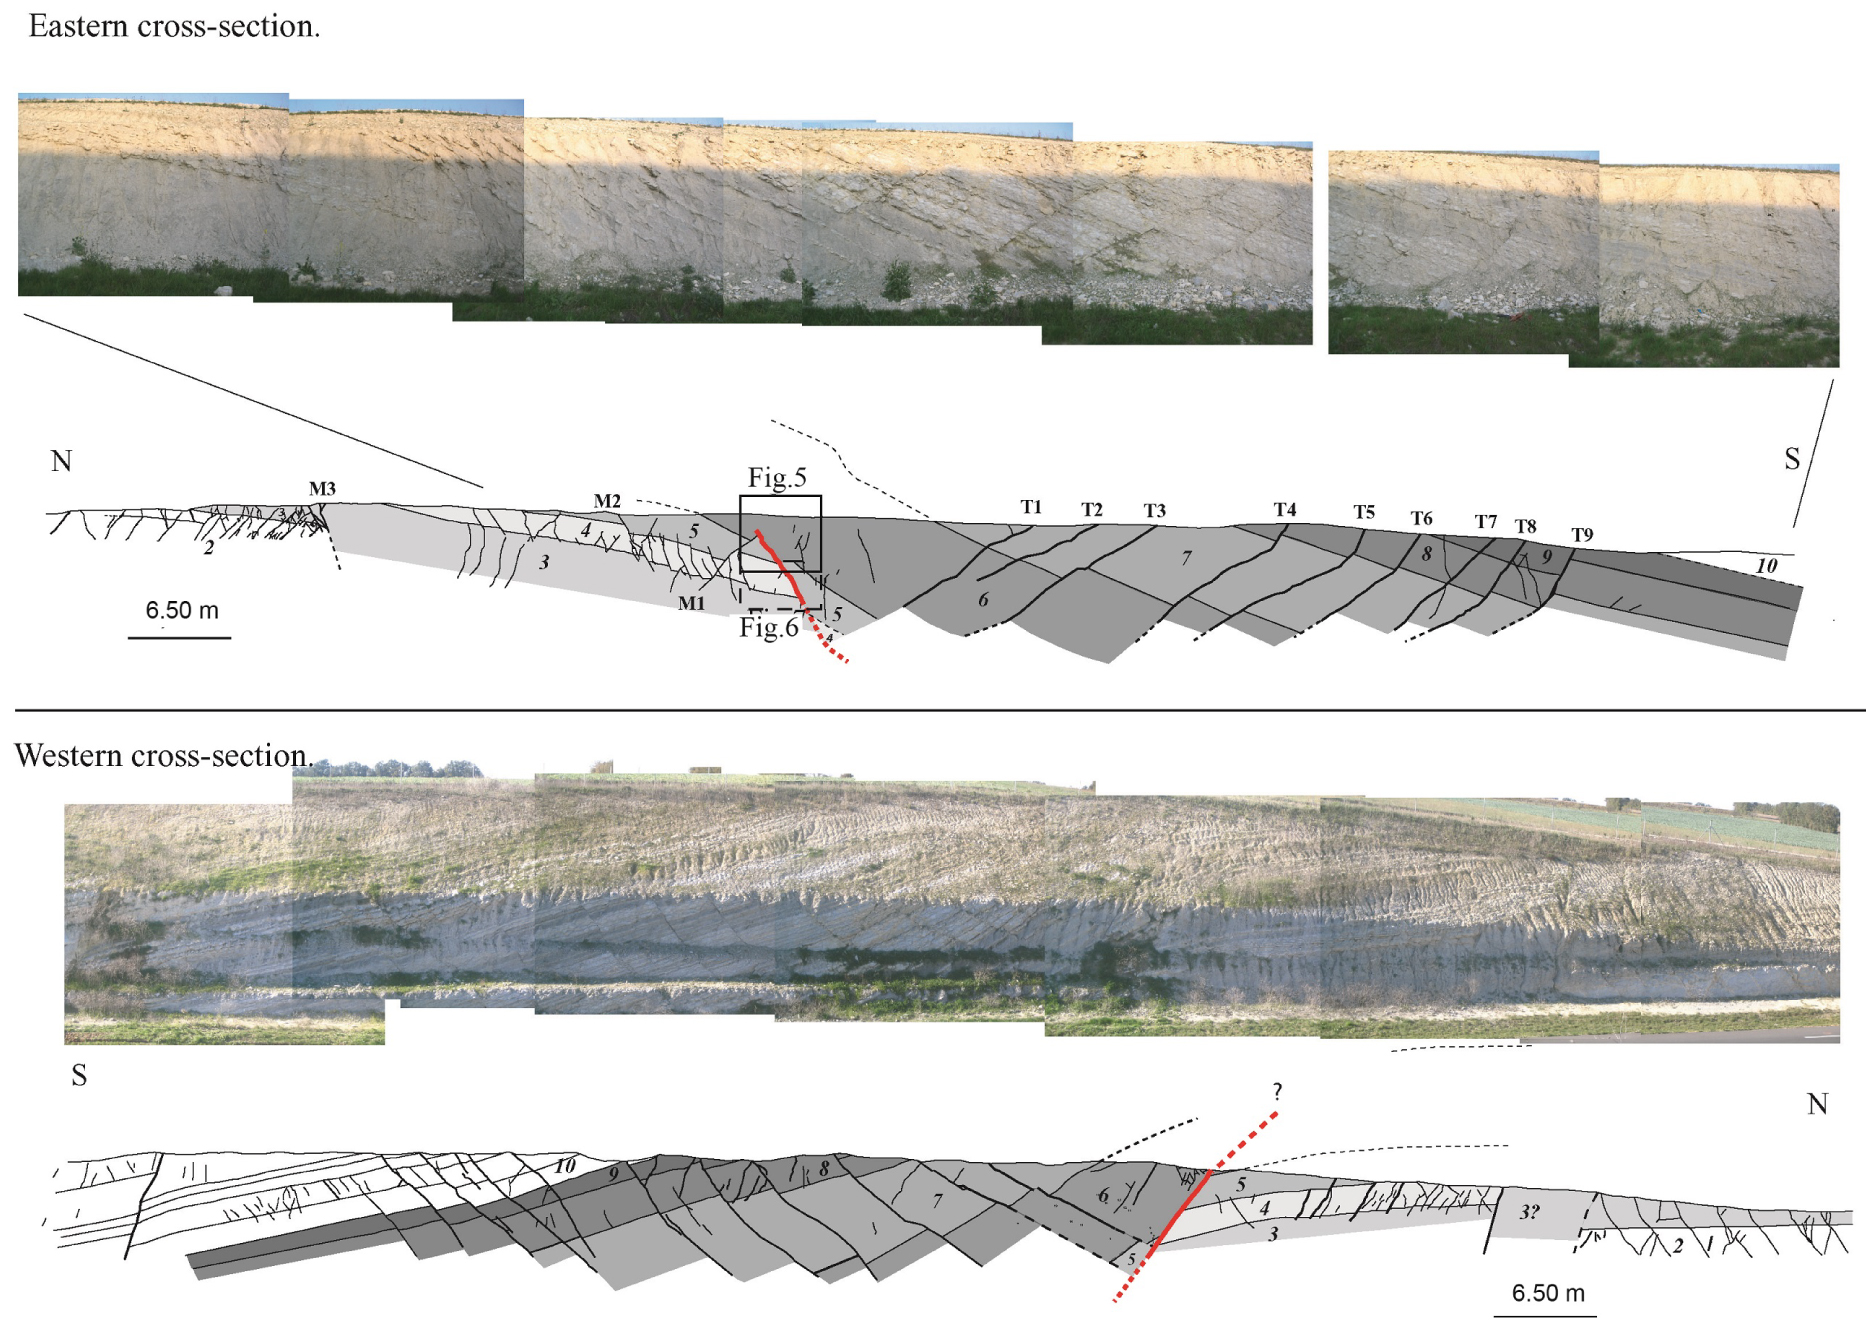
The Argence Fault lies in the prolongation of the Chauvaux Fault and of the Echelle Fault, which are located further south. These faults may be seen as three independent off-line segments of the same fault zone, if we consider a fault to be initiated as an array of irregular fault segments [Walsch et al., 2002]. In this case, the fracture would be at a stage of development before the linkage of the fault segments.
The Marcillac Fault is parallel to the Argence Fault trends in NW/SE direction and forms a relay zone with an overlap of about 6.5 km in length. The maximum throw reaches about 70 m on the Marcillac Fault and about 40 m on the Argence Fault.
These NW/SE-trending faults are considered to be of Hercynian origin, reactivated as normal faults during formation of the Aquitaine Basin [Hantzbergue et al. 1984].
Rock age increases along a south-to-north gradient in the area studied. In the south, the rock formations, dated to the Cenomanian to Campanian (Upper Cretaceous), lie unconformably on Jurassic formations, indicating a gap in sedimentation during the Lower Cretaceous [Bourgueil and Moreau 1970].
Tertiary formations, composed of detrital rocks from the Eocene age, are present exclusively in the southern part of the area studied, where they lie unconformably on predominantly Cretaceous formations.
The entire series has a general dip towards the south, which can be attributed to three regional episodes of tilting: (1) an absence of deposition during the Lower Cretaceous and the unconformable deposition of the Upper Cretaceous formations above formations of various Jurassic ages indicate a tilt of the formations before the Cenomanian; (2) the deposition of detrital formations dating from the Eocene on top of Cretaceous formations of various ages, but younger towards the south, indicates a tilting towards the south before the Eocene; (3) the Eocene deposits are present exclusively on formation from the Cretaceous in the south of the area, implying that the entire series tilted towards the south after the Eocene, preserving the Tertiary deposits in the south.
The tilting episodes may be connected to a deepening of the Aquitaine Basin, which may have occurred during the activity of the border faults, such as those present in the study area [Platel 1996].
The Echelle Fault brings the Jurassic and Cretaceous formations into contact (Figure 1) and the Chauvaux fault crosses formations dating from the Upper Cretaceous, indicating that these two faults were active during and after the Upper Cretaceous.
3. Outcrops: general geometry
Outcrops are rare in the area, and the southern end of the Argence Fault was exposed by work on a trunk road (Figure 2). The lithological formation, dated to the Upper Kimmeridgian, consists of marls, clays, argillaceous and marly limestones and sublithographic limestones (Figure 3) containing characteristic accumulations of Nanogyra virgula. The faulted rocks are visible on either side of the trench dug to build the road, which is about 20 m across.
Lithostratigraphic column established from the outcrop. The layers were grouped into levels according to their lithological features.
The outcrops analyzed here are located at the southern end of the mapped segment corresponding to the Argence Fault. They are differentiated into eastern and western outcrops according to the direction of observation. They have similar characteristics (Figure 2):
∙ A tilting of the layers towards the south, corresponding to monoclinal folding. This monoclinal folding is associated with a main normal fault plane dipping to the south. The steepest dips lie above and along this normal fault plane, in the hanging wall. The dip of the layers decreases towards the south, becoming horizontal. In the footwall, to the north of the master fault, the dip of the layers is horizontal. It increases slightly as the fault plane approaches, but does not exceed 10°. The tilting of the layers is greater and more extensive in the hanging wall than in the footwall.
∙ The main fault plane reaches the surface on the western outcrop but not on the eastern outcrop. It is oriented E/W, while the mapped orientation of the Argence Fault is NW/SE. At the outcrop, the main fault plane lies in an E/W direction, with a high dip of 75° towards the south.
∙ A network of parallel faults is present in the hanging wall and the footwall of this main fault. We use the term “secondary fault”, defined as a fault of plurimetric dimensions affecting at least two levels defined on the lithographic column, to describe these faults (Figure 3).
There are more secondary faults in the hanging wall than in the footwall and they are distributed over a longer distance in the series (Figure 1). All but one of the secondary faults in the hanging wall are antithetic. The exception is visible to the south of the western section, but absent on the eastern section. The footwall has only a few secondary faults, distributed over a shorter distance. They run in the same direction and are mostly synthetic with the main fault plane.
∙ Within the walls, the nature of the fracture changes as it moves away from the main fault. Moving northwards, the faults disappear and are replaced by large joints and orthogonal diaclases restricted to the benches. Symmetrically, moving southwards from the main fault, the frequency of secondary faults decreases, with fracturing in the form of joints becoming increasingly rare.
Unfortunately, the western section was not accessible for safety reasons and could not be studied in detail. For this reason, the descriptions below are based principally on measurements and observations of the eastern outcrop. On this eastern outcrop, 12 planes of “secondary” faults were measured, following an average N115 direction. The secondary faults run in a direction different from that of the main fault.
∙ There is another fracture composed of a smaller fault (cutting a single level, as defined on the lithographic column in Figure 3) that is homogeneous, with an average direction N095, corresponding to that of the master fault (Figure 4).
The consistency of the fracture directions indicates that the observed deformation is associated with the same tectonic event and related to the activity of the Argence Fault. Through a more detailed observation of the deformation, we will analyze the final stages of propagation of the main fault plane and the development of the fault zone at the scale of the outcrop.
(A) Lower hemisphere projection of the fault planes. The Argence Fault plane is indicated by the thick black line. (B) Rose diagram showing the fault strikes. (C) Structural schematic map of the fracturing observed on the outcrop. The different elements are not drawn to scale.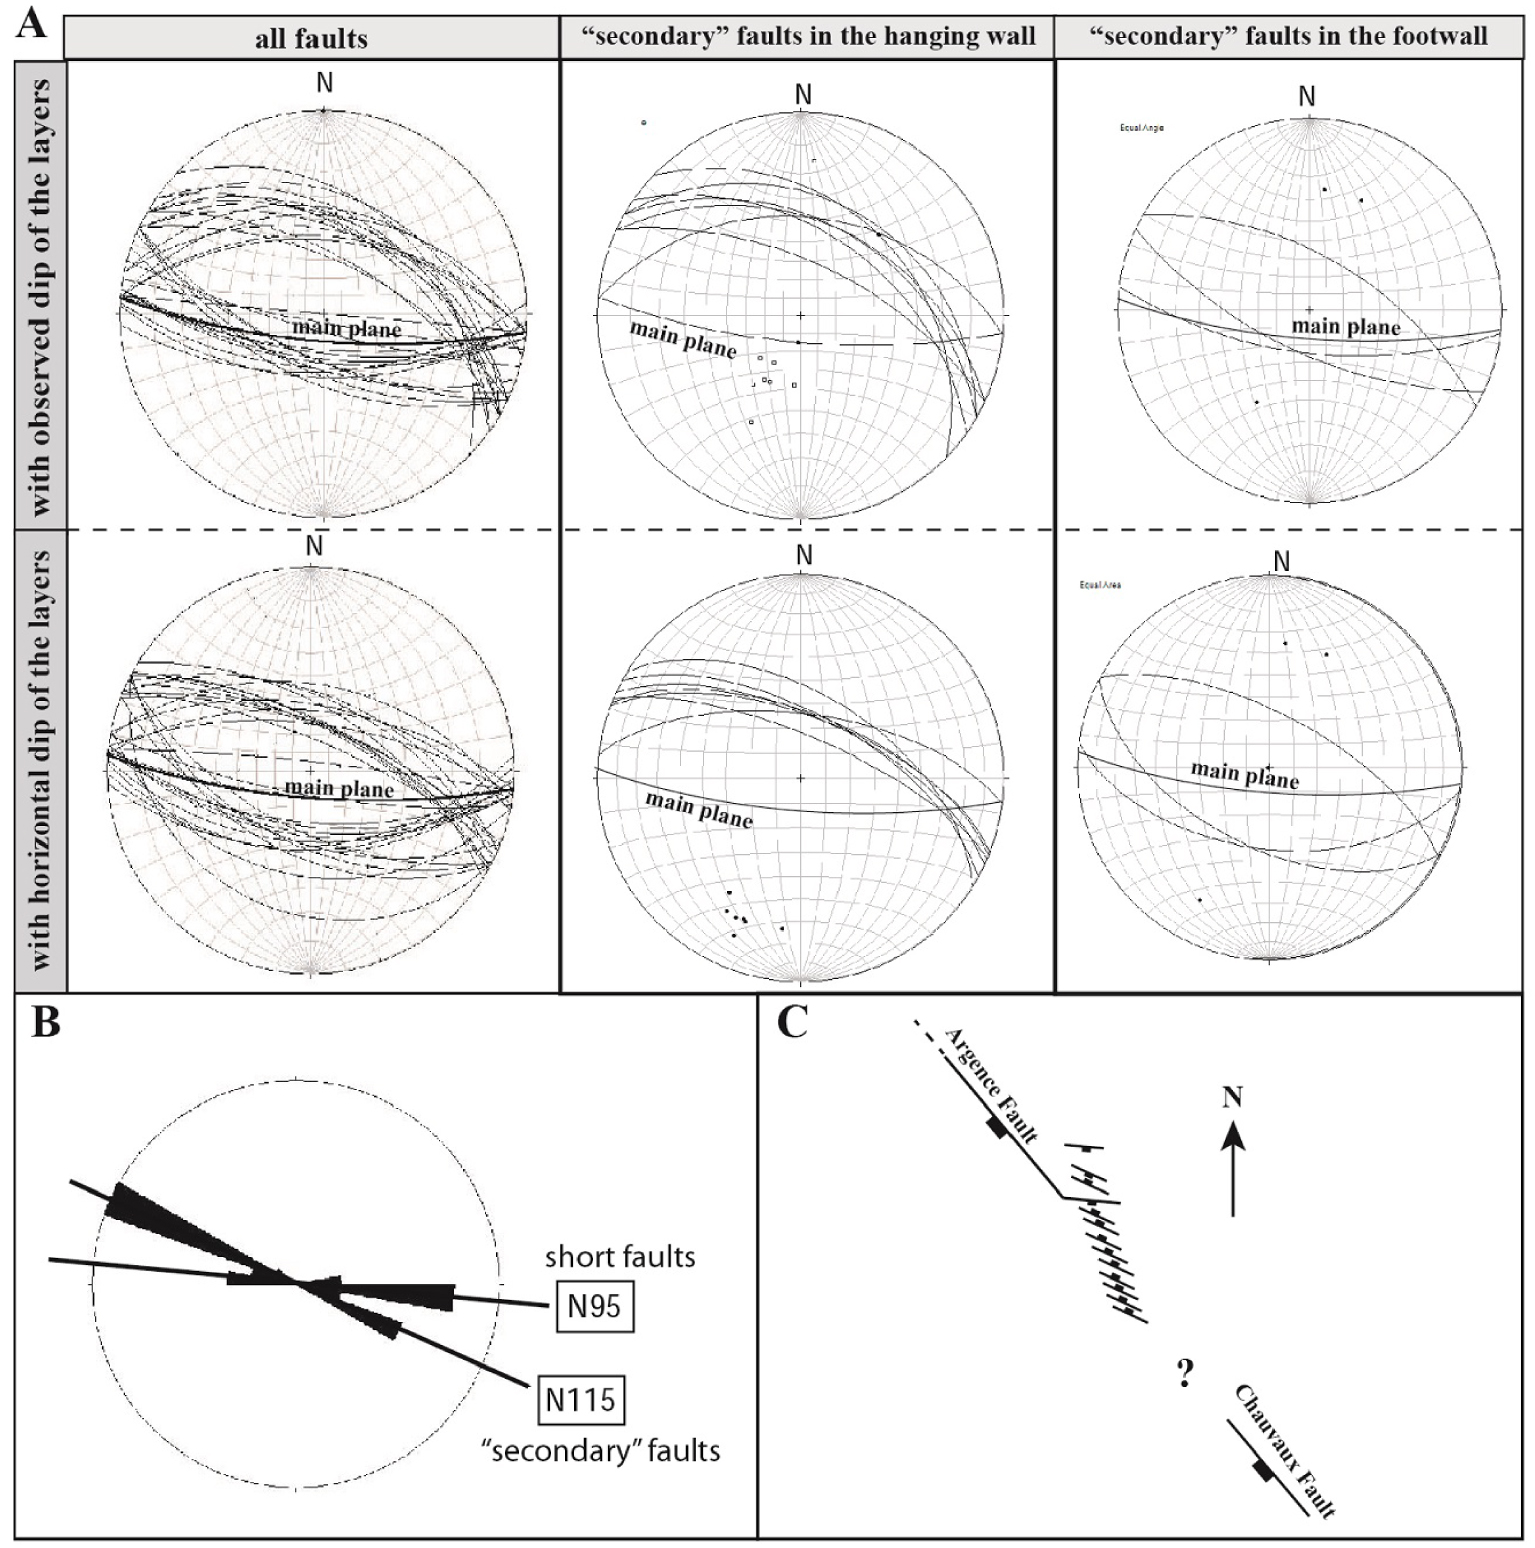
4. Main fault plane of the Argence Fault: field observations
On the eastern outcrop, the main fault plane does not reach the surface and the layers are folded ahead of the top of the fault. The limestone beds and more or less clayey marls are in contact. The main fault plane contains calcite crystals and mechanical striations, confirming normal fault movement with a dip slip direction close to 90°.
In contact with the plane, there are some lenses of more intensely fractured marly rock in a state close to cataclasis (Figure 5).
Photograph of the upper tip of the Argence Fault (eastern section). (A) Photograph and drawing. Dotted line: stratification. L: lumachelles of Exogyra virgula. The gray transparent zone corresponds to the zone in which the deformation is most intense. (B(B1, B2)): normal faults limited to the limestone beds; mf: microfault; f: tension gash. (C(C1, C2)): contact marly-limestone/marl along the Argence Fault. S: schistosity. C: calcitic filling.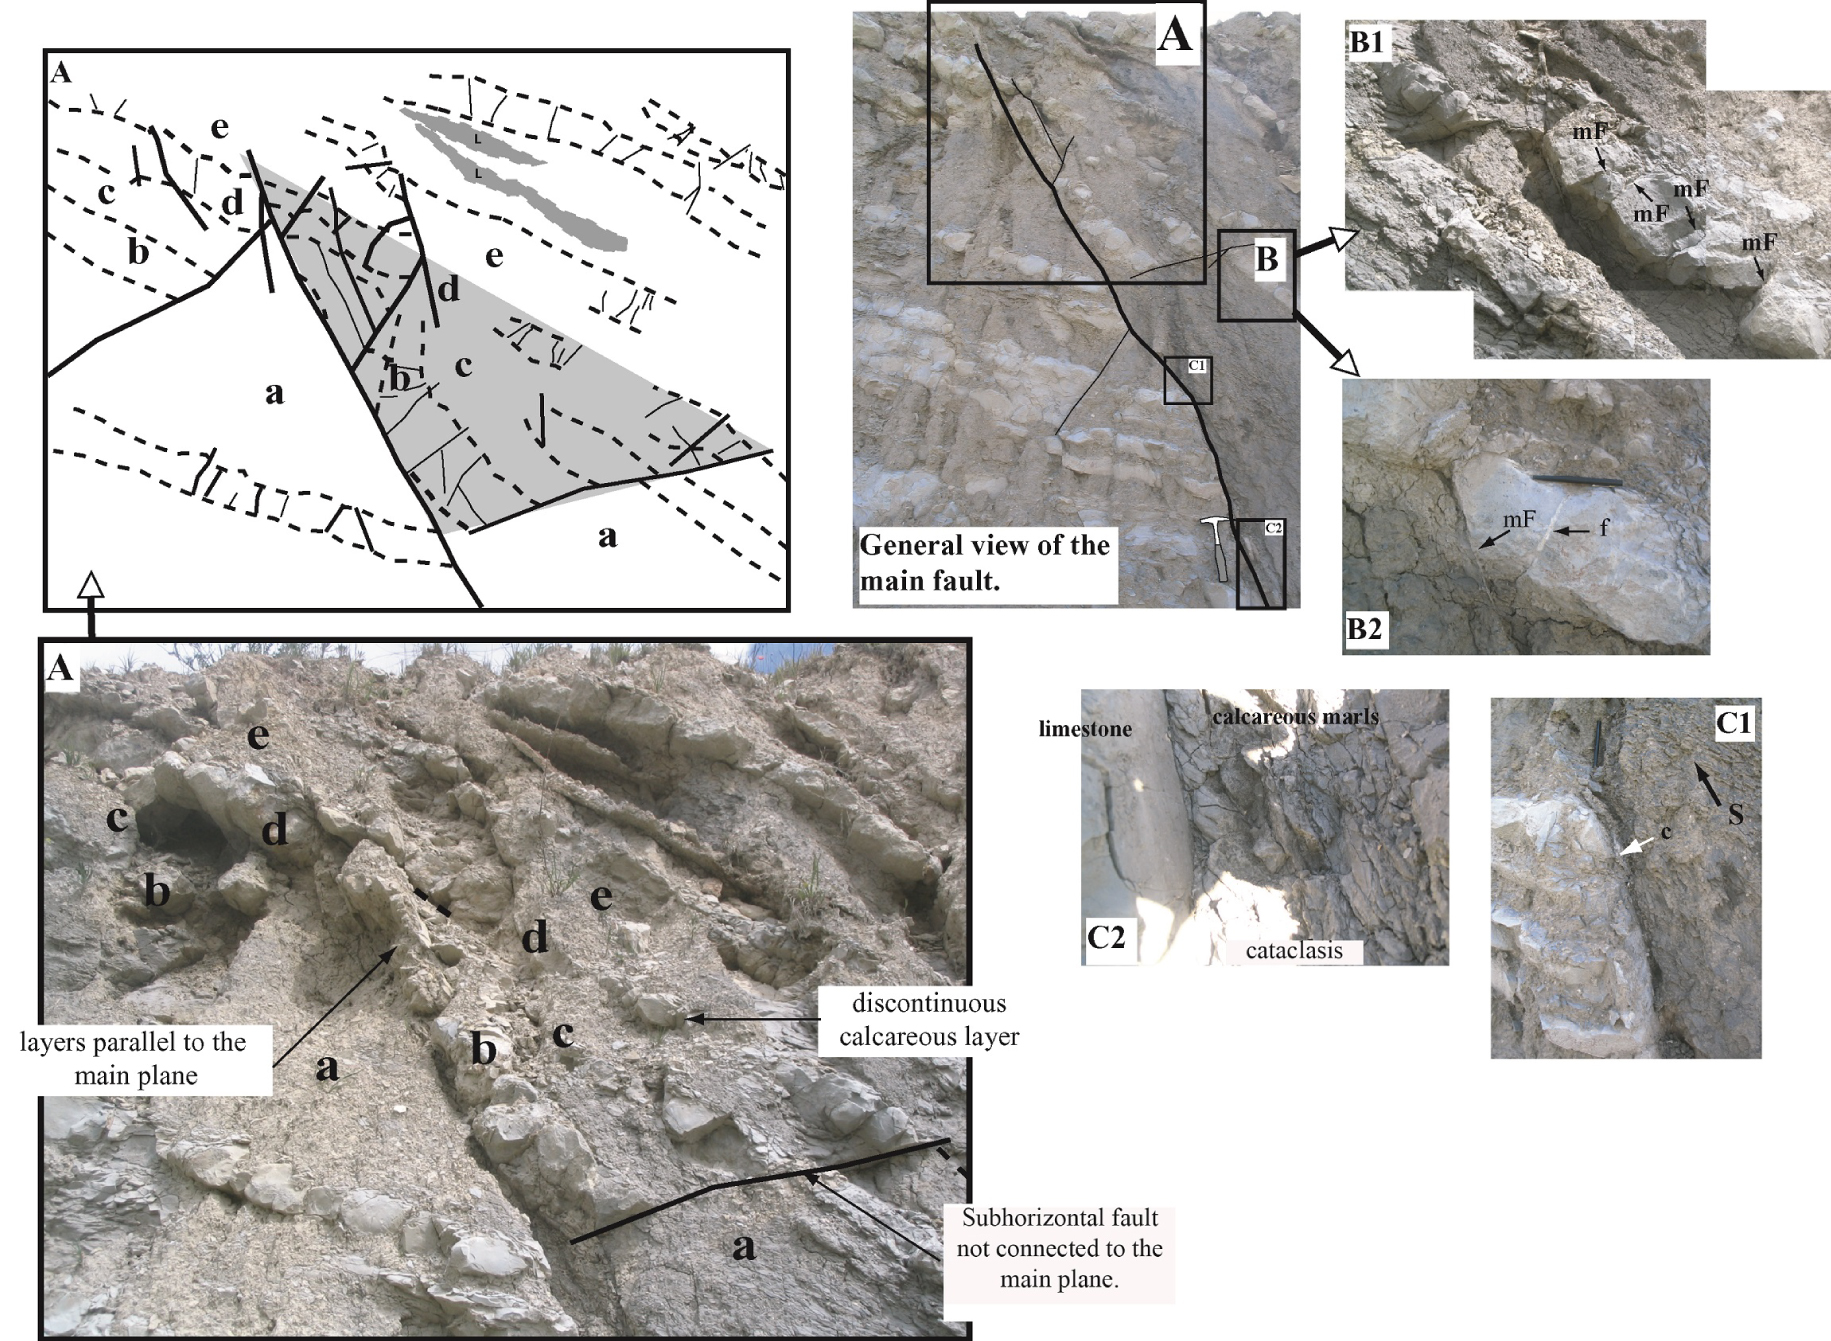
On the western outcrop, the main fault plane reaches the surface with the same dip and direction as the eastern outcrop. The layers crossed by the fault are the same as those in the eastern outcrop, but the upper tip of the fault is higher in the lithological series and the master fault displays a greater displacement.
4.1. Geometry and displacement
In the hanging wall, the dip of the layers varies along the fault plane. At the top of the fault, the layers are subparallel to the fault plane (with a dip of 75°). The layers then have a dip that decreases downward to 45° (Figures 5 and 6). The main fault plane does not cross the layers located at the top of the outcrop. At this location, the layers have a dip of 30° towards the south.
Lower part of the Argence Fault on the outcrop. The layers are tilted but are not parallel to the fault plane. Very minor normal faults, confined to the layer, cut across the thin layers (b) and (d). The thickness of layers (a), (c) and (d) varies. Some very minor faults terminate with vertical fractures in the argillaceous strata (a).
Examples of the displacement profiles of secondary normal faults in the hanging wall (T1, T3, T5 and T7). Letters indicate the order of the faults according to the maximum displacement observed on each fault. The largest displacements were observed on the T3 and T9 faults. The smallest displacements were observed on the T2 and T7 faults.
Dip varies strongly (from 30° to 75°) between layers, according to their position relative to the fault plane. The dip of the layers in the footwall of the fault is weaker and consistent, not exceeding 10°, towards the south.
Displacement along the fault plane varies vertically. The throw is zero at the top (layer (e), Figure 5) and increases to the bottom of the outcrop, where it reaches 80 cm, the layer (a) being shifted by its thickness. Thus, displacement varies from 80 to 0 cm over a distance of about 1 m, revealing a strong gradient of displacement to the upper vertical tip of the master fault plane.
On the western side, the layers also have a higher dip in the hanging wall but are not parallel to the fault plane, having a dip of approximately 45°. The throw of level 5 reaches several meters along the fault plane.
4.2. Vertical tip of the main fault plane
The upper tip of the fault, analysed only on the eastern side of the road, is associated with a triangular apical zone characterized by more intense deformations (Figure 5). In this zone, layers (b), (c) and (d) (see framed Figure 5) are discontinuous. Several structural features are observed: (1) the layers become parallel to the main fault plane; (2) the basal limit of this zone corresponds to a subhorizontal fault not connected to the main plane of the fault and diminishing in the marly level (a); (3) the marly strata display schistosity; (4) the calcareous beds are sheared by fault planes of a length not exceeding the thickness of the bed; (5) the limestone beds are discontinuous.
4.3. Thinning of layers
Detailed observation of the outcrop shows a stretching of layer (a), which has undergone strong thinning associated with the activity of the fault (Figure 5). Its thickness also decreases in the footwall, albeit to a lesser extent, as it approaches the main fault plane. These features are characteristic of the process of smearing [Schmatz et al. 2010], corresponding to the stretching of the mechanically plastic levels along the faults.
Thinning phenomena are also visible at various sites in level 6, which is composed of alternating very thin beds of limestone and marly. However, no such thinning occurred in contact with the main fault. Thinning also affected layers (b), (c) and (d) above the upper tip of the fault (Figures 5 and 6). In these cases, the thinning phenomenon was not linked to the smearing mechanism.
4.4. Deformation in level 6
Level 6 (Figure 5) is composed of alternating limestone beds and marls, resulting in a strong mechanical contrast. The two main deformation patterns observed in this level are: (1) schistosity in the marls and (2) an antithetic shear with block rotation in the limestone beds. The schistosity is generally subparallel to the stratification, like that of layer (a) near the fault plane, with an orientation N080 50° S. The more calcareous beds are sheared, but they remain continuous. Boudinage is observed only in the zone located at the top of the fault.
The length of the shear planes does not exceed the thickness of the calcareous layer, but these planes sometimes extend into the underlying marls. At the limestone-marl boundary, some faults refract and change dip, becoming vertical, with a fine calcitic filling but no shearing (Figure 6). These faults then become vertical joints with a direction between N70 and 90, subparallel to the master fault on this section. The same type of fracture refraction is observed in the footwall, in which the layers dip slightly (10° to the south). These small normal faults have relatively low dips, below 60°, the usual angle for the formation of these planes in the shearing mode [Hancock 1985].
These normal faults were, therefore, tilted during the formation of the fold, indicating that their origin predates the folding. This is not the case for vertical joints filled with calcite, which are formed in the extensional mode [Hancock 1985]. Such joints are not tilted and must therefore have formed at the time of or after the tilting of the layers.
5. Secondary fault planes: observations
5.1. Main features
We recorded 33 faults on the eastern outcrop (Figure 4). These 33 fault planes included 12 planes of so-called “secondary” faults. There are nine secondary faults in the hanging wall (faults T1–T9, Figure 2) and three in the footwall (faults M1–M3, Figure 2). The 33 faults are also grouped into two directional families (Figure 4). The first contains faults with an average direction N95, identical to the local direction of the Argence Fault over this section. The second family consists of faults with an average direction of N115, approaching the regional fault direction. The faults with an average direction of N95 correspond to small-scale faults, whereas those with a direction of N115 correspond to plurimetric secondary faults. The direction of the secondary faults is closer to the regional direction of the Argence Fault and, therefore not parallel to the terminal part of the Argence Fault (Figure 2C).
Unlike the faults of the footwall, the secondary faults of the hanging wall cross the layers not cut by the main fault (layers of levels 6–9, see the lithological section in Figure 3). All the secondary faults of the hanging wall are antithetic to the main fault and their average dip tends to decrease as they approach the main fault. All the faults of the hanging wall and the footwall have an average dip of 60° when they are back-tilted (Figure 4), indicating an early formation, before the tilting of the layers. The secondary faults of the footwall have the same average direction as those of the hanging wall, but only fault M1 is antithetic being conjugated with fault M2.
Presence of faults not classified as secondary faults correspond to small planes restricted to a single level. Many of these small planes are located in level 4 of the footwall, and level 6 of the hanging wall. Most of those in level 4 of the footwall are conjugated and vertically restricted to this level, their propagation stopping in the two adjacent marly levels, 3 and 5. Some of these small non-vertical faults, sometimes dipping close to 60°, extend into the underlying marly level via a vertical joint containing calcite. However, this phenomenon is not systematic, and was also observed in marly level 5 of the hanging wall.
On the western outcrop, the 10 antithetical secondary faults in the hanging wall are spread over an equivalent distance (about 45 m) from the main fault plane and have similar characteristics, with displacements of the same order of magnitude, in particular.
5.2. Secondary fault displacement in the hanging wall
The displacement profiles of the secondary faults of the hanging wall were constructed from the eastern outcrop data (Figure 7). We used benchmark levels consisting of layers with similar lithological characteristics.
The pitch of the striae measured on these faults is close to 90° and the direction of the outcrop is subperpendicular to the direction of slipping on the faults. The measured fault throws correspond to the real values for slipping on the fault planes. The comparison of displacement values is relevant because the orientation of the outcrop and the direction of the faults do not change.
Faults, T2, T3, T4, T6 and T8 have a single fault morphology composed of a single plane. By contrast, faults T1, T9 and T5 appear to result from the connection of several segments, and fault T7 is composed of three unconnected segments (Figure 7).
The displacement profile of fault T1 includes peaks in the limestone layers (15 and 17). The fault is clearly visible in these layers but much less marked within the marly layers. This suggests that the segments of the fault originated from these limestone layers, with subsequent upward and downward propagation in the marly levels. The downward end of the fault is observable and located in a marly layer, indicating a blocking of downward propagation at this lithological level.
All the hanging-wall fault displacement profiles, except those for faults T7, T1 and T2, show increasing displacement towards the bottom of the outcrop. These profiles have no peak indicating the location on the fault at which displacement is maximal, corresponding to the site at which the fault was initiated [Kim et al. 2004]. These faults were not, therefore, initiated in the lithological levels observable on the outcrop. The shape of their displacement profiles indicates an upward propagation of the visible fracturing. The levels at which these faults were initiated are, therefore, lower in the lithological series. We were unable to observe the upper end of the faults, but we can assume that they are not much higher in the series because the displacements are close to zero at the top of the profiles, except for faults T3 and T9, the secondary faults for which displacement was greatest.
The maximum amount of displacement varies considerably between faults. Displacement is greatest for the T3 and T9 faults and lowest for the T2 and T7 faults. Fault T3 has a maximum displacement of almost 1.80 m and fault T9 has a maximum displacement of approximately 1.20 m. We can deduce that the amount of displacement on secondary faults is not related to distance from the main fault.
The secondary faults M1, M2 and M3 in the footwall have a maximum displacement of 1 m. The M1 and M2 are conjugated and cut across levels 4 and 5 on the outcrop. The M1 and M2 faults stop in marly level 3, whereas M3 cuts across this level.
We were unable to measure the displacements on the secondary faults of the western outcrop because this outcrop is not accessible for safety reasons. However, we were able to estimate these displacements from the cross-section. They were found to be of the same order of magnitude as those measured on the opposite outcrop. The main fault displays greater displacement on this outcrop than on the eastern outcrop, but the displacements on the secondary faults were no greater. We can, therefore, conclude that there is no direct relationship between the amount of displacement on the main fault and this of the secondary faults.
6. Discussion
By observing the eastern outcrop, we were able to analyze the vertical tip of a normal fault and to visualize the zone of deformation at its lateral tip. The observed structures are consistent with each other and their formation and evolution can be explained by the same deformation event.
The reorientation of the main fault plane observed at this location may reflect interactions with other fault segments of the regional fault network, such as the Chauvaux Fault.
The map shows that the Chauvaux Fault and the Argence Fault are unconnected and show no overlap. This does not convey a relay transfer zone between two normal faults with bending in the relay ramp as described for example by Childs et al. [2009]. In such a case, the main fault plane observed would be a “breaching fault” and the folding would therefore be due to the activity of the two faults. But in the absence of such a geometry, we can certainly attribute the monoclinal folding to the activity of the observed main fault.
The reorientation of the main fault plane at this location may be characteristic of a tip-damage zone in which the deformation would be associated with an increase in stress, with a local reorientation of the stress field [Cowie and Scholtz 1992, Peacock et al. 2017, Kattenhorn et al. 2000, Nixon et al. 2020].
6.1. Main fault plane
We have no means of determining the geometry of the fault at depth. Nevertheless, surface observations and previous investigations with analogous models [Withjack et al. 1989, 1995, Coleman et al. 2019] make it possible to formulate hypotheses about this geometry. It has been shown experimentally that fault shape influences the style of secondary faulting and folding. The normal faults forming above concave-upward fault bends are mostly antithetic, whereas those forming above low-angle fault segments and convex-upward fault bends are mostly synthetic. In these experimental models, numerous secondary normal faults form in the hanging wall of the master normal fault. Most of these secondary normal faults propagate upward and, consequently, have a greater displacement at depth. Antithetic faults were observed here over a large area of the wall, potentially indicating a change in the dip of the fault in depth, and suggesting a decrease in dip, in particular.
6.2. Vertical locking of master fault propagation
No cross-cutting of the layers above the fault was observed. Several field studies and experimental models have shown that monoclinal folding of this type occurs before upward propagation of the fault [Hardy and McClay 1999, Homberg et al. 2017, Jin and Groshong 2006]. The amplitude of folding is inversely proportional to the P/S ratio (P and S being the rate of fault propagation and the rate of fault displacement, respectively), and to the depth of the fault tip [Cardozo et al. 2005, Ferril et al. 2012, Johnson and Johnson 2002a, b]. Folding amplitude increases as the fault tip approaches the surface, gradually increasing with fault throw [Coleman et al. 2019], or when the velocity of fault propagation decreases with respect to the velocity of displacement [Martel and Langley 2006, Willsey et al. 2002]. The models show that finite strain in the apical fault zone is weak if P/S ratio is high, and strong if P/S ratio is low.
The layers form a monoclinal fold above the fault tip, with a very large volume of strained host rocks around the fault tip, and the displacement gradient at the tip of the fault is high. These features indicate that the upward propagation of the fault propagation has been blocked (low P/S ratio).
This blocking of propagation implies the presence of a mechanical barrier, generally corresponding to an incompetent lithological level [Soliva 2004, Coleman et al. 2019] and/or the presence of inherited structures, such as interacting fractures [Walsh, 2009]. Higher levels of stress are required for fault propagation than for the development of strain in the host rocks surrounding the fault tip.
Marl layer (a) has the characteristics of a barrier level. It was stretched during the smearing process [Ferril et al. 2012, Schmatz et al. 2010], resulting in variations in the thickness of the hanging wall, and, to a lesser extent, the footwall. Other levels of the same lithological composition located lower down in the sedimentary series (e.g. level 3) could also have served as barriers to propagation.
On the eastern outcrop, the hanging wall displays no signs of a preexisting inherited structure that would interact, in the vertical plane, with the fault plane during its upward propagation.
In the footwall, the M1 and M2 faults are conjugated and have been tilted with the layers during bending. They do not have the same direction as the main fault. These faults appeared in the layers before the main fault plane crossed them. They may therefore be considered to be secondary structures associated with propagation of the main segment and forming part of the damage zone. The synthetic fault M3 has not been tilted. The opportunities for observing this fault are limited, and its distance from the main fault plane seems to be too great for deformation to be associated with a dip relay zone between the main plane and this fault [Camanni et al. 2019].
The M1 fault is connected to the main plane at its apex. It is unclear to what extent an interaction between these two fractures could have blocked propagation of the main fault plane.
6.3. Development of host-rock deformation in the apical zone
The subhorizontal position of the small fault in the hanging wall nearest the tip of the main plane (Figure 5) can be explained by the rotation of this plane, which originally dipped by 60° (Figure 8). This small subhorizontal fault locally accompanied the tilting of the layers until they became parallel to the main fault plane. The activity of this fault would have been dependent on the downward stretching of marl layer (a), implying a normal displacement along the fault without vertical propagation of the rupture, but with an increase in folding. The stretching of the mechanical barrier, rotation of the small normal fault and normal displacement along the main plane are geometrically and kinematically linked mechanisms that can be considered to be synchronous (Figure 8).
Vertical propagation of the master fault (see explanation in the text). 8.1: Pre-extension. 8.2: The master fault is active. Development of deformation (fragile/ductile) in the layers near the top of the master fault. 8.3: Fault propagation stopped by a barrier level, but with sliding on the master plane. Development of the folding of the layers, tilting of the preexisting deformation structures. 8.4: Fault propagation blocked by the barrier level, increasing the intensity of the deformation (layers tending to be parallel to the fault plane, fracturing of the calcareous layers, schistosity in the marls and argillaceous layers, smearing, …). 8.5: Breaking of the barrier level, upward propagation of the master fault and amplification of the fault-propagation fold.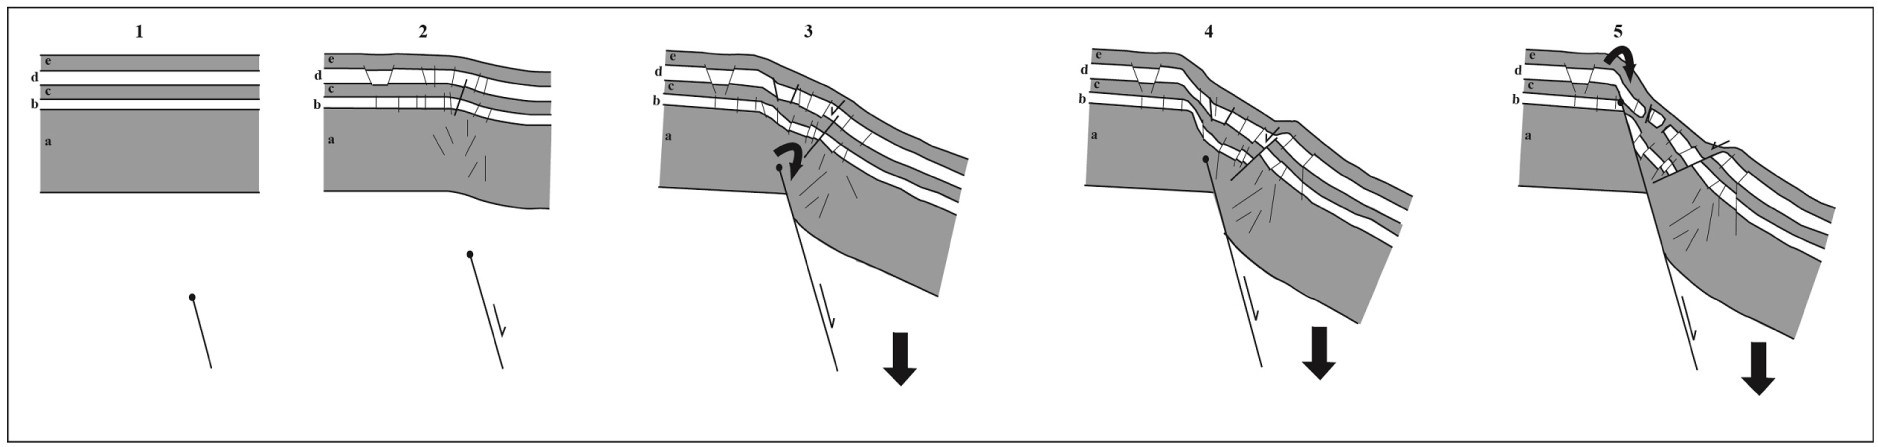
The layers underwent simultaneous folding, and the calcareous levels close to the fault tip fractured and became discontinuous through the process of boudinage. This phenomenon is favored by a context of high mechanical contrast [Schmatz et al. 2010].
It is difficult to determine whether the entire set of deformation patterns is associated with one or more blocking episodes, because the entire lithological series contains several levels similar to and thicker than level 5. However, in all cases, strain structures appeared in the layers before propagation of the fault occurring within them.
6.4. Nucleation and development of secondary faults
In the hanging wall, the secondary normal faults initiated and propagated into the layers not crossed by the main fault plane. The displacement profiles of the T1–T9 faults provide information about the site of nucleation for these faults.
The lowermost end of fault T1 lies in level 5, and its uppermost end is in level 7. The throw of T1 is maximal at level 6. We can therefore conclude that T1 was initiated at level 6, above the barrier layer (a).
The downward termination of the T3 fault is not visible on the outcrop. The maximum throw of T3 is the largest of any of the secondary faults. Nucleation at level 5 is unlikely, due to the ductile behavior of this level, which is incompatible with brittle fracturing. Initiation at level 4 also seems unlikely, because this would imply that T3 crossed the barrier level (level a). It therefore seems likely that the nucleation of this fault occurred in level 6.
Faults T4, T5 and T6 cross levels 6, 7 and 8 on the outcrop. Their visible maximal throws are between 60 and 90 cm and their displacement profiles reveal upward propagation. Their nucleation must have occurred at lower levels in the lithological series, probably in the lowest layers of level 6, above the barrier at level 5.
The T8 and T9 faults are visible in levels 7 and 8. They have a listric fault morphology, with a dip that decreases in the downward direction. Their profiles in of displacement indicate upward propagation. We can therefore assume that T8 and T9 appeared in level 7. This is also the case for the T7 fault, which consists of three unconnected segments located in levels 7 and 8.
The secondary faults of the hanging wall were initiated in levels 6 or 7, above level 5, which would have constituted a barrier to fault growth. These faults were initiated at levels above the main fault plane and are part of the main fault damage zone (as in the footwall).
6.5. Model of fault-zone development
Based on the field observations and our interpretations, we propose a conceptual model of the last stages of development of the studied fault zone (Figure 9). Deformation in the apical zone of the main fault plane (Figure 8) and the nucleation of secondary faults are linked to the upward restriction of the master fault plane (Figure 9).
Cross-sections illustrating the conceptual model for the style and sequence of deformation during the last stages of fault growth based on field observations.(A) The master fault is confined by a barrier level, monoclinal folding begins and the first secondary normal faults are initiated in the stratigraphic cover above the barrier level. The rectangle at the top of the master fault refers to Figure 8.3. (B) The master fault is blocked by the barrier level; fault activity occurs without vertical propagation. Development of the monoclinal fold with an increase in the amplitude (thickening of the damage zone) and the dip of the fold limb, generating a tilting of the first secondary normal faults. Initiation and development of the other “secondary” normal faults in the hanging wall. The rectangle at the top of the master fault refers to Figure 8.4 (thickening of the core zone). (C) Breaking of the barrier level and upward propagation of the master fault.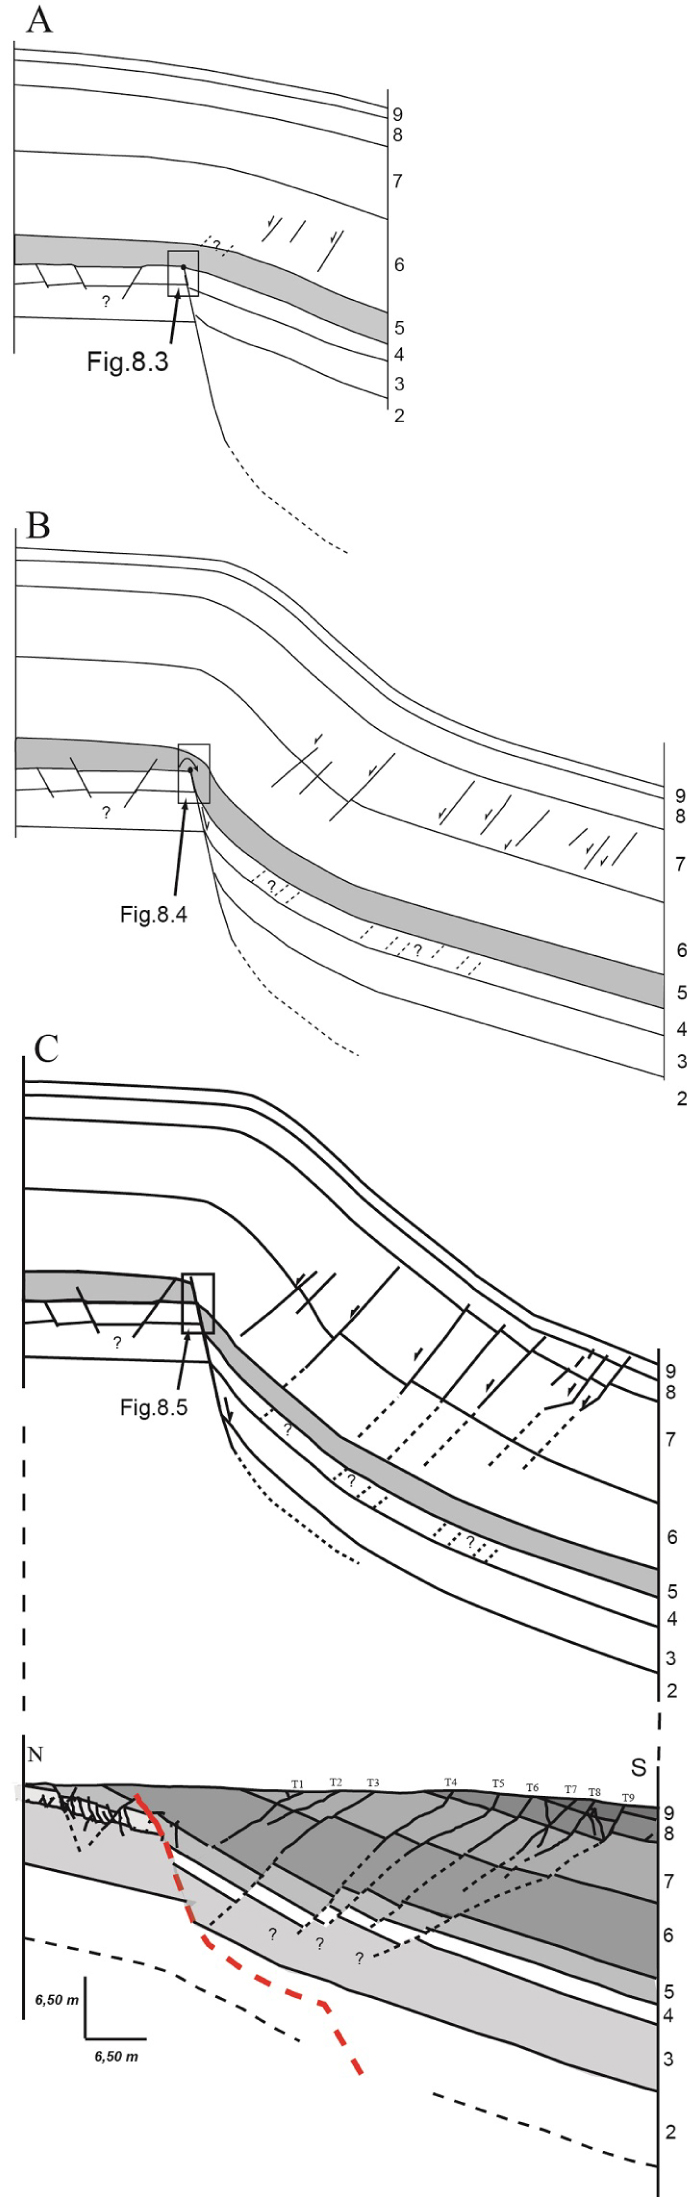
The number of secondary faults and their distribution suggest that several blocking episodes may have occurred at barrier levels located lower down in the lithological series (and thus not visible on the outcrop; Figure 3). We deduce that the final blocking episode is that associated with level 5. The nucleation of the secondary faults is not necessarily associated with this last episode which would have contributed to its development.
Secondary faults developed in association with the upward propagation of the master fault plane and the migration of the “process zone” [Williams and Chapman 1983, Willsey et al. 2002]. We can assume that the first secondary faults to be initiated and developed were those that can be observed today cutting across the lowest levels in the lithological series. Thus, T1, T2 and T3 were probably the first secondary faults to form (Figure 9). The main fault plane then propagated to a new barrier level, accentuating the folding of the layers and moving the process zone to higher levels in the series, in which the other secondary faults (T4–T9) developed. Folding then caused the first secondary faults to tilt, as observed on the outcrop. The amplification of folding caused the secondary faults to be rotated and translated, to become inactive and to accommodate further strain within the fold, leading to the formation of new secondary faults [Coleman et al. 2019].
There is no relationship between the amount of displacement on the secondary faults and distance to the main fault. The T3 and T9 faults have the largest throws. They were initiated at different levels and were active at different times.
In the footwall, the M1 and M2 secondary faults are restricted to level 4. This level is flanked by two thick marly levels. We can conclude that M1 and M2 were initiated in the level 4, which is more mechanically competent. This fracturing occurred when the layers were still horizontal, before this level was crossed by the main fault. It also results from an episode of blocking of the Argence Fault.
The analysis of the secondary faults showed that these faults were not initiated from the main fault, as suggested in some modelling studies [Withjack et al. 1990]. Connections of the secondary fault planes with the main fault are not systematic and depend on the conditions in which the main fault develops, particularly lithology.
This relationship between the main fault and the secondary faults is important, because it largely governs fluid transfers in the faulted rock volume [Faulkner et al. 2010]. Fluid transfers between the fault damage zone and the fault core zone depend on the degree of connection between the main and secondary faults.
7. Conclusion
The growth of the Argence Fault into a multi-layered series with contrasting lithological features has been blocked vertically (and possibly laterally). Several blocking events have occurred, resulting in the development of a large asymmetric damage zone in the faulted rock volume. Observations of the upper tip of the fault provide insight into the mechanisms of brittle and ductile deformation leading to the physical and mechanical modifications of the host rocks and decreasing the breaking strength of the rock required for rupture propagation.
Strain intensity decreases along a gradient moving away from the main fault. Near the fault plane, deformation results in (1) smearing affecting the barrier levels, (2) schistosity in marly levels, (3) the shearing and tilting of blocks in limestone beds (4) boudinage through stretching in the most deformed limestone levels, (5) thinning of ductile layers (by an as yet unknown mechanism) and (6), rotation of the strata.
In the wider area around the Argence Fault, the deformation consists of (1) monoclinal folding of the layers and (2) the development of a network of secondary normal faults parallel to each other, but not to the main fault plane, accommodating the strain within the growing fold. The host rock was deformed before the main fault crossed it. The secondary fault planes were not initiated from the main fault plane, and their connection with this fault plane is not systematic. These faults developed later, mostly through the upward and downward propagation of the hanging wall, but not necessarily with connection to the main fault plane.
For the sake of completeness and to check certain elements advanced in our analysis, we would require access to information about the geometry of the deformation at depth. Moreover, the coupling of folding with normal fault growth is observed in other areas of the region: further west towards the town of Jarnac and further north towards the town of Mansle, for example. It would be interesting to study these other regional faults, to compare the mechanisms involved in their growth, their relationships with their tectonic context, their lithological sequences and their potential impact on structural permeability and fluid transfers in the lithological series.
Conflicts of interest
Authors have no conflicts of interest to declare.
Acknowledgements
We thank the anonymous reviewers for their constructive comments which greatly improved our manuscript.