


 CC-BY 4.0
1. Introduction
In Brazil, latosols occupy an area of about 2,835,000 km2 which corresponds to one third of the Brazilian territory [Ker 1997, Silva et al. 2005]. They are characterized by minor differentiation of their horizons, low-activity clay (i.e. dominated by 1:1 clay minerals), a weak macrostructure, and a strong submillimetric granular structure [Embrapa 2006]. These soils correspond to the end of a geochemical sequence of weathering [Melfi and Pédro 1977, 1978, Pédro 1968]. The latosols in the Brazilian taxonomy [Embrapa 2006] correspond mainly to oxisols and to ultisols in the Soil Taxonomy [Soil Survey Staff 2006]. They correspond to ferralsols in the World Reference Base [IUSS Working Group WRB 2015]. Latosols are defined in Brazilian taxonomy by the presence of a diagnostic Bw horizon between the surface and 200 cm depth [Embrapa 2006]. The main geochemical process occurring in latosols is intense hydrolysis with almost total removal of alkaline and alkaline-earth cations and very high silica removal resulting in the formation of 1:1 clay minerals. This hydrolysis causes a release of the cations that are leached to form 1:1 clay minerals in mixture with iron and aluminum oxi-hydroxide [Melfi and Pédro 1977, 1978]. As a consequence, the clay fraction of the Bw horizon is characterized by the presence of kaolinite, gibbsite, goethite and hematite in varying proportions depending on the parent material and landscape position [Curi and Franzmeier 1984, Macedo and Bryant 1987, Ker 1997, Reatto et al. 2000, 2008, Reattoet al. 2010, Schaefer et al. 2008].
However, according to the Brazilian taxonomy [Embrapa 2006], although latosols are thick to very thick soils resulting from intense weathering of minerals present in parent materials, muscovite can be found in small amounts in the coarse fraction of the Bw horizon, whereas silt and clay fractions may contain very small amounts of 2:1 clay minerals such as illite and smectite as shown in many studies using X-ray diffraction (XRD). Since the 1970s, Lepsch and Buol [1974] studied soils located in the São Paulo state developed on basic extrusive rocks and showed the presence of chlorite/vermiculite intergrade minerals in the coarse clay fraction of the Bw horizon of a latosol. Later, Antonello [1988] recorded hydroxy-Al interlayered vermiculites (HIVs) in latosols developed on a large range of parent materials in different regions of Brazil but did not consider their origin. Ker and Resende [1990] also found HIVs in latosols developed on basalt in Southern Brazil and recorded an inverse relationship between HIV and gibbsite content. Ker [1995] found HIVs in latosols developed on limestone and amphibolite and assumed that they resulted from the transformation of mica or chlorite present in the parent material. Rodrigues Netto [1996] found HIVs in latosols developed on several parent materials and concluded that their presence was independent of the relative weathering intensity. Furian et al. [2002] analyzed the distribution of kaolinite–gibbsite horizon soils located in southeastern Brazil and developed on weathered Precambrian granite–gneiss rocks. They found traces of Al-vermiculites in the studied horizons using XRD. Melo et al. [2004] observed the presence of mica and feldspar minerals in the silt fraction of the Bw horizon of latosols developed on a weathered basalt as well as the presence of 2:1 clay minerals with hydroxy interlayer material. Soares et al. [2005] studied the mineralogy and ion exchange properties of the particle size fractions of Brazilian soils, some of which were latosols. They found mica and feldspars in the sand, silt and clay fractions in some of the latosols studied, but their respective proportions were not determined. Maquere et al. [2008] studied the dynamics of mineral elements under eucalyptus plantations in latosols developed on cretaceous sandstones and analyzed the contribution of HIVs to the cation exchange capacity of the soil and to the production of mineral elements to the soil solution by their weathering. In their review of the mineralogy of the clay fraction of latosols, Schaefer et al. [2008] focused on low-activity clay minerals and iron and aluminum oxyhydroxides, and mentioned the presence of significant amounts of HIVs in some latosols developed on basalts in southern Brazil. Pereira et al. [2010] studied the mineralogy of latosols developed on weathered pelitic rocks and recorded small amounts of illite and HIVs in the Bw horizons using XRD as earlier shown by Brito Galvão and Schulze [1996] in similar latosols of the Minas Gerais. Reattoet al. [2010] studied the Bw horizons of ten latosols developed on different parent materials along a 350 km long regional toposequence across the Central Plateau. They found HIVs in the clay fraction of six of them. Traces of HIVs were again found very recently, associated to traces of illite, by Almeida et al. [2021] in latosols located in the Minas Gerais state. Marques et al. [2011] studied the mineralogy of the clay fraction of latosols developed on a large range of parent materials using XRD and HIVs were only found in the clay fraction of latosols developed on basalts but their origin was not discussed. Bertolazi et al. [2017] identified 2:1 clay minerals in the top 40 cm of latosols that appeared to be vermiculite or HIVs. Pacheco et al. [2018] studied the mineralogy, micromorphology and genesis of soils developed on weathered precambrian migmatized paragneiss and found traces of vermiculite and HIVs in the soils studied, two of which were latosols. As part of their study of the soil properties governing phosphorous adsorption in soils of Southern Brazil, Oliviera et al. [2020] found small amounts of 2:1 clay minerals by using XRD. They were present in the twenty latosols studied.
Few authors identified 2:1 phyllosilicates in latosols using other methods than XRD alone. Caner et al. [2014] studied soil clay formation in a Ferralsol developed on a weathered basalt in southern Brazil combining XRD, chemical extraction and Fourier transform infrared spectroscopy and determined the presence of hydroxy-Al-interlayered minerals originating from aluminization of smectite present in the saprolite under acidic conditions. Brito Galvão and Schulze [1996] studied the mineralogy of the silt and clay fraction of latosols developed on limestone and siltstone rocks by combining differential X-ray diffraction and transmission electron microscopy coupled with energy dispersive X-ray analysis. They showed the presence of K in addition to Si, Al and Fe in platy and angular individual particles of the 1–5 μm fraction which corresponded to dioctahedral mica particles identified on the X-ray diffraction patterns. They also showed traces of dioctahedral micas and HIVs in the <5 μm fraction throughout the 2 m of the profile that appeared to result from mica weathering. Costa et al. [2004] applied both XRD and thermal analysis to the <2 μm fraction of a large range of Brazilian soils and determined the presence of small amounts of 2:1 clay minerals in latosols developed on magmatic rocks and estimated their mean content in the <2 μm fraction at 78.0 g⋅kg−1 and the mean content of gibbsite, kaolinite and Fe2O3 at 130.9, 605.5 and 185.5 g⋅kg−1, respectively.
While the presence of micas and 2:1 clay minerals has been frequently recorded in latosols developed on a wide range of parent materials, their particle morphology, chemical composition and origin remain unclear. On the basis of the studies carried out which were essentially based on X-ray diffraction analysis, these minerals are, according to the authors, (i) either neoformed within the Bw horizons of latosols, HIVs resulting from the direct formation of 2:1 clay minerals with interlayer Al from the soil solution rich in Al [e.g. Bertolazi et al. 2017, Bortoluzzi et al. 2008, Karathanasis et al. 1983, Volkoff and Melfi 1980], (ii) or related to bioturbation produced by termites and ants which take material from the saprolite and bring it up to the Bw horizons of latosols [Freitas et al. 2021, Schaefer 2001]. In this context, the objective of the present study was (i) to describe the microstructure of selected Bw horizons of latosols by using backscattered electron scanning images (BESI) of polished sections, (ii) to identify 2:1 minerals in the BESI of the groundmass at high magnification, (iii) to describe their morphology, (iv) and to analyze their chemical composition using energy-dispersive X-ray spectroscopy (EDS). These data will enable discussion of the characteristics and origin of the 2:1 clay minerals in the Bw horizons of the latosols studied, and of the origin of their submillimetric granular structure.
2. Materials and methods
2.1. The soils
The latosols studied are located in the Brazilian Central Plateau which covers about 10% of the continuous Cerrados Biome [Silva et al. 2005]. The Central Plateau presents two main geomorphologic surfaces: the Late Tertiary South American Surface (SAS) (900 to 1200 m high) corresponding to tablelands where gibbsitic-sesquioxidic latosols are dominant and the Late Quaternary Velhas Surface (VS), which occurs 5 to 25 m below the SAS and shows a moderate slope, convex forms and covers smaller extensions than the SAS where kaolinitic-non-sesquioxidic latosols are numerous [King 1956, Motta et al. 2002, Marques et al. 2004, Reatto et al. 2009]. The most representative climate of the Central Plateau is megathermic or humid tropical (Aw) with the savanna subtype [Köppen 1931]. It is characterized by a dry winter (average temperature of the coldest month >18 °C) and maximum rains in summer. The average annual rainfall ranges from 1500 to 2000 mm, with the highest amounts of rainfall occurring in January and the lowest in June, July, and August ( <50 mm per month) [Assad et al. 1993].
Two Bw horizons were selected in the latosols studied by Reatto et al. [2007, 2008, 2009], Reattoet al. [2010] along a 350 km long regional toposequence in the Central Plateau. One Bw horizon was collected in a latosol located on the South American Surface (LSAS) and developed on a saprolite of a precambrian sandy metarithimite [Campos 2012, Campos et al. 2013] mainly composed of quartz and kaolinite as shown using XRD [Reattoet al. 2010]. The latter study did not show the presence of micas or 2:1 clay minerals [Reattoet al. 2010]. This Bw horizon corresponds to the horizon Bw2 (115/120–200+ cm) of the gibbsitic-sesquioxidic latosol L2 studied by Reatto et al. [2007, 2008] (Table 1). Cavities related to termite activity were moderately present (Table 1). Mineralogical study of the <2 μm fraction using XRD did not show the presence of HIVs [Reattoet al. 2010]. The other Bw horizon was collected in a latosol located on the Velhas Surface (LVS) and developed on a saprolite of a Precambrian clayey metarithimite [Campos 2012, Campos et al. 2013] where muscovite was present as shown by XRD [Reattoet al. 2010]. It corresponds to the horizon Bw1 (57/90–90/120 cm) of the kaolinitic-non-sesquioxidic latosol L5 studied by Reatto et al. [2007, 2008] (Table 1). Cavities related to termite activity were moderately present (Table 1). Mineralogical study of the <2 μm fraction using XRD showed the presence of HIVs [Reattoet al. 2010]. The two Bw horizons collected show a weak macrostructure and a strong submillimetric granular structure (Table 1). LSAS and LVS are highly clayey (clay content of 610 and 550 g⋅kg−1, respectively) and exhibit a low bulk density (0.90 and 1.03, respectively) (Table 2). The cation exchange capacity is higher in LSAS (10.60 cmol(+)⋅kg−1) than in LVS (3.19 cmol(+)⋅ kg−1) with most exchangeable cations corresponding to H+ and Al3+ cations (Table 2).
Field morphological descriptions of the latosols studied [modified after Reatto et al. 2007, 2008]
| Latosol | Horizon | Depth, Cm | Matrix Munsell color | Compound structure | DIRV | Biological macrovoids | ||
|---|---|---|---|---|---|---|---|---|
| Dry | Wet | Channels roots | Channels and cavities related to termites | |||||
| Red latosol(1)–Typic Acrustox(2)–Orthic Ferralsol (3)/elevation: 1200 m (S 15° 37′127′′; W 47° 45′576′′) | ||||||||
| LSAS | A | 0–15 | 7.5YR 3/4 | 5YR 3/3 | (1)3cSBK; (5)3fGR | ( + −)fD | (+)CH | No |
| AB | 15–35/40 | 7.5YR 5/6 | 5YR 4/4 | (1)3cSBK; (4)3m-fSBK; (4)3fGR | ( + + + +)vcLC | No | No | |
| BA | 35/40–60/80 | 5YR 5/8 | 2.5 YR 4/6 | (1)2c-mSBK; (2)2fSBK; (5)2f-vfGR | ( + ++)vcD; ( + +)mLC | (+)CH | (+)CV | |
| Bw1 | 60/80–115/120 | 5YR 5/6 | 2.5 YR 4/8 | (1)1cSBK; (3)1fSBK; (4)2-3f-vfGR | ( + +)fD | No | (+)CV | |
| Bw2 | 115/120–200+ | 5YR 5/6 | 2.5 YR 4/8 | (1)1cSBK; (5)3f-vfGR | ( + −)fD | No | ( + +)CV | |
| Red latosol(1)–Typic Acrustox(2)–Orthic Ferralsol(3)/elevation: 920 m (S 15° 36′502′′; W 47° 42′813′′) | ||||||||
| LVS | A | 0–11/20 | 5YR 5/6 | 5YR 5/7 | (1)3cSBK; (4)3f-mSBK; (2)3vfSBK; (3)3f-vfGR | ( + ++)fLC | (+)CH | No |
| AB | 11/20–35/40 | 7.5 YR 4/6 | 5YR 4/6 | (1)3-2c-mSBK; (4)3fBSK; (4)2-3fGR | ( + ++)fD | (+)CH | No | |
| BA | 35/40–57/90 | 5YR 4/6 | 2.5YR 2,5/4 | (2)2mSBK; (3)3fSBK; (4)3-2fGR | ( + ++)fD; ( + +)c-mLC | (+)CH | ( + +)CV | |
| Bw1 | 57/90–90/120 | 5YR 5/8 | 2.5YR 3/6 | (2)2mSBK; (1)3-2fSBK; (5)3-2fGR | ( + +)fD | (+)CH | ( + +)CV | |
| Bw2 | 90/120–170 | 5YR 5/8 | 2.5YR 4/8 | (2)2fSBK; (5)3f-vfGR | ( + −)fD | No | (+)CV | |
| Bw3 | 170–200+ | 2.5YR 5/8 | 2.5YR 4/8 | (1)1c-mSBK; (2)2-1f-mSBK; (5)3f-vfGR | ( + −)fD | No | No | |
LSAS = Latosol located on the South American Surface; LVS = Latosol located on the Velhas Surface.
Structure description: (frequency–grade–size–type).
Frequency: (0) rarely: <1% of volume; (1) very little: 1 to 5% of volume; (2) little: 5 to 15% of volume; (3) common: 15 to 40% of volume; frequent (4): 40 to 80% of volume; dominant (5): >80% of volume. Grade: 1—weak; 2—moderate; 3—strong. Size of granular structure: vf—very-fine ( <1-mm); f = fine (1 to 2-mm); m = medium (2 to 5-mm); c = coarse (5 to 10-mm); vc = very-coarse ( >10-mm). Size of subangular blocky: vf—very-fine ( <5-mm); f = fine (5 to 10-mm); m = medium (10 to 20-mm); c = coarse (20 to 50-mm); vc = very-coarse ( >50-mm). Type: GR = granular; SBK = subangular blocky.
DIRV (Dense Irregular sub-Rounded Volumes) description: (frequency/grade–size–type). Frequency/grade: ( + + + +) = very strong; ( + ++) = strong; ( + +) = moderate; (+) = weak; ( + −) = very weak; no = not observed. Size of DIRV described as subangular blocky structure. Type: D = dispersed DIRV; LC = locally concentrated DIRV.
Biological Activity description: (frequency/grade–size–type). Frequency/grade and size of biological activity described as DIRV. Type: CH = channels; CV = cavities.
Soil Type: (1) Brazilian Soil Taxonomy [Embrapa 1999], (2) Soil Taxonomy [Soil Survey Staff 2006], (3) World Reference Base [IUSS Working Group WRB 2015].
Physical and chemical characteristics of the two horizons LA1 and LA2 studied [modified after Reatto et al. 2007, 2008]
| Horizon | Particle size distribution | Db (g⋅cm−3) | Dp (g⋅cm−3) | pHw | pHKCl | OC (g⋅kg−1) | Exchangeable cations | CEC (cmol(+)⋅kg−1) | Oxyde content | ||||||||||
|---|---|---|---|---|---|---|---|---|---|---|---|---|---|---|---|---|---|---|---|
| <2 μm (g⋅kg−1) | 2–50 μm (g⋅kg−1) | 50–2000 μm (g⋅kg−1) | Ca2++Mg2+ (cmol(+)⋅kg−1) | K+ (cmol(+)⋅kg−1) | Na+ () | Al3+ (cmol(+)⋅kg−1) | H+ + Al3+ (cmol(+)⋅kg−1) | SiO2 (g⋅kg−1) | Al2O3 (g⋅kg−1) | Fe2O3 (g⋅kg−1) | TiO2 (g⋅kg−1) | ||||||||
| LSAS | Bw2 | 610 | 140 | 250 | 0.90 | 2.76 | 5.30 | 6.20 | 0.61 | 0.16 | 0.00 | 0.00 | 0.00 | 10.44 | 10.60 | 187 | 565 | 225 | 23 |
| LVS | Bw1 | 550 | 150 | 300 | 1.03 | 2.76 | 4.80 | 4.00 | 0.62 | 0.23 | 0.04 | 0.00 | 0.29 | 2.92 | 3.19 | 339 | 442 | 206 | 13 |
LSAS = Latosol located on the South American Surface; LVS = Latosol located on the Velhas Surface; Db = bulk density; Dp = particle density; OC = Organic carbon; CEC = Cation exchange capacity; SiO2, Al2O3, Fe2O3 and TiO2 contents were determined by H2SO4 dissolution.
2.2. Scanning electron microscopy and energy dispersive spectroscopy
Both polished and carbon coated sections were prepared using a polyester resin according to Bruand et al. [1996] using undisturbed samples collected in the LSAS and LVS with 100 cm3 volume cylinders.
Scanning electron microscopy (SEM) was performed to describe the structure of LSAS and LVS using backscattered electron scanning images (BESI) at low magnifications ranging from ×35 to ×200 and high magnification ranging from ×1000 to ×8000 to identify particles of phyllosilicates and then to explore their chemical composition as well as that of the surrounding groundmass. The scanning electron microscope (SEM) used was a Merlin Compact Zeiss microscope equipped with a Gemini I column including a backscattered electron detector (BSD) with five quadrants for backscattered electron scanning images (BESI). The assembly of BESI recorded at low magnification makes it possible to have a mosaic image made of 50 images for LSAS and 46 images for LVS formed from the first micrometers of the sample, thus allowing the structure to be observed on large areas as done earlier by Reatto et al. [2009] in optical microscopy.
Chemical analyses of the particles of phyllosilicates identified on the BESI were performed using energy dispersive X-ray spectroscopy (EDS) with a Quantax XFlash6 Bruker detector enabling a resolution of 129 eV. Observations and analyses were performed at 15 kV accelerating voltage and at a working distance of 10 mm. The SEM operated with a resolution of 0.8 nm at 15 kV acceleration voltage. A probe current of 1.6 nA and 100 s count time were used. Total chemical composition was expressed on the basis that the sum of oxide mass equals 100 for determinations of SiO2, Al2O3, Fe2O3, MgO, CaO, K2O, and Na2O and TiO2. They were also projected in ternary plots to show the Al2O3, SiO2 and K2O + Na2O + CaO contents. The acquisition time of EDS analyses was 100 s per zone analyzed.
3. Results and discussion
3.1. Development of the microgranular structure
Observation of the structure at different magnifications enabled to identify two types of structure. Areas with a strong microgranular structure with highly to moderately separated microaggregates (zone 1, Figures 1 and 2) and areas with a moderate to weak microgranular structure with coalesced microaggregates (zone 2, Figures 1 and 2) were observed in the polished sections of LSAS and LVS. The areas with a strong microgranular structure with highly separated microaggregates correspond to the strong fine to very fine granular structure described in the field (Table 1), while the areas exhibiting a microgranular structure with coalesced microaggregates correspond to a moderate to weak microgranular structure. The latter area corresponds to the dense irregular sub-rounded volumes (DIRV) described in the field as medium (10 to 20 mm) to coarse (20 to 50 mm) subangular blocky structures without any visible difference in composition with the surrounding microaggregated material (Table 1).
Observations of backscattered electron scanning images (BESI) of polished sections of LSAS (a) and LVS (b) showing areas with a strong microgranular structure (1) and with a moderate to weak microgranular structure (2).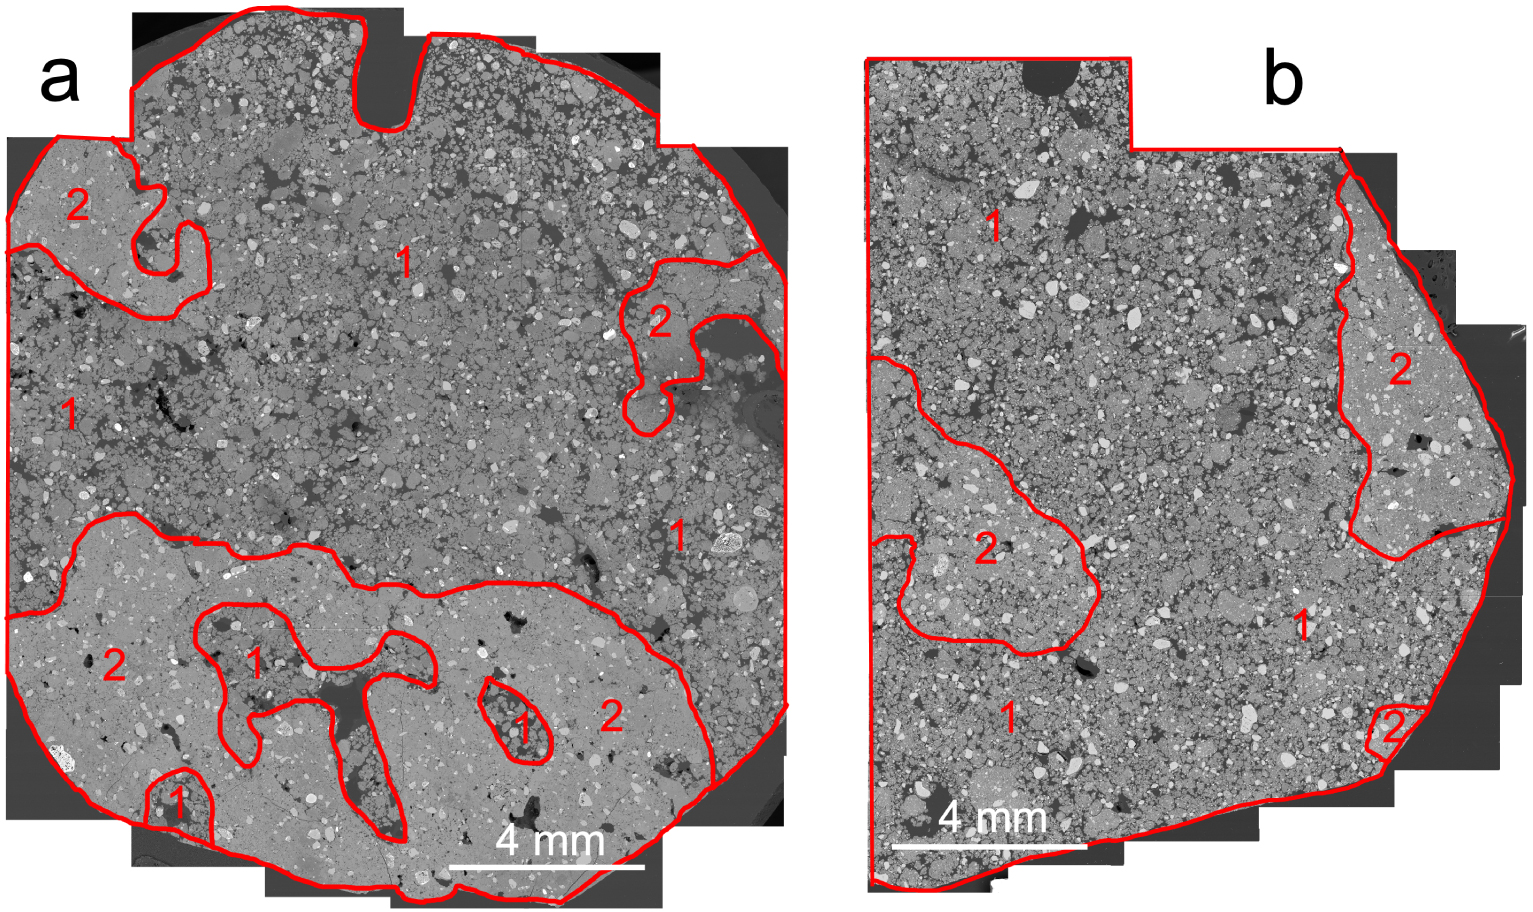
Strong microgranular structure in LSAS (a) and LVS (b) and moderate to weak microgranular structure in LSAS (c) and LVS (d) observed on backscattered electron scanning images (BESI) of polished sections.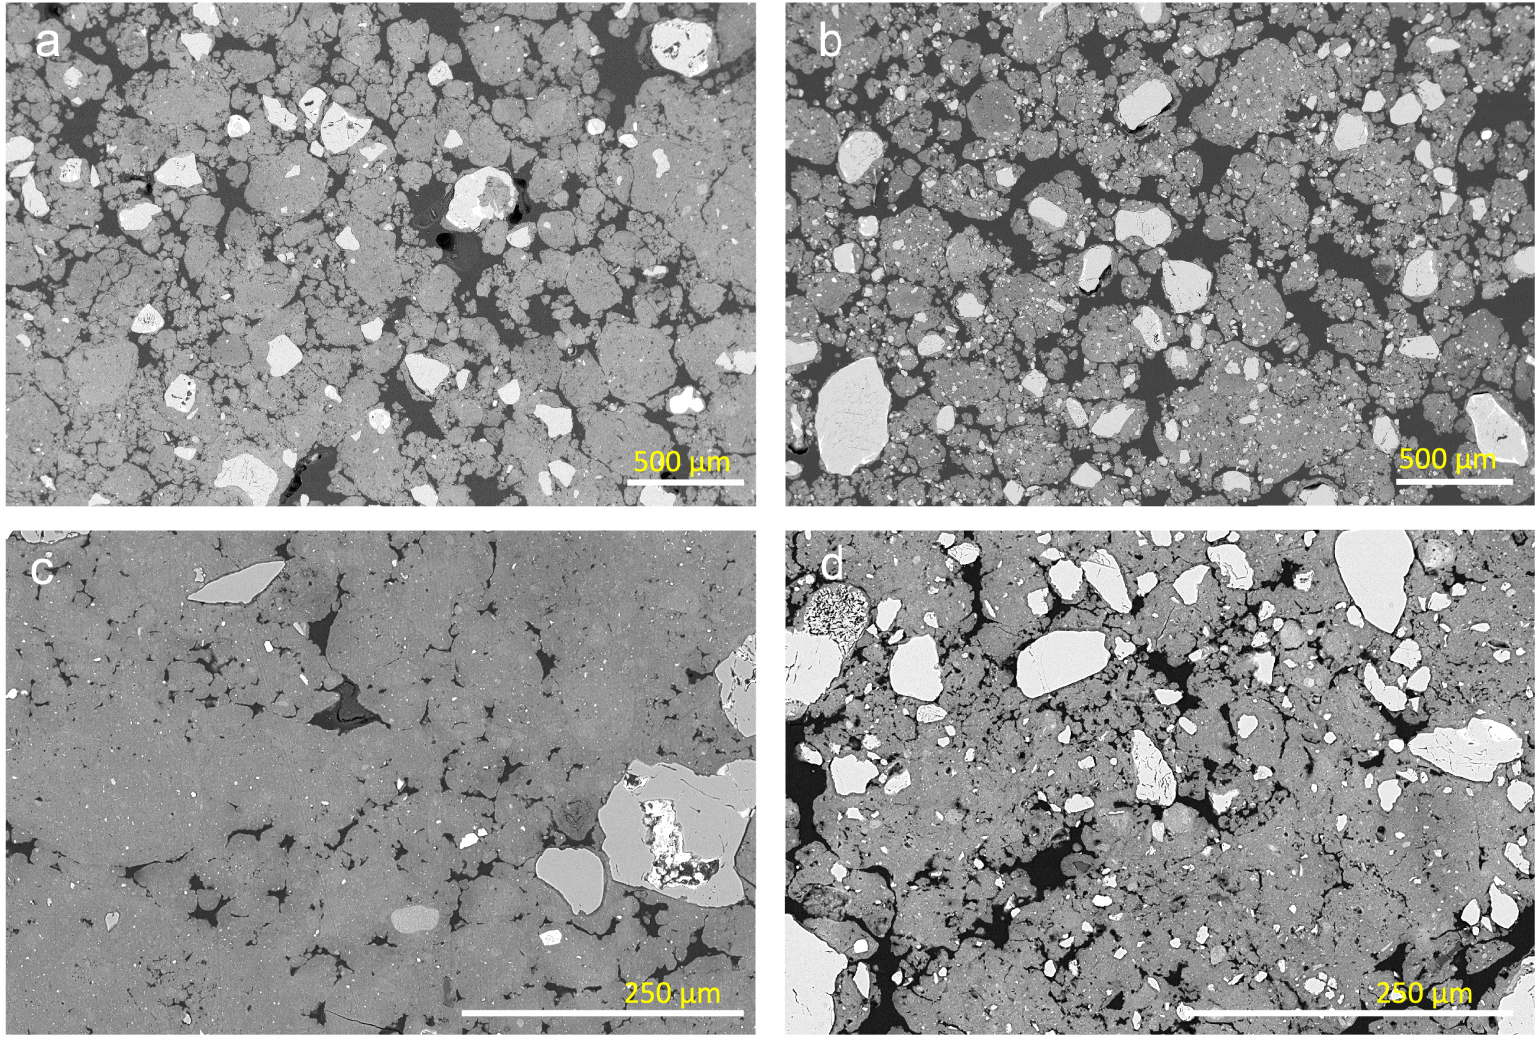
Similar areas with coalesced microaggregates associated with areas having a strong microgranular structure with highly to moderately separated microaggregates were earlier described by Gomes et al. [2004] on thin sections of Bw horizons of clayey latosols located on the South American and Velhas geomorphic surfaces in the Cerrado Biome. They were again described very recently by Pessoa et al. [2022] in latosols presenting different degrees of microgranular structure development as shown on the thin sections studied and the proportion of aggregates 8–16 mm in diameter measured in the Bw horizons.
Volumes of soils with similar characteristics to those of the DIRV identified in the field (Table 1) were also very early described in microaggregated soils similar to latosols in Africa and described as “hard compact lumps” [Webster 1965] which “disintegrate readily under light finger pressure” [Trapnell and Webster 1986] into much smaller aggregates. The proportion of the two types of microstructure was shown by Volland-Tuduri et al. [2005] to be closely related to bulk density in the clayey latosols studied earlier by Balbino et al. [2002, 2004]. The smaller bulk density (Db) recorded in LSAS (0.90) compared to LVS (1.03) indicates a stronger microgranular structure in LSAS but may also be partly related to the higher clay content recorded in LSAS (Table 2). However, Reatto et al. [2009], using mercury porosimetry, recorded a higher pore volume resulting from the packing of the microaggregates in LSAS (0.536 cm3⋅g−1) than in LVS (0.453 cm3⋅g−1), which is consistent with a stronger microgranular structure and smaller Db in LSAS than in LVS.
3.2. Origin of the microgranular structure
Although the microgranular structure has long been recognized in latosols, no consensus has yet been reached to explain its origin [Marcelino et al. 2018]. Two main origins have been proposed: either that it results mainly (i) from physico-chemical processes combining mechanical fragmentation of a compact soil material due to alternating wetting and drying in relation to change in physico-chemical interactions between kaolinite and iron oxyhydroxides [e.g. Cooper et al. 2005, Karathanasis et al. 1983, Melfi and Pédro 1977, 1978, Volkoff and Melfi 1980], or (ii) from bioturbation processes related to long term soil faunal activity, particularly termite activity [e.g. Jouquet et al. 2016, Marcelino et al. 2018, Reatto et al. 2009, Schaefer 2001].
Among the data supporting a biological origin for the microgranular structure there are the numerous microscopy observations showing that many microaggregates of latosols are similar in size, shape and internal structure to the pellets produced by termites to build their nests and mounds [Cosarinsky et al. 2005, Eschenbrenner 1986, Jungerius et al. 1999]. The respective distribution of the two types of microstructure as shown in Figure 1a is consistent with a microstructure development in the horizons resulting from faunal activity, as earlier discussed by several authors for latosols [e.g. Cooper et al. 2005, Reatto et al. 2009, Schaefer 2001, Stoops 1983]. According to Reatto et al. [2009], the moderate to weak microgranular structure with coalesced microaggregates corresponds to portions of channel or cavity walls similar to those described early by Eschenbrenner [1986]. Moreover, according to Stoops [1983], Schaefer [2001], Cooper et al. [2005] and Reatto et al. [2009], the strong microgranular structure originates from an infilling activity with microaggregates resulting from fragmentation and the burrowing action of termites and possibly also of ants. Holt and Lepage [2000] discussed soil bioturbation by termites during mound-building, and the construction of cavities and galleries and suggested that the soil properties of latosols result from soil translocation and soil turnover. Along the same lines, Schaefer [2001] proposed that the microgranular structure of latosols results from long-term termite activity.
3.3. Morphology of the phyllosilicate particles
Elongated large particles observed on the BESI of the cross section of LSAS and location of the analysis performed by using energy dispersive spectroscopy (EDS) in the elongated particles selected. The numbers correspond to the analysis numbers in Table 3.
Elongated small particles observed on the BESI of the cross section of LSAS and location of the analysis performed by using energy dispersive spectroscopy (EDS) in the elongated particles selected. The numbers correspond to the analysis numbers in Table 4.
Elongated large particles observed on the BESI of the cross section of LVS and location of the analysis performed by using energy dispersive spectroscopy (EDS) in the elongated particles selected. The numbers correspond to the analysis numbers in Table 5.
Elongated large particles observed on the BESI of the cross section of LVS and location of the analysis performed by using energy dispersive spectroscopy (EDS) in the elongated particles selected. The numbers correspond to the analysis numbers in Table 6.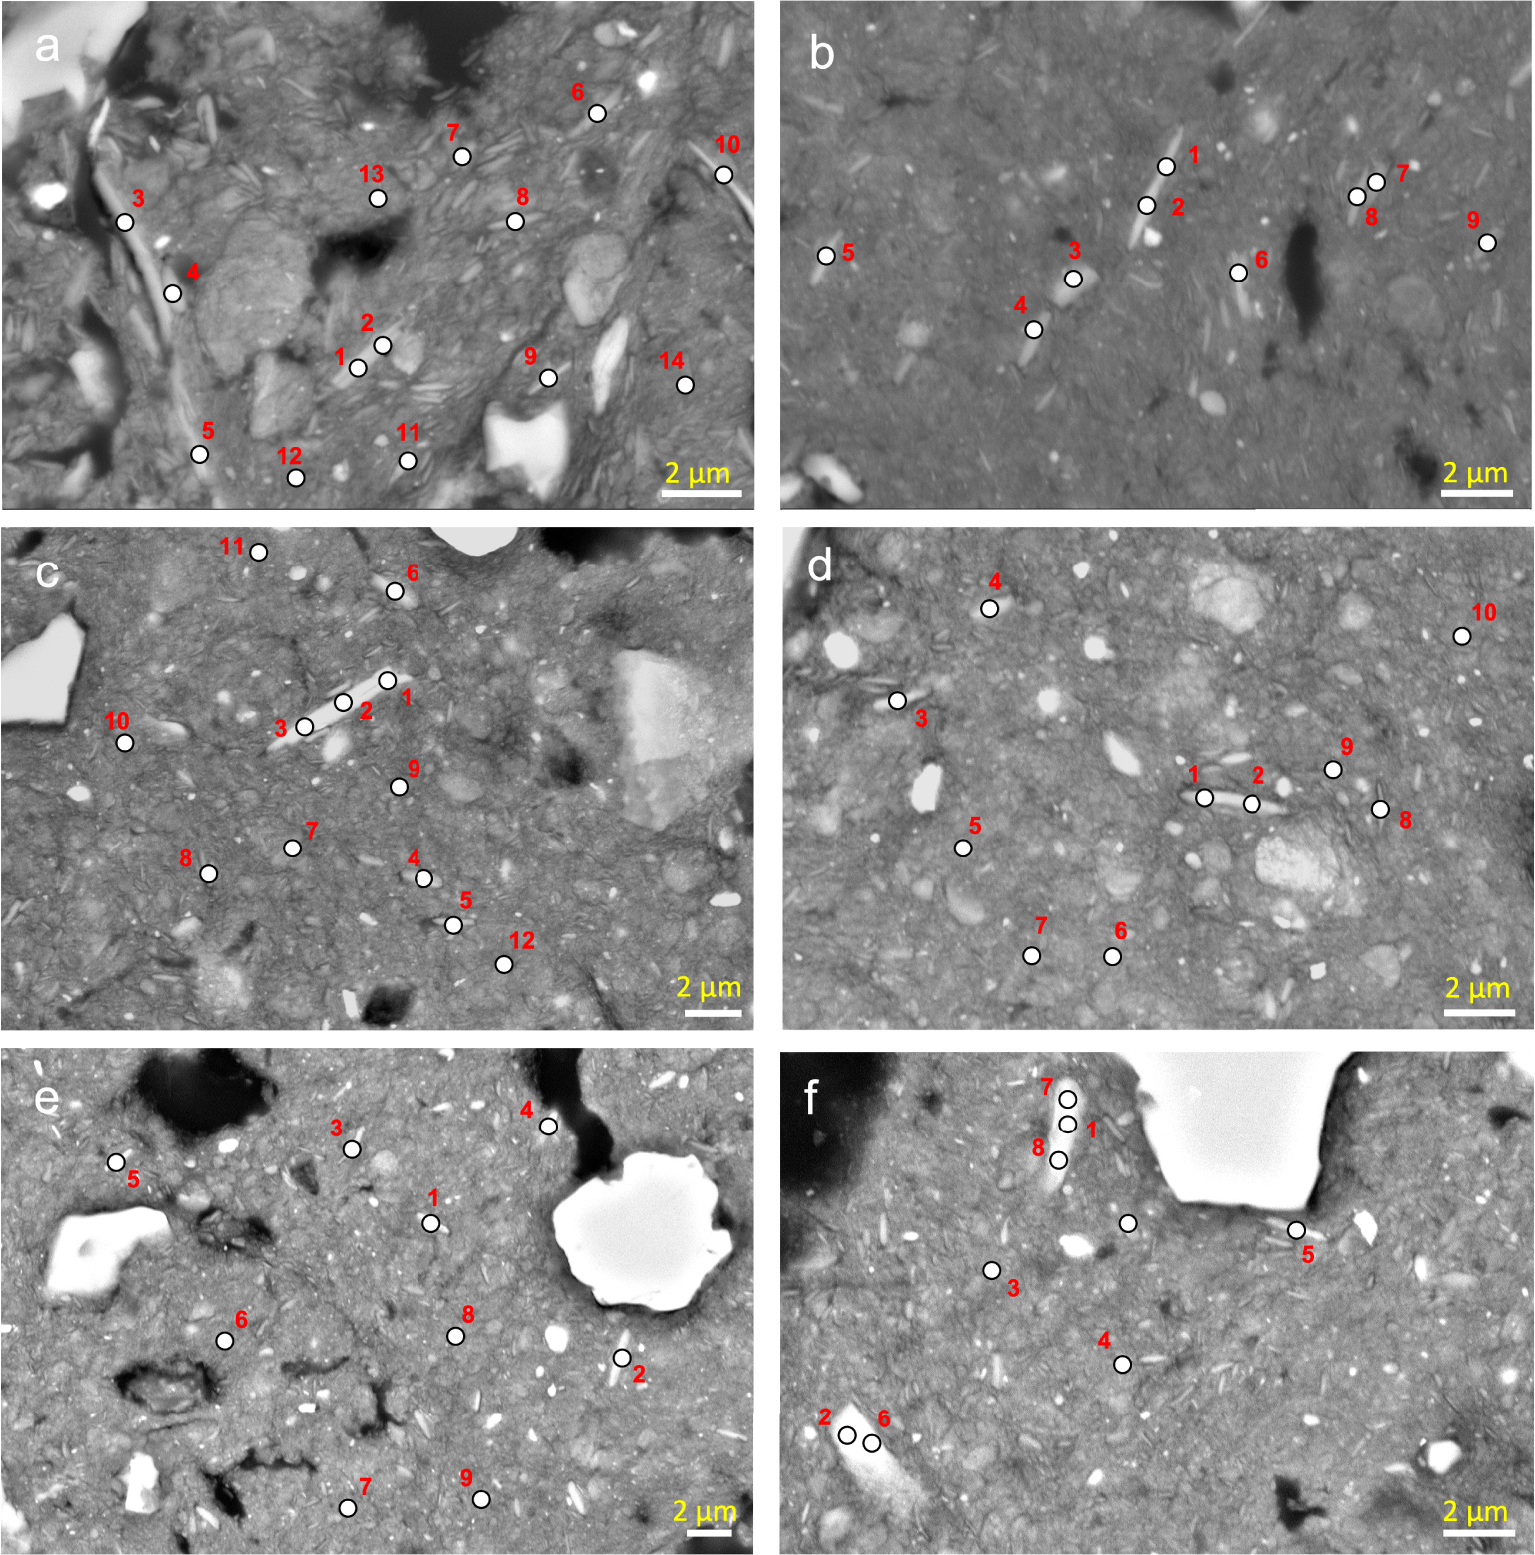
Particles exhibiting the morphological characteristics of phyllosilicates were observed on cross-sections from the LSAS and LVS (Figures 3–6). They were 1 to 30 μm long and 0.2 to 5 μm wide, most showing an internal layer organization with some large internal inter-layer spaces (Figures 3a–d and 5a,b). The latter resulted from swelling properties according to the chemical composition of the 2:1 layers, the collapse of most inter-layer spaces to the benefit of the opening of some inter-layer spaces explaining the large internal inter-layer spaces (Figures 3a–d and 5a,b). The size of these phyllosilicate particles identified on the BESI is consistent with what was found in earlier studies which showed their presence in the coarse clay fraction [Lepsch and Buol 1974], the silt fraction [Melo et al. 2004, Marques et al. 2011] or both the coarse clay and silt fractions [Brito Galvão and Schulze 1996, Soares et al. 2005]. These particles appeared mostly isolated in the groundmass of LSAS (Figures 3, 4) whereas in the groundmass of LVS they associated large elongated particles with numerous much smaller elongated particles (Figures 5, 6). Whatever their size, they appeared to be much more numerous in LVS than in LSAS. They were identified within the two types of microstructure of LSAS and LVS without any particular location regarding the development of the microgranular structure. Some particles showed weathering features such as a strong opening of some interlayer spaces (Figures 3a–c and 5a,b) or exfoliation at the extremities of the particles (Figure 3b,c).
Chemical analysis of the particles shown in the backscattered electron scanning images (BESI) and of their surrounding groundmass (Figure 3) using energy dispersive spectroscopy (EDS)
| Analysis number | % of oxides | |||||||
|---|---|---|---|---|---|---|---|---|
| Al2O3 | SiO2 | Fe2O3 | MgO | CaO | K2O | Na2O | TiO2 | |
| Particle in Figure 3a and surrounding groundmass | ||||||||
| 1 | 36.81 | 47.00 | 5.05 | 0.94 | 0.00 | 8.93 | 0.35 | 0.92 |
| 2 | 35.13 | 50.00 | 3.05 | 1.28 | 0.01 | 9.58 | 0.45 | 0.49 |
| 3 | 34.99 | 49.66 | 3.18 | 1.03 | 0.03 | 10.01 | 0.46 | 0.63 |
| 4 | 35.18 | 49.29 | 3.50 | 1.00 | 0.07 | 9.87 | 0.44 | 0.67 |
| 5 | 36.73 | 49.22 | 3.96 | 1.20 | 0.00 | 7.92 | 0.36 | 0.62 |
| 6 | 35.15 | 48.74 | 3.75 | 0.95 | 0.04 | 10.38 | 0.50 | 0.49 |
| 7 | 46.75 | 47.62 | 5.02 | 0.04 | 0.00 | 0.01 | 0.03 | 0.53 |
| 8 | 50.11 | 28.26 | 19.84 | 0.06 | 0.01 | 0.05 | 0.00 | 1.67 |
| 9 | 53.85 | 26.87 | 17.37 | 0.01 | 0.04 | 0.03 | 0.00 | 1.82 |
| 10 | 52.89 | 24.94 | 20.22 | 0.04 | 0.04 | 0.03 | 0.08 | 1.77 |
| 11 | 52.57 | 22.72 | 22.95 | 0.00 | 0.00 | 0.02 | 0.01 | 1.73 |
| Particle in Figure 3b and surrounding groundmass | ||||||||
| 1 | 38.29 | 45.78 | 7.71 | 1.09 | 0.17 | 5.67 | 0.00 | 1.29 |
| 2 | 42.14 | 42.39 | 8.62 | 1.42 | 0.23 | 4.12 | 0.39 | 0.70 |
| 3 | 42.27 | 43.64 | 8.43 | 1.03 | 0.14 | 3.83 | 0.09 | 0.57 |
| 4 | 41.84 | 44.62 | 7.29 | 1.44 | 0.20 | 3.93 | 0.41 | 0.26 |
| 5 | 46.61 | 43.05 | 7.90 | 0.45 | 0.10 | 1.28 | 0.03 | 0.60 |
| 6 | 56.70 | 21.92 | 16.88 | 0.00 | 0.00 | 0.03 | 0.07 | 4.39 |
| 7 | 58.29 | 22.83 | 17.62 | 0.26 | 0.00 | 0.04 | 0.02 | 0.94 |
| 8 | 57.59 | 24.04 | 16.76 | 0.03 | 0.03 | 0.10 | 0.01 | 1.44 |
| 9 | 60.13 | 21.13 | 17.07 | 0.00 | 0.03 | 0.02 | 0.00 | 1.62 |
| Particle in Figure 3c and surrounding groundmass | ||||||||
| 1 | 36.80 | 47.45 | 5.16 | 1.52 | 0.03 | 8.31 | 0.17 | 0.57 |
| 2 | 35.99 | 48.39 | 4.51 | 1.58 | 0.04 | 8.46 | 0.16 | 0.88 |
| 3 | 34.89 | 48.51 | 4.85 | 1.46 | 0.01 | 9.41 | 0.10 | 0.77 |
| 4 | 36.82 | 48.03 | 4.77 | 1.52 | 0.02 | 7.91 | 0.16 | 0.77 |
| 5 | 35.72 | 48.59 | 4.95 | 1.55 | 0.14 | 8.47 | 0.00 | 0.59 |
| 6 | 39.49 | 45.63 | 5.92 | 1.23 | 0.04 | 7.12 | 0.10 | 0.47 |
| 7 | 53.11 | 24.51 | 20.33 | 0.05 | 0.02 | 0.07 | 0.03 | 1.88 |
| 8 | 56.05 | 23.20 | 19.34 | 0.00 | 0.04 | 0.01 | 0.09 | 1.27 |
| 9 | 50.53 | 19.89 | 27.59 | 0.03 | 0.00 | 0.00 | 0.02 | 1.93 |
| 10 | 55.00 | 23.50 | 19.36 | 0.02 | 0.00 | 0.12 | 0.05 | 1.95 |
| Particle in Figure 3d and surrounding groundmass | ||||||||
| 1 | 42.91 | 39.85 | 11.22 | 0.56 | 0.24 | 3.78 | 0.12 | 1.32 |
| 2 | 39.42 | 42.77 | 9.80 | 0.54 | 0.04 | 6.43 | 0.07 | 0.91 |
| 3 | 41.06 | 42.42 | 9.19 | 0.63 | 0.02 | 5.75 | 0.15 | 0.78 |
| 4 | 40.89 | 46.32 | 6.84 | 0.44 | 0.12 | 4.38 | 0.16 | 0.86 |
| 5 | 34.65 | 48.55 | 7.74 | 0.63 | 0.11 | 7.29 | 0.11 | 0.91 |
| 6 | 33.96 | 48.73 | 7.18 | 0.69 | 0.14 | 8.51 | 0.16 | 0.63 |
| 7 | 33.87 | 48.80 | 7.43 | 0.76 | 0.05 | 8.21 | 0.17 | 0.72 |
| 8 | 36.59 | 46.50 | 7.36 | 0.72 | 0.02 | 7.69 | 0.14 | 0.97 |
| 9 | 33.69 | 49.38 | 7.08 | 0.78 | 0.09 | 8.42 | 0.11 | 0.45 |
| 10 | 36.15 | 46.75 | 7.20 | 0.74 | 0.11 | 8.19 | 0.14 | 0.74 |
| 11 | 34.35 | 48.21 | 7.28 | 0.76 | 0.11 | 8.59 | 0.16 | 0.53 |
| 12 | 37.56 | 45.97 | 7.71 | 0.72 | 0.11 | 7.05 | 0.10 | 0.77 |
| 13 | 43.27 | 50.43 | 3.32 | 0.28 | 0.04 | 2.40 | 0.07 | 0.19 |
| 14 | 43.99 | 37.66 | 12.02 | 0.43 | 0.05 | 4.76 | 0.14 | 0.95 |
| 15 | 56.11 | 23.14 | 18.83 | 0.02 | 0.04 | 0.06 | 0.00 | 1.81 |
| 16 | 55.33 | 19.78 | 22.75 | 0.00 | 0.00 | 0.08 | 0.00 | 2.05 |
| 17 | 55.04 | 22.68 | 20.28 | 0.07 | 0.01 | 0.27 | 0.15 | 1.50 |
| 18 | 52.80 | 24.80 | 19.76 | 0.08 | 0.00 | 0.44 | 0.01 | 2.11 |
| 19 | 55.14 | 19.25 | 23.18 | 0.00 | 0.13 | 0.03 | 0.03 | 2.25 |
| 20 | 36.83 | 46.02 | 8.27 | 0.56 | 0.12 | 6.85 | 0.19 | 1.17 |
| 21 | 36.57 | 46.73 | 6.86 | 0.87 | 0.07 | 7.94 | 0.13 | 0.83 |
| 22 | 35.41 | 47.38 | 7.24 | 0.82 | 0.26 | 7.94 | 0.23 | 0.72 |
| 23 | 34.33 | 48.33 | 7.06 | 0.80 | 0.11 | 8.60 | 0.17 | 0.60 |
| 24 | 35.18 | 46.97 | 7.65 | 0.70 | 0.08 | 8.44 | 0.19 | 0.79 |
| 25 | 35.67 | 46.77 | 7.01 | 0.75 | 0.04 | 8.69 | 0.15 | 0.92 |
| 26 | 37.48 | 45.31 | 7.67 | 0.72 | 0.03 | 6.91 | 0.18 | 1.70 |
| 27 | 36.43 | 45.62 | 8.91 | 0.69 | 0.07 | 7.31 | 0.18 | 0.79 |
| 28 | 56.57 | 22.92 | 18.58 | 0.02 | 0.06 | 0.08 | 0.06 | 1.71 |
| 29 | 51.92 | 18.00 | 27.08 | 0.00 | 0.08 | 0.13 | 0.00 | 2.78 |
| 30 | 55.69 | 18.59 | 23.31 | 0.00 | 0.00 | 0.05 | 0.05 | 2.30 |
| Particle in Figure 3e and surrounding groundmass | ||||||||
| 1 | 41.76 | 46.96 | 1.71 | 0.41 | 0.52 | 7.45 | 0.46 | 0.74 |
| 2 | 40.47 | 48.90 | 1.42 | 0.33 | 0.03 | 7.69 | 0.53 | 0.63 |
| 3 | 40.85 | 47.81 | 1.39 | 0.98 | 0.03 | 7.30 | 1.04 | 0.61 |
| 4 | 39.75 | 48.56 | 1.25 | 0.57 | 0.45 | 8.11 | 0.77 | 0.54 |
| 5 | 40.19 | 48.64 | 1.24 | 0.49 | 0.46 | 8.01 | 0.60 | 0.37 |
| 6 | 41.97 | 47.52 | 1.30 | 0.52 | 0.49 | 7.58 | 0.27 | 0.34 |
| 7 | 63.97 | 23.04 | 11.61 | 0.38 | 0.10 | 0.24 | 0.02 | 0.63 |
| 8 | 63.93 | 22.02 | 11.90 | 0.11 | 0.00 | 0.05 | 0.00 | 1.99 |
| 9 | 64.20 | 24.29 | 10.01 | 0.40 | 0.00 | 0.00 | 0.00 | 1.10 |
| Particle in Figure 3f and surrounding groundmass | ||||||||
| 1 | 38.97 | 47.79 | 2.38 | 1.04 | 0.34 | 7.84 | 1.30 | 0.35 |
| 2 | 39.68 | 48.30 | 2.48 | 0.39 | 0.00 | 8.16 | 0.71 | 0.29 |
| 3 | 39.13 | 47.99 | 1.92 | 0.41 | 0.44 | 8.64 | 0.59 | 0.88 |
| 4 | 40.89 | 46.42 | 3.09 | 0.30 | 0.07 | 8.20 | 0.67 | 0.36 |
| 5 | 40.19 | 47.87 | 2.17 | 0.35 | 0.51 | 7.82 | 0.48 | 0.62 |
| 6 | 41.55 | 46.06 | 2.92 | 0.45 | 0.41 | 7.59 | 0.64 | 0.38 |
| 7 | 43.42 | 43.85 | 3.72 | 0.51 | 0.66 | 6.70 | 0.45 | 0.68 |
| 8 | 39.37 | 47.29 | 2.10 | 1.05 | 0.38 | 8.09 | 1.32 | 0.39 |
| 9 | 38.66 | 47.80 | 2.40 | 1.11 | 0.48 | 7.85 | 1.29 | 0.40 |
| 10 | 60.19 | 28.43 | 9.31 | 0.13 | 0.00 | 0.48 | 0.00 | 1.46 |
| 11 | 64.94 | 24.29 | 7.73 | 0.36 | 0.02 | 0.46 | 0.03 | 2.18 |
| 12 | 62.07 | 25.26 | 10.49 | 0.18 | 0.04 | 0.06 | 0.04 | 1.86 |
| 13 | 59.06 | 28.84 | 10.81 | 0.24 | 0.24 | 0.21 | 0.02 | 0.57 |
| 14 | 56.12 | 31.63 | 10.70 | 0.01 | 0.14 | 0.97 | 0.00 | 0.43 |
Chemical analysis of the particles shown in the backscattered electron scanning images (BESI) and of their surrounding groundmass (Figure 4) using energy dispersive spectroscopy (EDS)
| Analysis number | % of oxides | |||||||
|---|---|---|---|---|---|---|---|---|
| Al2O3 | SiO2 | Fe2O3 | MgO | CaO | K2O | Na2O | TiO2 | |
| Particle in Figure 4a and surrounding groundmass | ||||||||
| 1 | 48.92 | 38.93 | 11.05 | 0.02 | 0.04 | 0.10 | 0.00 | 0.96 |
| 2 | 49.10 | 40.26 | 9.87 | 0.12 | 0.00 | 0.00 | 0.01 | 0.65 |
| 3 | 47.70 | 40.38 | 10.89 | 0.00 | 0.02 | 0.08 | 0.16 | 0.77 |
| 4 | 59.96 | 20.41 | 17.45 | 0.23 | 0.00 | 0.00 | 0.05 | 1.89 |
| 5 | 55.33 | 22.43 | 20.24 | 0.00 | 0.02 | 0.03 | 0.02 | 1.93 |
| 6 | 58.86 | 21.13 | 18.06 | 0.35 | 0.08 | 0.06 | 0.01 | 1.45 |
| Particle in Figure 4b and surrounding groundmass | ||||||||
| 1 | 47.78 | 38.84 | 9.18 | 0.08 | 0.06 | 2.72 | 0.10 | 1.24 |
| 2 | 46.52 | 39.11 | 9.67 | 0.07 | 0.00 | 2.89 | 0.20 | 1.55 |
| Particle in Figure 4c and surrounding groundmass | ||||||||
| 1 | 50.27 | 33.04 | 12.87 | 0.52 | 0.00 | 1.88 | 0.10 | 1.31 |
| 2 | 49.53 | 32.94 | 14.34 | 0.18 | 0.03 | 1.72 | 0.07 | 1.20 |
| 3 | 50.50 | 31.43 | 14.82 | 0.55 | 0.00 | 1.27 | 0.07 | 1.37 |
| 4 | 53.51 | 23.54 | 21.23 | 0.06 | 0.00 | 0.07 | 0.03 | 1.56 |
| 5 | 55.47 | 18.48 | 24.42 | 0.16 | 0.00 | 0.09 | 0.02 | 1.36 |
| 6 | 56.13 | 20.86 | 19.74 | 0.23 | 0.00 | 0.04 | 0.03 | 2.97 |
| Particle in Figure 4d and surrounding groundmass | ||||||||
| 1 | 48.05 | 32.47 | 18.39 | 0.10 | 0.00 | 0.00 | 0.03 | 0.97 |
| 2 | 50.62 | 34.54 | 13.55 | 0.20 | 0.02 | 0.08 | 0.01 | 0.98 |
| 3 | 50.78 | 34.41 | 13.74 | 0.03 | 0.00 | 0.00 | 0.02 | 1.03 |
| 4 | 58.37 | 23.76 | 16.56 | 0.00 | 0.00 | 0.04 | 0.00 | 1.27 |
| 5 | 58.42 | 19.40 | 17.19 | 0.14 | 0.00 | 0.04 | 0.00 | 4.81 |
| 6 | 55.82 | 25.18 | 16.72 | 0.19 | 0.01 | 0.04 | 0.01 | 2.03 |
| Particle in Figure 4e and surrounding groundmass | ||||||||
| 1 | 53.39 | 37.72 | 8.58 | 0.16 | 0.16 | 0.00 | 0.00 | 0.00 |
| 2 | 50.79 | 42.95 | 5.15 | 0.05 | 0.02 | 0.16 | 0.01 | 0.88 |
| 3 | 66.06 | 26.42 | 6.38 | 0.22 | 0.00 | 0.02 | 0.00 | 0.89 |
| 4 | 66.24 | 25.77 | 6.74 | 0.28 | 0.04 | 0.04 | 0.00 | 0.88 |
| Particle in Figure 4f and surrounding groundmass | ||||||||
| 1 | 51.22 | 45.07 | 3.11 | 0.33 | 0.00 | 0.14 | 0.02 | 0.11 |
| 2 | 51.21 | 45.90 | 2.46 | 0.09 | 0.07 | 0.15 | 0.00 | 0.12 |
| 3 | 50.53 | 45.26 | 2.95 | 0.21 | 0.24 | 0.08 | 0.00 | 0.73 |
| 4 | 64.50 | 24.03 | 9.81 | 0.00 | 0.09 | 0.18 | 0.00 | 1.38 |
| 5 | 64.65 | 20.33 | 13.60 | 0.25 | 0.10 | 0.11 | 0.00 | 0.95 |
| 6 | 61.89 | 27.16 | 9.87 | 0.13 | 0.05 | 0.00 | 0.00 | 0.89 |
3.4. Chemical composition of phyllosilicate particles recognized on BESI
Chemical analyses of the largest elongated particles (Figures 3, 5), i.e. particles ranging from 3 to 30 μm in length and from 0.5 to 5 μm in width, showed that the Al2O3 content ranged from 33.69 to 46.61%, SiO2 content from 42.42 to 50.43%, Fe2O3 content from 1.24 to 11.22%, MgO content from 0.30 to 1.44% and K2O content from 1.28 to 10.38% (Tables 3 and 5). On the other hand, chemical analysis of the smallest elongated particles, i.e. particles ranging from 1 to 3 μm in length and from 0.2 to 0.5 μm in width, showed either the presence of smaller amounts of K2O than in the largest elongated particles with K2O ranging from 1.27 to 4.14% or a K2O content close to its value in the surrounding groundmass (Tables 4 and 6). Because of the small size of the latter particles, we can assume that their chemical analysis does not correspond to the particle body alone but also takes into account part of the surrounding groundmass material, thus limiting the discussion of the results in terms of chemical composition of the corresponding elongated particles. However, the most likely hypothesis is that these elongated particles with a K2O content close to that of the groundmass are 2:1 phyllosilicates such as HIVs with a very low K2O content or kaolinite particles.
Chemical analysis of the particles shown in the backscattered electron scanning images (BESI) and of their surrounding groundmass (Figure 5) using energy dispersive spectroscopy (EDS)
| Analysis number | % of oxides | |||||||
|---|---|---|---|---|---|---|---|---|
| Al2O3 | SiO2 | Fe2O3 | MgO | CaO | K2O | Na2O | TiO2 | |
| Particle in Figure 5a and surrounding groundmass | ||||||||
| 1 | 39.11 | 46.56 | 4.65 | 0.28 | 0.48 | 7.94 | 0.60 | 0.39 |
| 2 | 36.90 | 47.24 | 5.21 | 0.48 | 0.03 | 8.46 | 0.66 | 1.02 |
| 3 | 36.61 | 47.41 | 4.68 | 0.44 | 0.02 | 9.04 | 0.72 | 1.08 |
| 4 | 37.28 | 47.49 | 3.58 | 0.50 | 0.06 | 9.28 | 0.88 | 0.93 |
| 5 | 35.91 | 47.06 | 4.50 | 0.52 | 0.09 | 10.24 | 0.68 | 1.00 |
| 6 | 36.54 | 46.76 | 6.77 | 0.48 | 0.00 | 7.91 | 0.43 | 1.11 |
| 7 | 35.67 | 47.38 | 5.19 | 0.49 | 0.13 | 9.45 | 0.57 | 1.13 |
| 9 | 40.35 | 45.18 | 12.32 | 0.11 | 0.00 | 0.19 | 0.00 | 1.85 |
| 10 | 43.11 | 45.48 | 9.45 | 0.12 | 0.00 | 1.24 | 0.13 | 0.47 |
| 11 | 42.02 | 41.83 | 14.98 | 0.30 | 0.00 | 0.23 | 0.06 | 0.59 |
| 12 | 30.63 | 51.71 | 6.65 | 3.06 | 0.17 | 7.41 | 0.00 | 0.36 |
| 13 | 39.16 | 47.71 | 6.97 | 0.37 | 0.03 | 4.86 | 0.30 | 0.60 |
| 14 | 41.37 | 37.67 | 18.28 | 0.28 | 0.05 | 0.82 | 0.13 | 1.40 |
| 15 | 42.75 | 40.02 | 15.97 | 0.26 | 0.00 | 0.35 | 0.05 | 0.60 |
| 16 | 31.81 | 52.86 | 13.65 | 0.22 | 0.06 | 0.15 | 0.00 | 1.25 |
| 17 | 35.35 | 42.74 | 18.51 | 1.50 | 0.04 | 0.92 | 0.03 | 0.91 |
| Particle in Figure 5b and surrounding groundmass | ||||||||
| 1 | 32.20 | 45.17 | 11.40 | 1.60 | 0.08 | 9.06 | 0.12 | 0.37 |
| 2 | 30.86 | 47.86 | 8.99 | 1.69 | 0.00 | 9.99 | 0.02 | 0.58 |
| 3 | 31.49 | 48.56 | 8.36 | 1.62 | 0.00 | 9.40 | 0.12 | 0.44 |
| 4 | 40.82 | 48.34 | 8.32 | 0.47 | 0.00 | 1.65 | 0.02 | 0.39 |
| 5 | 39.70 | 36.42 | 21.77 | 0.29 | 0.09 | 0.43 | 0.07 | 1.23 |
| 6 | 40.33 | 41.45 | 17.03 | 0.32 | 0.08 | 0.45 | 0.00 | 0.34 |
| 7 | 43.04 | 40.69 | 14.12 | 0.49 | 0.00 | 0.61 | 0.11 | 0.93 |
| 8 | 7.66 | 6.56 | 3.38 | 0.08 | 0.08 | 0.09 | 0.00 | 82.15 |
| 9 | 40.61 | 48.25 | 10.07 | 0.22 | 0.07 | 0.31 | 0.04 | 0.43 |
| 10 | 38.50 | 38.60 | 20.35 | 0.36 | 0.00 | 0.89 | 0.08 | 1.21 |
| 11 | 29.08 | 49.12 | 10.15 | 2.96 | 0.14 | 8.16 | 0.03 | 0.36 |
| 12 | 32.21 | 43.02 | 14.70 | 1.55 | 0.10 | 7.74 | 0.24 | 0.43 |
| Particle in Figure 5c and surrounding groundmass | ||||||||
| 1 | 41.24 | 52.68 | 5.34 | 0.10 | 0.02 | 0.23 | 0.03 | 0.37 |
| 2 | 37.17 | 55.26 | 6.90 | 0.06 | 0.02 | 0.15 | 0.06 | 0.39 |
| 3 | 42.26 | 54.25 | 3.09 | 0.14 | 0.07 | 0.14 | 0.00 | 0.04 |
| 4 | 42.11 | 52.90 | 4.60 | 0.04 | 0.00 | 0.25 | 0.07 | 0.03 |
| 5 | 41.29 | 50.25 | 7.73 | 0.06 | 0.01 | 0.28 | 0.06 | 0.33 |
| 6 | 42.39 | 46.80 | 9.93 | 0.12 | 0.05 | 0.26 | 0.01 | 0.44 |
| 7 | 38.70 | 47.06 | 9.52 | 1.49 | 0.11 | 2.40 | 0.10 | 0.63 |
| 8 | 38.60 | 44.33 | 10.35 | 0.53 | 0.05 | 1.59 | 0.04 | 4.50 |
| 9 | 37.44 | 47.56 | 9.83 | 1.57 | 0.15 | 2.81 | 0.00 | 0.64 |
| 10 | 40.80 | 45.95 | 10.54 | 0.61 | 0.00 | 1.34 | 0.00 | 0.75 |
| Particle in Figure 5d and surrounding groundmass | ||||||||
| 1 | 42.48 | 41.42 | 14.12 | 0.45 | 0.00 | 0.57 | 0.00 | 0.96 |
| 2 | 28.99 | 57.32 | 8.37 | 1.39 | 0.00 | 3.60 | 0.05 | 0.28 |
| 3 | 32.26 | 51.30 | 9.82 | 1.72 | 0.03 | 4.34 | 0.07 | 0.45 |
| 4 | 40.82 | 49.64 | 6.89 | 0.28 | 0.09 | 1.53 | 0.02 | 0.74 |
| 5 | 40.97 | 53.53 | 3.48 | 0.22 | 0.00 | 1.59 | 0.04 | 0.18 |
| 6 | 41.05 | 53.06 | 4.64 | 0.16 | 0.03 | 0.80 | 0.08 | 0.19 |
| 7 | 39.16 | 48.03 | 11.07 | 0.18 | 0.08 | 0.36 | 0.00 | 1.14 |
| 8 | 34.86 | 48.17 | 13.46 | 0.34 | 0.04 | 2.00 | 0.06 | 1.06 |
| 9 | 38.99 | 37.44 | 22.01 | 0.16 | 0.03 | 0.38 | 0.03 | 0.96 |
| 10 | 40.38 | 44.10 | 11.89 | 0.56 | 0.00 | 1.86 | 0.01 | 1.21 |
| Particle in Figure 5e and surrounding groundmass | ||||||||
| 1 | 33.21 | 47.81 | 10.54 | 1.84 | 0.09 | 5.50 | 0.06 | 0.95 |
| 2 | 33.41 | 47.68 | 9.64 | 1.96 | 0.14 | 6.08 | 0.05 | 1.03 |
| 3 | 34.26 | 45.36 | 13.77 | 1.89 | 0.15 | 3.61 | 0.00 | 0.96 |
| 4 | 35.69 | 47.15 | 13.15 | 2.27 | 0.14 | 1.03 | 0.03 | 0.54 |
| 5 | 34.27 | 47.79 | 10.21 | 1.95 | 0.05 | 4.85 | 0.06 | 0.83 |
| 6 | 38.88 | 45.85 | 12.21 | 0.49 | 0.00 | 0.72 | 0.00 | 1.85 |
| 7 | 40.89 | 38.43 | 19.50 | 0.31 | 0.03 | 0.20 | 0.00 | 0.63 |
| 8 | 41.68 | 35.48 | 19.45 | 0.12 | 0.02 | 0.17 | 0.02 | 3.06 |
| 9 | 39.48 | 42.59 | 14.73 | 0.24 | 0.02 | 1.99 | 0.08 | 0.87 |
| 10 | 41.42 | 42.12 | 15.47 | 0.08 | 0.02 | 0.13 | 0.06 | 0.71 |
| 11 | 40.41 | 42.82 | 16.47 | 0.13 | 0.00 | 0.10 | 0.00 | 0.07 |
| 12 | 39.99 | 43.61 | 15.26 | 0.10 | 0.07 | 0.37 | 0.05 | 0.55 |
| Particle in Figure 5f and surrounding groundmass | ||||||||
| 1 | 38.71 | 47.97 | 4.20 | 0.55 | 0.00 | 7.19 | 0.55 | 0.84 |
| 2 | 38.42 | 47.10 | 3.75 | 0.41 | 0.08 | 8.89 | 0.62 | 0.72 |
| 3 | 41.72 | 38.36 | 18.31 | 0.43 | 0.00 | 0.32 | 0.08 | 0.78 |
| 4 | 42.02 | 38.14 | 18.13 | 0.21 | 0.02 | 0.18 | 0.00 | 1.31 |
| 5 | 41.84 | 44.28 | 12.94 | 0.29 | 0.06 | 0.38 | 0.00 | 0.20 |
| 6 | 41.00 | 43.79 | 11.32 | 0.21 | 0.00 | 0.18 | 0.04 | 3.46 |
| 7 | 42.17 | 37.12 | 19.42 | 0.25 | 0.00 | 0.19 | 0.07 | 0.78 |
Chemical analysis of the particles shown in the backscattered electron scanning images (BESI) and of their surrounding groundmass (Figure 6) using energy dispersive spectroscopy (EDS)
| Analysis number | % of oxides | |||||||
|---|---|---|---|---|---|---|---|---|
| Al2O3 | SiO2 | Fe2O3 | MgO | CaO | K2O | Na2O | TiO2 | |
| Particle in Figure 6a and surrounding groundmass | ||||||||
| 1 | 41.55 | 50.84 | 6.87 | 0.18 | 0.02 | 0.32 | 0.02 | 0.20 |
| 2 | 41.66 | 51.48 | 5.93 | 0.26 | 0.00 | 0.40 | 0.00 | 0.27 |
| 3 | 41.77 | 51.66 | 5.34 | 0.26 | 0.00 | 0.92 | 0.00 | 0.05 |
| 4 | 42.87 | 51.84 | 4.62 | 0.17 | 0.00 | 0.46 | 0.04 | 0.00 |
| 5 | 41.26 | 47.30 | 10.47 | 0.29 | 0.00 | 0.68 | 0.01 | 0.00 |
| 6 | 40.63 | 45.40 | 12.49 | 0.34 | 0.03 | 0.66 | 0.04 | 0.41 |
| 7 | 35.63 | 47.61 | 10.53 | 1.55 | 0.10 | 4.14 | 0.00 | 0.45 |
| 8 | 36.31 | 45.63 | 13.86 | 1.31 | 0.12 | 1.99 | 0.06 | 0.71 |
| 9 | 29.41 | 52.53 | 12.09 | 1.29 | 0.04 | 3.74 | 0.02 | 0.87 |
| 10 | 36.27 | 49.75 | 8.60 | 1.25 | 0.00 | 3.62 | 0.06 | 0.45 |
| 11 | 36.54 | 44.93 | 13.63 | 1.32 | 0.03 | 2.76 | 0.00 | 0.79 |
| 12 | 43.31 | 42.31 | 12.81 | 0.26 | 0.00 | 0.47 | 0.06 | 0.78 |
| 13 | 35.92 | 46.34 | 16.45 | 0.29 | 0.00 | 0.71 | 0.00 | 0.29 |
| 14 | 41.90 | 40.59 | 13.40 | 0.21 | 0.03 | 0.37 | 0.00 | 3.50 |
| Particle in Figure 6b and surrounding groundmass | ||||||||
| 1 | 37.54 | 43.27 | 13.62 | 1.41 | 0.09 | 1.78 | 0.00 | 2.28 |
| 2 | 37.74 | 44.82 | 11.90 | 1.72 | 0.20 | 2.83 | 0.02 | 0.77 |
| 3 | 38.34 | 46.03 | 11.12 | 1.38 | 0.07 | 2.25 | 0.02 | 0.80 |
| 4 | 41.08 | 42.60 | 11.55 | 0.37 | 0.02 | 2.89 | 0.00 | 1.50 |
| 5 | 41.23 | 41.53 | 12.91 | 0.16 | 0.03 | 2.89 | 0.13 | 1.12 |
| 6 | 42.75 | 39.61 | 16.42 | 0.18 | 0.04 | 0.24 | 0.00 | 0.76 |
| 7 | 46.08 | 34.53 | 17.98 | 0.51 | 0.00 | 0.15 | 0.00 | 0.74 |
| 8 | 43.33 | 33.49 | 21.46 | 0.31 | 0.00 | 0.03 | 0.02 | 1.35 |
| 9 | 42.61 | 33.97 | 22.52 | 0.14 | 0.12 | 0.20 | 0.00 | 0.44 |
| Particle in Figure 6c and surrounding groundmass | ||||||||
| 1 | 43.08 | 52.28 | 4.39 | 0.06 | 0.00 | 0.08 | 0.00 | 0.10 |
| 2 | 40.49 | 51.33 | 7.46 | 0.05 | 0.02 | 0.41 | 0.00 | 0.23 |
| 3 | 36.81 | 44.28 | 18.27 | 0.05 | 0.06 | 0.40 | 0.02 | 0.11 |
| 4 | 40.46 | 40.20 | 17.53 | 0.37 | 0.03 | 0.38 | 0.02 | 1.02 |
| 5 | 40.67 | 43.35 | 14.04 | 0.18 | 0.03 | 0.13 | 0.00 | 1.60 |
| 6 | 40.94 | 46.26 | 12.09 | 0.10 | 0.01 | 0.13 | 0.07 | 0.40 |
| 7 | 41.72 | 39.11 | 17.97 | 0.30 | 0.00 | 0.18 | 0.07 | 0.64 |
| 8 | 41.29 | 43.37 | 14.27 | 0.20 | 0.04 | 0.17 | 0.00 | 0.66 |
| 9 | 44.01 | 37.11 | 17.34 | 0.53 | 0.01 | 0.25 | 0.00 | 0.74 |
| 10 | 38.34 | 37.33 | 22.46 | 0.41 | 0.11 | 0.54 | 0.00 | 0.80 |
| 11 | 41.19 | 37.75 | 18.52 | 0.43 | 0.17 | 0.30 | 0.02 | 1.62 |
| 12 | 42.51 | 38.28 | 18.08 | 0.20 | 0.04 | 0.19 | 0.03 | 0.68 |
| Particle in Figure 6d and surrounding groundmass | ||||||||
| 1 | 41.59 | 47.74 | 9.87 | 0.03 | 0.09 | 0.10 | 0.00 | 0.58 |
| 2 | 42.31 | 47.52 | 8.77 | 0.10 | 0.01 | 0.12 | 0.00 | 1.17 |
| 3 | 40.39 | 46.88 | 11.69 | 0.11 | 0.11 | 0.07 | 0.00 | 0.76 |
| 4 | 40.53 | 44.94 | 13.47 | 0.05 | 0.05 | 0.19 | 0.00 | 0.76 |
| 5 | 43.61 | 36.49 | 17.42 | 0.15 | 0.03 | 0.14 | 0.04 | 2.11 |
| 6 | 43.03 | 35.01 | 20.79 | 0.20 | 0.00 | 0.22 | 0.06 | 0.68 |
| 7 | 42.09 | 35.86 | 20.70 | 0.20 | 0.12 | 0.14 | 0.03 | 0.87 |
| 8 | 42.58 | 36.34 | 19.79 | 0.20 | 0.01 | 0.15 | 0.00 | 0.92 |
| 9 | 41.65 | 38.55 | 18.29 | 0.25 | 0.03 | 0.12 | 0.07 | 1.03 |
| 10 | 41.81 | 36.87 | 19.52 | 0.46 | 0.06 | 0.64 | 0.00 | 0.66 |
| Particle in Figure 6e and surrounding groundmass | ||||||||
| 1 | 38.98 | 42.20 | 15.39 | 0.52 | 0.15 | 1.56 | 0.03 | 1.17 |
| 2 | 43.15 | 47.69 | 8.66 | 0.13 | 0.04 | 0.10 | 0.04 | 0.19 |
| 3 | 41.82 | 41.78 | 14.39 | 0.34 | 0.11 | 0.23 | 0.03 | 1.29 |
| 4 | 41.77 | 48.40 | 9.27 | 0.08 | 0.00 | 0.10 | 0.00 | 0.38 |
| 5 | 40.55 | 47.26 | 10.96 | 0.09 | 0.06 | 0.21 | 0.05 | 0.83 |
| 6 | 43.53 | 36.03 | 19.14 | 0.23 | 0.03 | 0.22 | 0.05 | 0.77 |
| 7 | 41.18 | 36.86 | 18.03 | 0.14 | 0.00 | 0.18 | 0.00 | 3.61 |
| 8 | 42.25 | 39.14 | 16.82 | 0.45 | 0.03 | 0.30 | 0.00 | 1.01 |
| 9 | 41.43 | 35.64 | 20.00 | 0.29 | 0.00 | 0.40 | 0.03 | 2.21 |
| Particle in Figure 6f and surrounding groundmass | ||||||||
| 1 | 41.76 | 51.52 | 5.44 | 0.05 | 0.00 | 0.12 | 0.05 | 1.07 |
| 2 | 34.50 | 44.83 | 14.17 | 0.34 | 0.17 | 5.34 | 0.05 | 0.60 |
| 3 | 42.70 | 38.02 | 17.92 | 0.24 | 0.06 | 0.49 | 0.00 | 0.57 |
| 4 | 37.49 | 34.52 | 17.96 | 0.09 | 0.01 | 0.10 | 0.00 | 9.83 |
| 5 | 29.00 | 58.98 | 7.45 | 0.20 | 0.14 | 3.54 | 0.17 | 0.51 |
| 6 | 35.78 | 45.78 | 12.57 | 0.51 | 0.22 | 4.64 | 0.07 | 0.42 |
| 7 | 41.19 | 49.47 | 6.33 | 0.05 | 0.00 | 0.14 | 0.09 | 2.73 |
| 8 | 42.48 | 52.42 | 4.56 | 0.07 | 0.15 | 0.06 | 0.03 | 0.24 |
Respective content in Al2O3, SiO2 and K2O + Na2O + CaO: (a) in the large elongated particles (light blue points, see Table 3) and surrounding groundmass (red points, see Table 3) of LSAS; (b) in the large elongated particles (light blue points, see Table 5) and surrounding groundmass (red points, see Table 5) of LVS. Theoretical composition of muscovite (deep blue point) [Velde and Meunier 2008], composition of muscovite particles (brown points) [Aurousseau et al. 1983] and of weathered muscovite particles (yellow points) [Aurousseau et al. 1983] are also plotted.
Comparison of the Al2O3, SiO2 and K2O + Na2O + CaO contents recorded for the largest elongated particles with their respective contents in a theoretical muscovite and in unweathered and highly weathered muscovites showed that some of the chemical compositions recorded are close to those of the theoretical and unweathered muscovite (Figure 7). A structural formula based on the structure of 2:1 phyllosilicates was established for chemical analysis conducted on some large elongated particles and exhibiting the highest K2O content among the analyses performed for the selected particles (Table 7). The structural formula recorded showed a small excess of cavities occupied in the octahedral sheet, the number of occupied cavities ranging from 2.02 to 2.09 for the half unit cell (Table 7). The structural formulas recorded correspond to 2:1 phyllosilicates between muscovite and dioctahedral vermiculites, the latter corresponding to dioctahedral 2:1 phyllosilicates with 0.3 to 0.7 Si4+ substituted by Al3+ in the tetrahedral sheet [Velde and Meunier 2008]. When the K2O content decreased, the structural formulas calculated showed an increase in the excess of Al3+ in the octahedral sheet, thus indicating that the lower the K2O content, the higher the amount of aluminum in the interlayer space [Meunier 2007].
Chemical composition of the half unit cell computed for the point of analysis exhibiting the highest K2O content in some of the largest elongated particles evidenced in LSAS and LVS
| Location | Chemical composition of the half unit cell |
|---|---|
| Figure 3a, point no 3 | [Si3.14Al0.86]O10[Al1.74Fe0.15Mg0.10Ti0.03](OH)2K0.81Ca0.00Na0.06 |
| Figure 3d, point no 11 | [Si3.07Al0.93]O10[Al1.64Fe0.35Mg0.07Ti0.03](OH)2K0.70Ca0.01Na0.02 |
| Figure 5a, point no 5 | [Si3.01Al0.99]O10[Al1.71Fe0.22Mg0.05Ti0.05](OH)2K0.84Ca0.01Na0.09 |
| Figure 5b, point no 2 | [Si3.10Al0.90]O10[Al1.45Fe0.44Mg0.16Ti0.03](OH)2K0.83Ca0.00Na0.00 |
Globally, when the K2O content decreased, chemical analysis showed that the Al2O3 content remained greater than in the weathered muscovite selected in the literature [Aurousseau et al. 1983] and increased with the decrease in the K2O content (Figure 7). This can be considered to result from the intercalation of hydroxy-Al of the interlayer space during the weathering processes of the muscovite particles. When we look at the chemical composition variation within large elongated particles showing exfoliation morphologies at their extremities, we find that the K2O content is smaller in these extremities compared to those recorded in the heart of the elongated particles (Figure 7). While we cannot exclude the formation of some kaolinite as resulting from the weathering of muscovite, the small variation of the Fe2O3 and MgO content in the largest elongated particles whatever their K2O content is consistent with the formation of HIVs during the weathering process (Figure 7).
Using the same type of diagram as for large elongated particles (Figure 7), results showed Al2O3, SiO2 and K2O + Na2O + CaO contents for small elongated particles (Figure 8) that are consistent with those of HIVs. Again, while we cannot exclude the formation of some kaolinite as resulting from the weathering of muscovite, the Fe2O3, MgO and K2O content is again consistent with the formation of HIVs resulting from intense weathering of muscovite particles resulting in the aluminization of the interlayer space as shown earlier [Aurousseau et al. 1983, Caner et al. 2014] (Tables 4 and 6). The weathering of muscovite particles and related chemical composition evolution are shown in Figure 9 with analyses selected in large elongated particles. Results show a continuous decrease in SiO2 and K2O + Na2O + CaO content and an increase in Al2O3 content from the core of the large elongated particles selected to their exfoliated extremities (Tables 3 and 5; Figures 3 and 5).
Respective content in Al2O3, SiO2 and K2O + Na2O + CaO: (a) in the small elongated particles (light blue points, see Table 4) and surrounding groundmass (red points, see Table 4) of LSAS; (b) in the large elongated particles (light blue points, see Table 6) and surrounding groundmass (red points, see Table 6) of LVS. Theoretical composition of muscovite (deep blue point) [Velde and Meunier 2008], composition of muscovite particles (brown point) [Aurousseau et al. 1983] and of weathered muscovite particles (yellow point) [Aurousseau et al. 1983] are also plotted.
Change in the respective content in Al2O3, SiO2 and K2O + Na2O + CaO from core particle to areas of the particle showing weathering morphology in the elongated particle of Figure 3b (light blue points), Figure 3d (red points), Figure 5a (green points) and Figure 5d (purple points). The respective content in Al2O3, SiO2 and K2O + Na2O + CaO of a theoretical muscovite (deep blue point) [Velde and Meunier 2008], muscovite particles (brown points) [Aurousseau et al. 1983] and weathered muscovite particles (yellow points) [Aurousseau et al. 1983] are also plotted as references.
Using X-ray diffraction, Reattoet al. [2010] showed the presence of HIVs in the clay-size fraction of LVS. They correspond either to the small 2:1 phyllosilicate particles shown on the BESI that exhibit a chemical composition consistent with intensely weathered muscovite or to HIVs with a hydroxy-Al content in the interlayer space which increases with the decrease in the K2O content (Table 6, Figure 6). On the other hand, Reattoet al. [2010] did not determine the presence of HIVs in LSAS, whereas in the present study, large and small elongated particles were identified with similar characteristics to those present in LVS. This can be explained by the much smaller number of elongated particles recorded in LSAS than in LVS as shown on BESI, and in particular by the fact that areas with large elongated particles associated to a high concentration of small particles were common in LVS while they were not observed in LSAS (Figures 3, 6). Whatever their respective amount in LSAS and LVS, BESI showed that the surface area proportion corresponding to the elongated particles is smaller than 1% in the two Bw horizons studied. Thus, although present in LSAS, weathered muscovites and HIVs are not present in sufficient amounts to be detected by X-ray diffraction, thus explaining why they were not detected by Reattoet al. [2010] in the <2 mm-size and clay-size fractions.
3.5. Origin of the particles of 2:1 phyllosilicates
According to recent studies, the biological origin for the microgranular structure appears to be the most likely explanation [Freitas et al. 2021, Jouquet et al. 2016, Mujinya et al. 2013, Oliveira et al. 2012, Reatto et al. 2009, Sarcinelli et al. 2009]. Faunal activity in latosols continuously brings material from the saprolite and deep horizons to the upper horizons, thus bringing up minerals such as the 2:1 phyllosilicates studied here to the Bw horizons. These phyllosilicates are allochthonous and continue their transformation in the physico-chemical context of the Bw horizons. The presence, in the Bw horizon, of large particles of 2:1 phyllosilicates belonging to the silt-size class and with a chemical composition consistent with that of a weathered muscovite or of HIVs is not consistent with the fact that latosols result from a long sequence of weathering producing a clay-size fraction composed of kaolinite, gibbsite, goethite and hematite in different proportions depending on the parent material and landscape position [Curi and Franzmeier 1984, Macedo and Bryant 1987, Ker 1997, Melfi and Pédro 1977, 1978, Reatto et al. 2008, Schaefer et al. 2008].
The presence of allochthonous 2:1 phyllosilicates was shown in termite mounds developed in African soils analogous to latosols. Mujinya et al. [2013] studied the clay composition of the material forming termite mounds in D.R. Congo and showed that the termite-mound material was enriched in 2:1 phyllosilicates, mainly mica and expandable clay minerals. They concluded that this enrichment resulted from the upward transport of mica- and expandable clay-bearing soil or saprolite material by termites. Thus, the 2:1 phyllosilicates brought by faunal activity in the Bw horizons continue their transformation in the Bw horizon under stronger acidic conditions than in the deep horizons or saprolite from where they originated and can thus be further aluminized. The lack of exchangeable Al3+ in LSAS and its weak amount in LVS (Table 2) are consistent with the presence of hydroxy-aluminum in the interlayer space of the 2:1 clay minerals as described by Velde and Meunier [2008].
The accumulation of materials originating from deeper horizons or even from the saprolite in chambers or channels resulting from termite or ant burrowing activity was often described in the field and is easily recognizable due to the difference in color with the surrounding horizon material [Araujo 2013]. Much earlier, Lepage et al. [1974] observed active termite channels used to collect water from the water table between 45 and 55 m depth in weathered clayey and calcareous formations in North Senegal. A few years later, Leprun and Roy-Noël [1976] showed the presence of both micas and vermiculite particles originating from subterranean saprolite materials in termite mounds. The accumulation in the topsoil of material originating from the deep horizon was also discussed by Boulet et al. [1995] who evaluated the rate of surface biological accumulation of soil matter using radiocarbon dating on charcoal and the soil humin fraction in latosols located in the Minas Gerais state. They found that the rate of accumulation in the latosols studied was 0.21 to 0.23 mm⋅year−1, a rate consistent with those computed by Miklos [1992] which were 0.21 to 0.34 mm⋅year−1. With such accumulation rates, biological activity brings a thickness of about 2 to 3 m of soil material to the surface of the soil in 10,000 years.
If we retain the hypothesis that the 2:1 phyllosilicates present in the Bw horizons have been brought by faunal activity, this is consistent with the presence of mica in the <2 μm fraction of the saprolite of LVS as shown by Reattoet al. [2010] by using XRD on powder samples. Their absence in the <2 μm fraction of the saprolite of LSAS as shown also by Reattoet al. [2010] on powder samples, while observed on the polished section of the Bw horizon, is likely related to their lower content consistently with the lower content of elongated particles observed in LSAS compared to LVS, as discussed above.
4. Conclusion
Our results showed that the 2:1 phyllosilicates present in Bw horizons of latosols and identified by many authors as mica or HIVs by using XRD can be recognized on BESI as elongated particles 1 to 30 μm long and 0.2 to 5 μm wide, most of them showing an internal layer organization. The chemical composition of the core of the largest particles in the two Bw horizons was consistent with poorly weathered muscovite with probably a small proportion of Al in the interlayer space as hydroxy-Al. When the K2O content decreased, indicative of a stronger weathering of the primary minerals such as muscovite, the chemical analysis showed that the proportion of hydroxy-Al in the interlayer space increased. We assume that these particles correspond to the HIVs recognized earlier in the literature. The fact that HIVs were not identified in the clay fraction of LSAS by XRD whereas they were for LVS has to be related to the much lower number of particles with morphologies and chemical compositions of 2:1 minerals, particularly those <2 μm in size, ranging from poorly weathered muscovite to HIVs in LSAS compared to LVS.
The morphology of the largest particles of weathered muscovite and the likelihood of HIVs observed in the groundmass of the two Bw horizons studied and their presence in high proportions in some areas of the groundmass of LVS indicate that they are allochthonous, originating from deep horizons of the latosols studied or from the saprolite in which the latosol has developed. According to this hypothesis, their presence in the Bw horizons studied should result from the transport of material by termite activity from horizons where the presence of these minerals is consistent with the geochemical processes responsible for the weathering of the parent material. Thus, we argue that the strong microgranular structure results from fragmentation and burrowing activity while the weak to moderate microgranular structure corresponds to old portions of channel and cavity walls, thus explaining why the microaggregates, whatever the microgranular structure development, incorporate allochthonous weathered muscovite and HIV particles.
Finally, our results are in favor of the biological origin of the microganular structure of latosols as discussed previously in many papers. They show that some latosols should be considered as a biomantle in which the physical properties related to the microstructure development, and the chemical properties related to the presence of weathered muscovites and HIVs, result from faunal activity since they started developing. Future work will analyze the degree of generality of the results obtained in our study and will also aim at analyzing both the development of the microgranular structure, the distribution of 2:1 minerals and the activity of termites over the entire thickness of latosols, from saprolite to the surface horizon.
Conflicts of interest
Authors have no conflict of interest to declare.
Acknowledgments
The authors would like to thank Ida Di Carlo for managing the SEM/EDS equipment as well as providing expert advice on the chemical analyses recorded. They also thank Christian Le Lay for impregnating the samples, Sylvain Janiec for preparing high quality polished sections and Patricia Benoist-Juliot for technical assistance during observation and analysis sessions with the SEM/EDS. Finally, the authors acknowledge support from the LabEx VOLTAIRE (LABX-100-01) project.