

 CC-BY 4.0
1. Introduction
The experimental study described here is the largest lab-scale simulation, to date, of degassing processes that occur due to CO2 dissolution from water, as happened catastrophically at Lake Nyos in Cameroon (Africa) in 1984 and 1986. Although perhaps rare, these limnic eruptions are deadly. Our work provides laboratory data required by simulations of these events. Specifically, we examine the conditions of CO2 supersaturation required for degassing, and the delay times corresponding to bubble nucleation and growth.
A CO2-driven limnic eruption is an explosive eruption that happens in large volumes of static water with CO2 solution. Usually such solutions stay at the bottom of a lake, but in 1986 a massive amount of CO2 was released from Lake Nyos in a very short time. This disaster caused the death of more than 1700 people and the released CO2 gas flowed down the hill to the village about 26 km away from the lake [Kling 1987]. Two years earlier, in 1984, a similar disaster happened in Lake Monoun (Cameroon) causing the death of about 40 people [Sigurdsson et al. 1987]. Many researchers agree that the rapid exsolution of CO2 from the lakes is the main reason for the eruptions causing the disasters [Kerr et al. 1987; Kling et al. 1987; Zhang et al. 1996]. It was hypothesized that CO2 leaked into the lake through the cracks in the surrounding rocks and then dissolved into the water [Schmid et al. 2004]. After a long period of time, the concentration of CO2 in the water reached a relatively high level. An eruption could have been triggered by any destabilizing factors such as a landslide or a heavy rainfall [Tassi and Rouwet 2014] causing the CO2 solution to move upwards and become supersaturated due to the decrease of its hydrostatic pressure. In these two settings situations, huge amounts of CO2 gas with entrained water droplets erupted from the lake and caused lethal disasters.
The risk of CO2 leakage should be considered carefully because of the development in recent years of CCS (carbon dioxide capture and storage) technology, especially with the technology of CO2 sequestration using geological reservoirs [Benson et al. 2002; Butt et al. 2012; Kim et al. 2018; Proust et al. 2016]. CCS technology means huge amount of CO2 would be stored in geological formations in oil and gas fields. Once CO2 leakage happens in these reservoirs, there are possibilities of the CO2-brine leakage via faults. The brine can migrate and eventually reach near-surface water leading to the potential of eruption [Jung et al. 2015; Lewicki et al. 2007; Shipton et al. 2005]. Limnic eruption related studies have also been carried out recently. Hirslund and Morkel [2020] investigated Lake Kivu, one of the African Great Lakes. They analyzed safety-related parameters for long-term, sustainable gas extraction management to prevent the lake from erupting in the future. Sánchez-Españaet al. [2020] investigated an artificial degassing application for a case of CO2 accumulation at the bottom of an open pit lake from a mine in Spain. In order to prevent a limnic eruption from happening, several degassing systems were analyzed and used. It was found that the designed systems could successfully extract most of the CO2 at the bottom of the lake in a controlled way.
Studies on the composition of lake waters were firstly carried out after the catastrophic lake eruptions in Cameroon. Kling et al. [1989] had measured the physical quantity and the chemical composition of Lake Nyos. The results showed that the concentration of the CO2 at the bottom of the lake keep increasing after the eruption while the temperature distribution remains invariant. Giggenbach et al. [1990] had analyzed the gas component dissolved in the lake and proposed that more than 24 tons of CO2 was discharged from a depth greater than 100 m during the eruption. Evans et al. [1993] concluded that the CO2 dissolved in the lake comes from a crack on the lake bed and the concentration of CO2 under the depth of 150 m grows at a speed of 2.6 × 10⁸ mol per year.
Studies on using degassing pipes to reduce the concentration of CO2 at the bottom of the lake were also carried out. Freeth et al. [1994] proposed several plans on how to perform the degassing process under controlled conditions. One way was to install one or more vertical pipes that connect the lake bottom and surface. A pump was used to lift the water in the pipe from the bottom to the surface until the degassing process became stable and spontaneous. This degassing system effectively reduced the concentration of CO2 at the bottom of the lake. In 1995, engineers from France and Switzerland installed a vertical pipe (200 m in length and 0.14 m in diameter) in Lake Nyos. A mixture of gas and water erupted from the pipe exit and reached a height of 21 m [Halbwachs et al. 2004]. Kling et al. [2005] found that installation of the degassing pipes reduced the content of CO2 at the bottom of the lake by 12–14% after a long period operation. Two additional degassing pipes with a diameter of 0.26 m were installed in 2011 and this resulted in a greater gas removal rate up to 1.2 Gmol per year [Kusakabe et al. 2017].
Studies on the theory of eruption were carried out by several researchers. Zhang et al. [1996] analyzed the mechanism of CO2-driven lake eruption and established a one-dimensional steady state model to calculate the maximum velocity and maximum height that the gas-water mixture could achieve during the eruption. Zhang et al. [1997] experimentally investigated the dynamic processes of CO2-driven eruptions by suddenly decompressing the pressure in a small-scale CO2–H2O polymer system. Zhang and Kling [2006] also investigated possible ocean eruptions as well as lake eruptions, using a one-dimensional steady state model based on an analogy to the mechanisms of volcanic eruptions.
Although the one-dimensional steady state model could predict the maximum velocity and maximum height of an eruption, it could not reveal any “transient” processes of eruption. Therefore, a large-scale 3-D model is necessary for investigating the whole process, from the very beginning of the bubble formation, to the vigorous upward two-phase flow, until the end of the dynamic eruptions. To accomplish this, a detailed experimental study is required to obtain correlations among variables for establishing the dynamic model.
In this investigation, an experimental apparatus, with a scale much larger than that in the previous study of Zhang et al. [1997], was designed, installed and used to measure the key parameters of the degassing processes under different depressurizing conditions. The diameter of the CO2 solution container is 100 times greater than the average bubble diameter and hence greatly reduces the vessel-wall effect on the fluid. The aim of this study is to experimentally obtain the following correlations useful in establishing a transient numerical simulation model: (1) the correlation of CO2 solution supersaturation (ΔP) required for degassing; (2) the correlation of time delay (Δt) corresponding to bubble formation. Furthermore, the variations of the key quantities (void fraction, number of bubbles, and average diameter of bubbles) have been analyzed. The void fractions measured in different depressurizing ways are also investigated and compared.
2. Methods
2.1. Design of the experimental system
The experimental system is designed to: (1) produce a CO2 saturated solution in the CO2 solution container; (2) simulate the degassing process by decreasing the pressure in the container containing the solution; (3) collect pressure and temperature data during the degassing process, and (4) use a high speed camera to record the images during the experiment. The experimental system consists of four subsystems shown in Figure 1(a): CO2 solution container system (I), pressure vessel system (II), gas cylinder (III) and image record system (IV).
Experimental system. I - CO2 solution container system; II - Pressure vessel system; III - Gas cylinder; IV - Image record system; 1 - CO2 cylinder; 2, 3, 24, 25 - Gas inlet valves; 4 - Water inlet valve; 5 - Water inlet; 6 - Water outlet; 7 - Water outlet valve; 8 - Temperature sensor; 9 - Gas diffuser; 10, 16, 22 - Pressure sensors; 11 - pH sensor; 12 - Observation windows; 13 - Plate light source; 14 - High speed camera; 15 - CO2 solution container; 17 - Liquid shield; 18 - Junction valve; 19, 21 - Gas outlet valves; 20 - Gas outlet; 23 - Pressure vessel; 26 - N2 cylinder.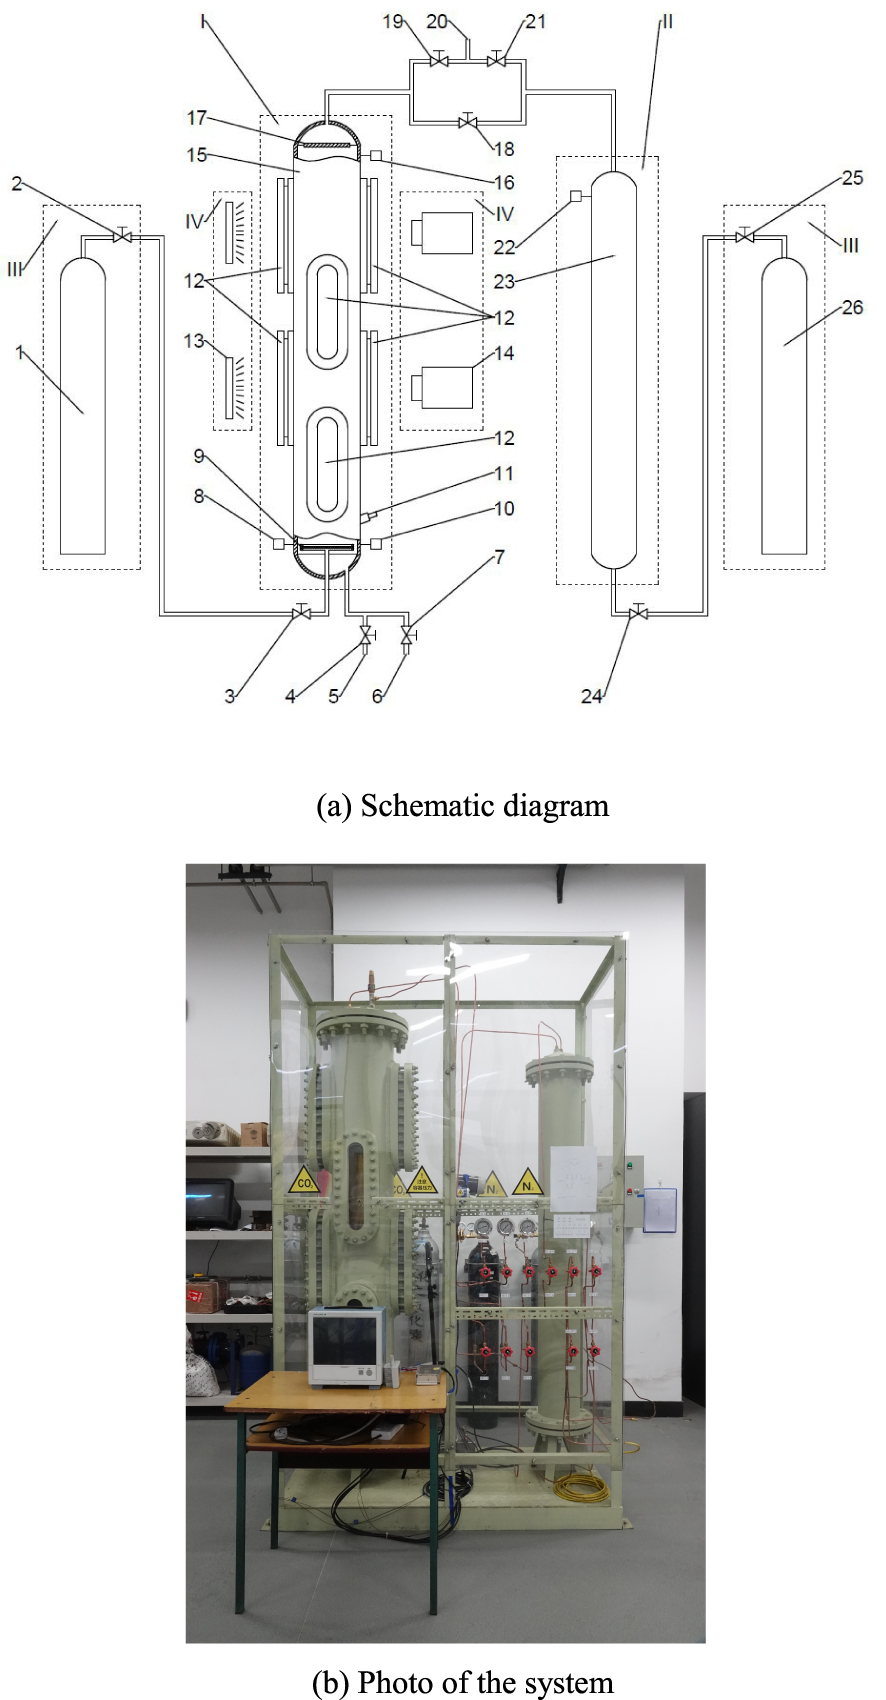
There are 4 pairs of observation windows at different heights around the CO2 solution container, and each pair of windows is set face to face. A plate light source is set behind one window and a high-speed camera is set behind the opposite window. The pressure sensors, temperature sensors and the pH sensor are mounted at the bottom of the CO2 solution. Pressure sensors are also mounted at the top of the CO2 solution container as well as the top of the pressure vessel to measure the pressures of the gas. The CO2 cylinder is connected to the bottom of the CO2 solution container; the top of the CO2 solution container is connected to the pressure vessel. The N2 cylinder is connected to the bottom of the pressure vessel.
The functions of different parts in the experimental apparatus are as follows: The CO2 gas flows from the CO2 cylinder (1) into the CO2 solution container (15) and dissolves into the water after passing the gas diffuser (9). The water inlet valve (4) and the water outlet valve (7) are used to control the inlet and outlet water flow respectively. The temperature sensor (8) is used to measure the solution temperature. Two pressure sensors (10 and 16) are used to measure the pressures respectively from the bottom and the top of the CO2 solution container (15). In order to measure the pH of the solution under different experimental conditions, a pH sensor (11) is also installed. The 8 observation windows (12) around the container transmit light and record the image. The plate light source (13) is used to light up the bubble edges so that the high-speed camera (14) can record images more clearly. The liquid shield (17) is designed to prevent water droplets carried by the high-speed gas from rushing into the gas outlet. The CO2 gas coming out from the solution flows to the gas outlet (20) after passing through the gas outlet valve (19). The gas in the pressure vessel (23) flows to the gas outlet (20) through gas outlet valve (21). The junction valve (18) connects the CO2 solution container and the pressure vessel. N2 gas flows from the N2 cylinder (26) to the pressure vessel (23) through gas inlet valves (24 and 25). The pressure sensor (22) is used to measure the pressure in the pressure vessel (23). The N2 cylinder (26) was mainly used to speed up the drain of the CO2 solution in the container (15) and to dry its inside after each measurement, which was accomplished by opening valves (18, 24 and 25) to connect the CO2 solution container (15) and the N2 cylinder (26) and hence to increase the pressure inside the CO2 solution container (15).
In the experimental system, Figure 1(b), the CO2 solution container is 2000 mm in height and has an external diameter of 325 mm. The actual liquid level height in the CO2 solution container is only 1560 mm so that there is sufficient space above the liquid level to prevent the solution from overflowing during the degassing processes. The volume of the liquid in the CO2 solution container is about 0.11872 m3 and the volume of the gas in the pressure vessel is about 0.05376 m3. The pressure sensors have a measurement range from 0 to 4 MPa with an accuracy of 0.5%. In this experiment, the degassing processes were measured for pressures ranging from 0.1 MPa to 2.0 MPa (all the pressures mentioned in this study are gauge pressures), corresponding to a water depths ranging from 10 m to 200 m. The experimental apparatus is enclosed by polycarbonate plates fixed on a steel frame for safety consideration.
2.2. Experimental procedure
The first step was to make a CO2 saturated solution. Pure water was first injected into the CO2 solution container. Then valve 3 was opened to let the CO2 from the CO2 cylinder flow and dissolve into the water in the container under certain pressure. According to Zhang et al. [1997], more than 99% of the CO2 dissolved into the water was molecular CO2, and the rest reacted with water and became H2CO3. Only a small part of the H2CO3 proceeded to generate CO32−, HCO3− and H+ through primary and secondary ionization. Since the ionization of the H2CO3 changes the pH of the solution, the degree of the saturation can be determined from the pH value. Whether the solution became saturated with CO2 was determined by monitoring the readings on the pH sensor. To make the CO2 saturated solution, CO2 was bubbled into water until the readings on the pH sensor stop changing. The ambient temperature was 20 °C during the experiments. Only tap water was used in this experiment. The particle-effect on bubble nucleation has not been investigated in this study.
In order to observe different degassing phenomena and obtain the wanted correlations, the following types of degassing processes were adopted:
A. Depressurizing with a fully-open valve;
B. Depressurizing with a semi-open valve;
C. ΔP - measurement during the degassing;
D. Δt - measurement during the degassing.
Degassing process A was the fastest process that could be achieved, and degassing process B was used for comparison with process A. Process C was applied to measure the CO2 solution supersaturation (ΔP) required for degassing. Degassing process D was used to measure the time delay (Δt) corresponding to bubble formation. Figure 2 shows the pressure change over time under the four degassing processes, with initial pressure of 1.0 MPa. Detailed experimental procedures of the four degassing processes can be found in Appendix A.
Pressure change over time under different degassing processes. (Initial pressure = 1.0 MPa.)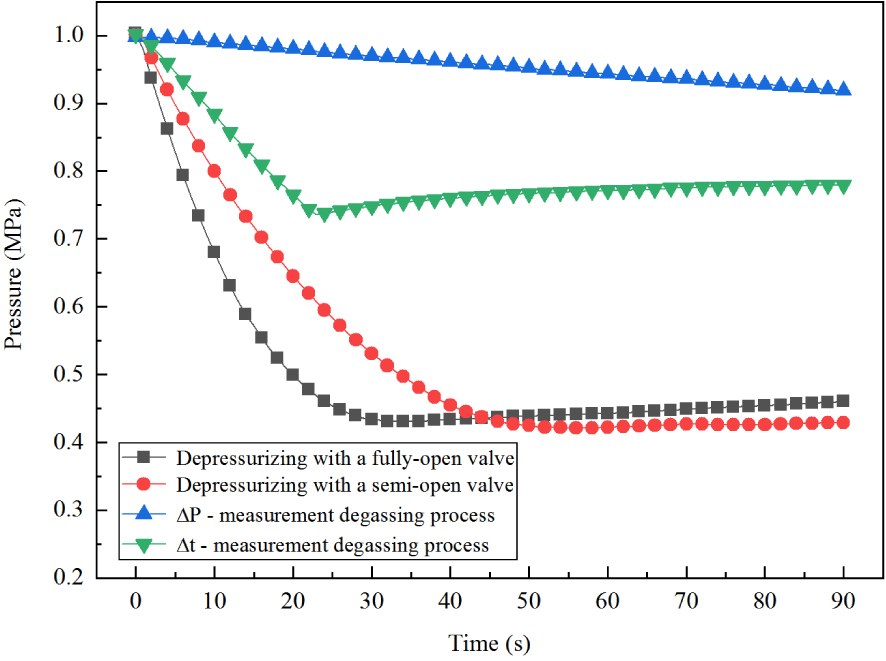
3. Results and discussions
Of the four couples of windows around the CO2 solution container, the third couple from the top was chosen because the windows were located near the half height of water level. The images we processed are in the center of the window which is 60 mm in width and 100 mm in height. ImagePro Plus® was used to process the images.
In the series of images of degassing recorded in Figure 3, the initial pressure was 0.5 MPa, and the degassing process was triggered by fully opening the valve. The images were recorded for 70 s after opening the valve. Bubble nucleation happens soon after the opening of the valve (Figures 3(a), and (b)). Then the number of bubbles begins to increase along with the growth of the bubble diameters (Figure 3(c)). The distance between bubbles remains small at this stage. Bubble diameters keep growing and the distances between the bubbles begins to increase slightly (Figure 3(d)). Then the ascent velocity of the bubbles reaches a maximum value and the degassing process becomes violent (Figures 3(e), and (f)). The distances between the bubbles becomes smaller while the bubble diameters keep growing (Figure 3(g)). Finally, the number of bubbles decreases (Figure 3(h)); many minute bubbles appear and the bubble diameters begin to decrease.
Images of degassing processes. (Initial pressure: 0.5 MPa; depressurizing with a fully-open valve; recording time: 70 s after opening the valve; Time interval between pictures: 10 s.) (a) Time 0 s; (b) time 10 s; (c) time 20 s; (d) time 30 s (e) time 40 s; (f) time 50 s; (g) time 60 s; (h) time 70 s.
We found that although the depressurization rate was high at the beginning (Figure 4), the void fraction stayed at almost zero for a period of time at the beginning (i.e. no bubbles appeared immediately). This implies that there exists a solution supersaturation required for degassing, and there may be a time delay for bubble formation. This observation motivated the investigations reported below.
3.1. Measurement of CO2 solution supersaturation (ΔP) required for degassing
When we depressurize the CO2 solution, the initial saturation pressure is greater than the pressure at which the CO2 solution eventually degasses, indicating that there exists a pressure difference, ΔP, which is required for degassing. Any pressure drop less than the ΔP will not result in degassing. In order to minimize process influence, ΔP was measured in a very slow pressure drop process, the so called ΔP-measurement degassing process, by finely adjusting the gas outlet valve opening.
As shown in Figure 5, with the increase of the initial pressure from 0.1 MPa to 1.0 MPa, the supersaturation required for degassing increases monotonically from 0.025 MPa to 0.27 MPa, i.e. the greater the initial pressure, the more degree of supersaturation. However, when the initial pressure is greater than 1.5 MPa, the supersaturation approaches a constant value of about 0.35 MPa.
The correlation of initial pressure and pressure drop to saturation (the fitting curve in Figure 5) is
| (1) |
This correlation is based on the experimental data in the initial pressure range: 0.1 MPa–2.0 MPa. The software, fitting category and fitting function used are Origin®, Growth/Sigmoidal, and Logistic/Slogistic1 respectively. More information on fitting errors can be found in Appendix B, Table 1.
3.2. Measurement of time delay (Δt) corresponding to bubble formation
We also observed that bubbles only come out of solution after a time delay (Δt) once the pressure drop meets the required value, ΔP. This time delay is defined as the time interval between the time when the pressure drop equals the ΔP and the time as soon as bubbles appear in the solution. The measurement of time delay (Δt) is based on the result of the ΔP measurement. Once the pressure drop equals the corresponding ΔP, the valve was immediately closed and the time until the first appearance of bubbles in the solution was measured.
Void fraction change with respect to depressurization rate. (Initial pressure: 0.5 MPa; depressurizing with a fully-open valve.)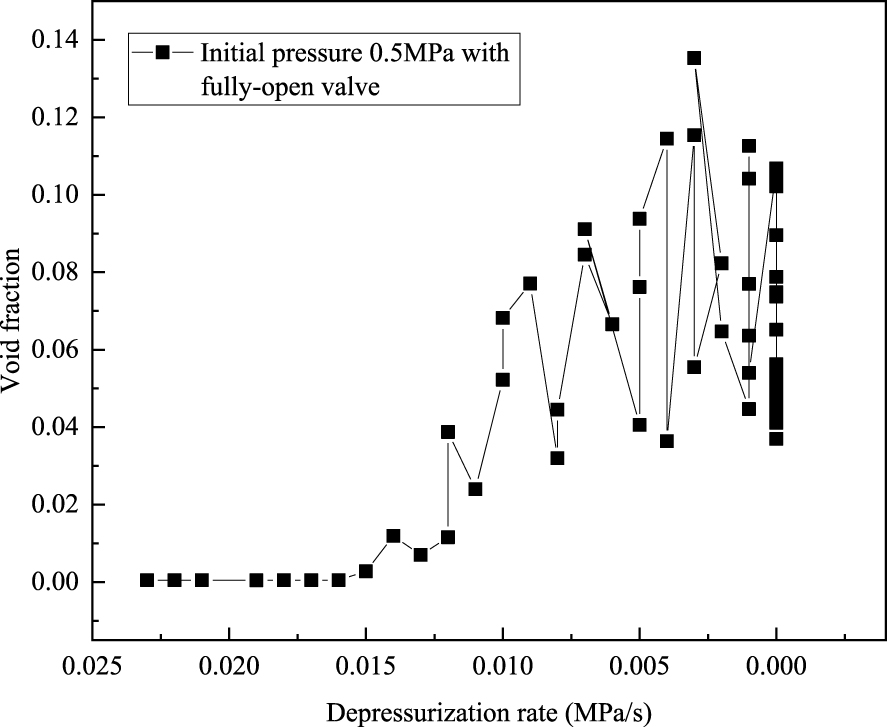
Figure 6 shows the time delay (Δt) with respect to different initial pressures, along with the corresponding fitting curve. As we can see, the time delay is longer when the initial pressure is low. It reaches 20 s when the initial pressure is 0.1 MPa. With the increase of initial pressure, the time delay becomes shorter and eventually approaches to about 10 s when the initial pressure is greater than 1.0 MPa.
The relation between the time delay Δt (in s) and the initial pressure P0 (in MPa) is:
| (2) |
3.3. Variations of void fraction, number and average diameter of bubbles
Using ImagePro Plus® to process the images of the degassing processes, we obtained the void fraction, the number of bubbles and the average diameter of bubbles. Figure 7 shows the variations of these variables over time with different initial pressures under fully-open valve degassing process conditions.
Supersaturation (ΔP) with respect to initial pressures, along with the corresponding fitting curve.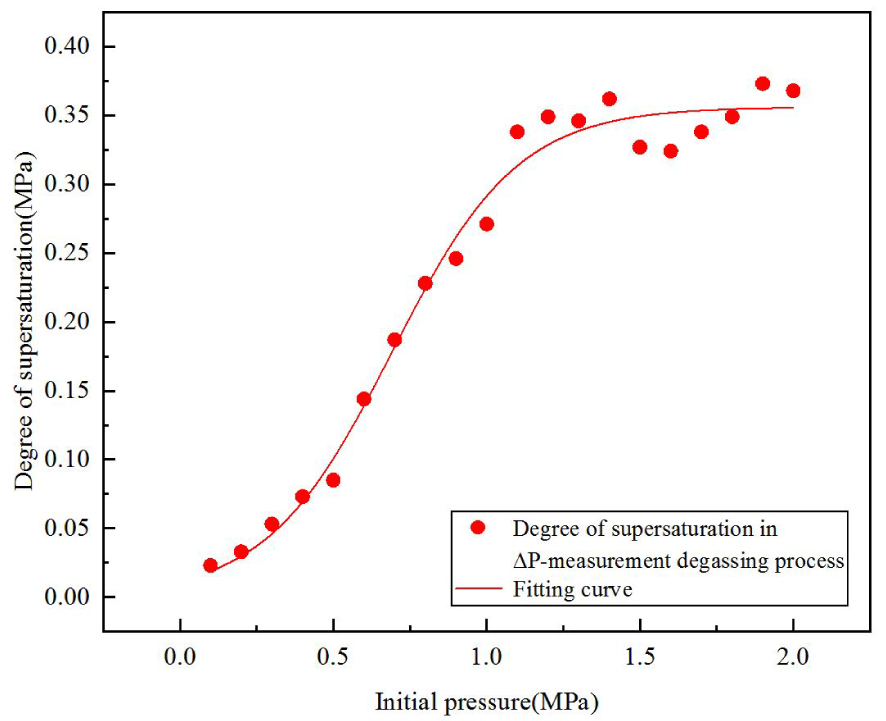
Time delay data with respect to the initial pressures, along with the fitting curve.
Variations of pressure, void fraction, number of bubbles, and average diameter of bubbles over time, under a fully-open valve degassing process.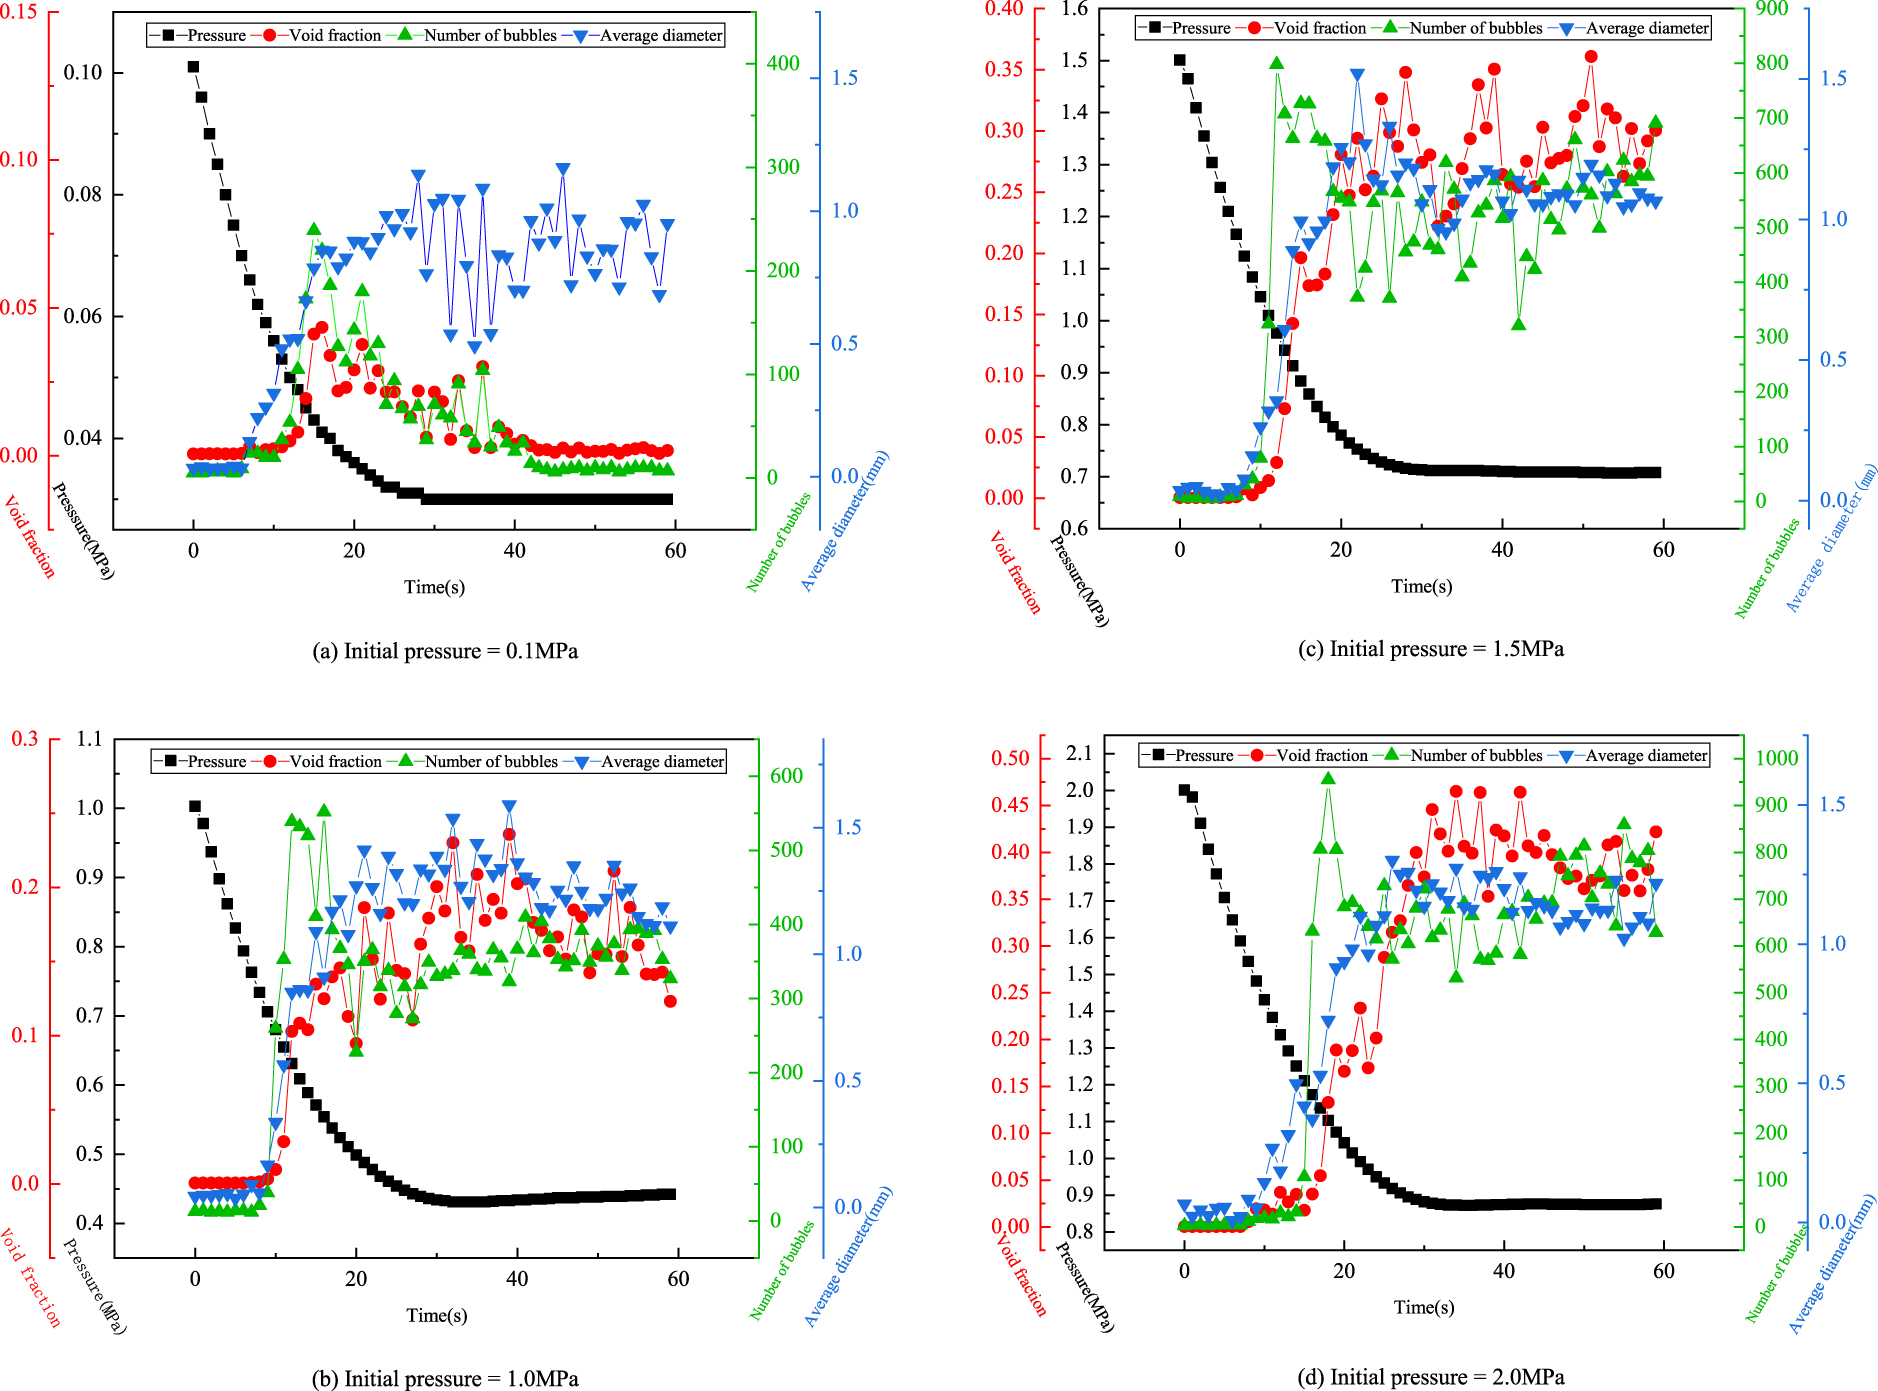
The void fraction increases in the first 10 to 15 seconds after the beginning of degassing (Figures 7(a) to 7(d)). The peak value of the void fraction increases as the initial pressure increases, and the peak value region of the void fraction becomes flatter, and covers a longer time period.
The sharp increase of the number of bubbles appears earlier than that of the void fraction. The higher the initial pressure, the more bubbles. When the initial pressure is low (0.1 MPa) as shown in Figure 7(a), the number of bubbles is almost monotonically falling after it reaches the peak value. But when the initial pressure is above 1.0 MPa, the number of bubbles goes up and down many times after its peak value. The scatter in the variables shown in Figures 7(b), (c), (d) is mainly due to a big change (with time) in bubble volume measured through a small observation window of the apparatus (i.e. measured through a small two-phase body). In a relatively small observation scope, many bubbles appeared in one movement, but they disappeared very quickly afterwards. Thus, the void fraction fluctuation shown in each relevant figure is a reflection of this phenomenon. According to the definition of void fraction, it is also not difficult to understand the scatters in the other two variables (average diameter of bubbles and number of bubbles).
Small bubbles that stuck on the wall of the container rose at the beginning of the degassing process and produced irregular bubble diameters during the first 10 seconds. The average diameter of bubbles reaches its peak value at the time between 20 to 30 seconds (Figure 7). Then, it keeps fluctuating and becomes stable after 30 seconds. The initial pressure has no obvious influence on the average diameter of bubbles.
We also found that when we decrease the pressure, the number of bubbles increases one-step earlier than the void fraction under any initial pressure conditions. This phenomenon becomes more obvious with the increase of initial pressure. Compared with the void fraction and the number of bubbles, the average diameter appears relatively stable in the last stage of the degassing process when the initial pressure is above or equal to 1.5 MPa (Figure 7c, d).
Void fraction change over time under two degassing process conditions (depressurizing with fully-open valve and with semi-open valve).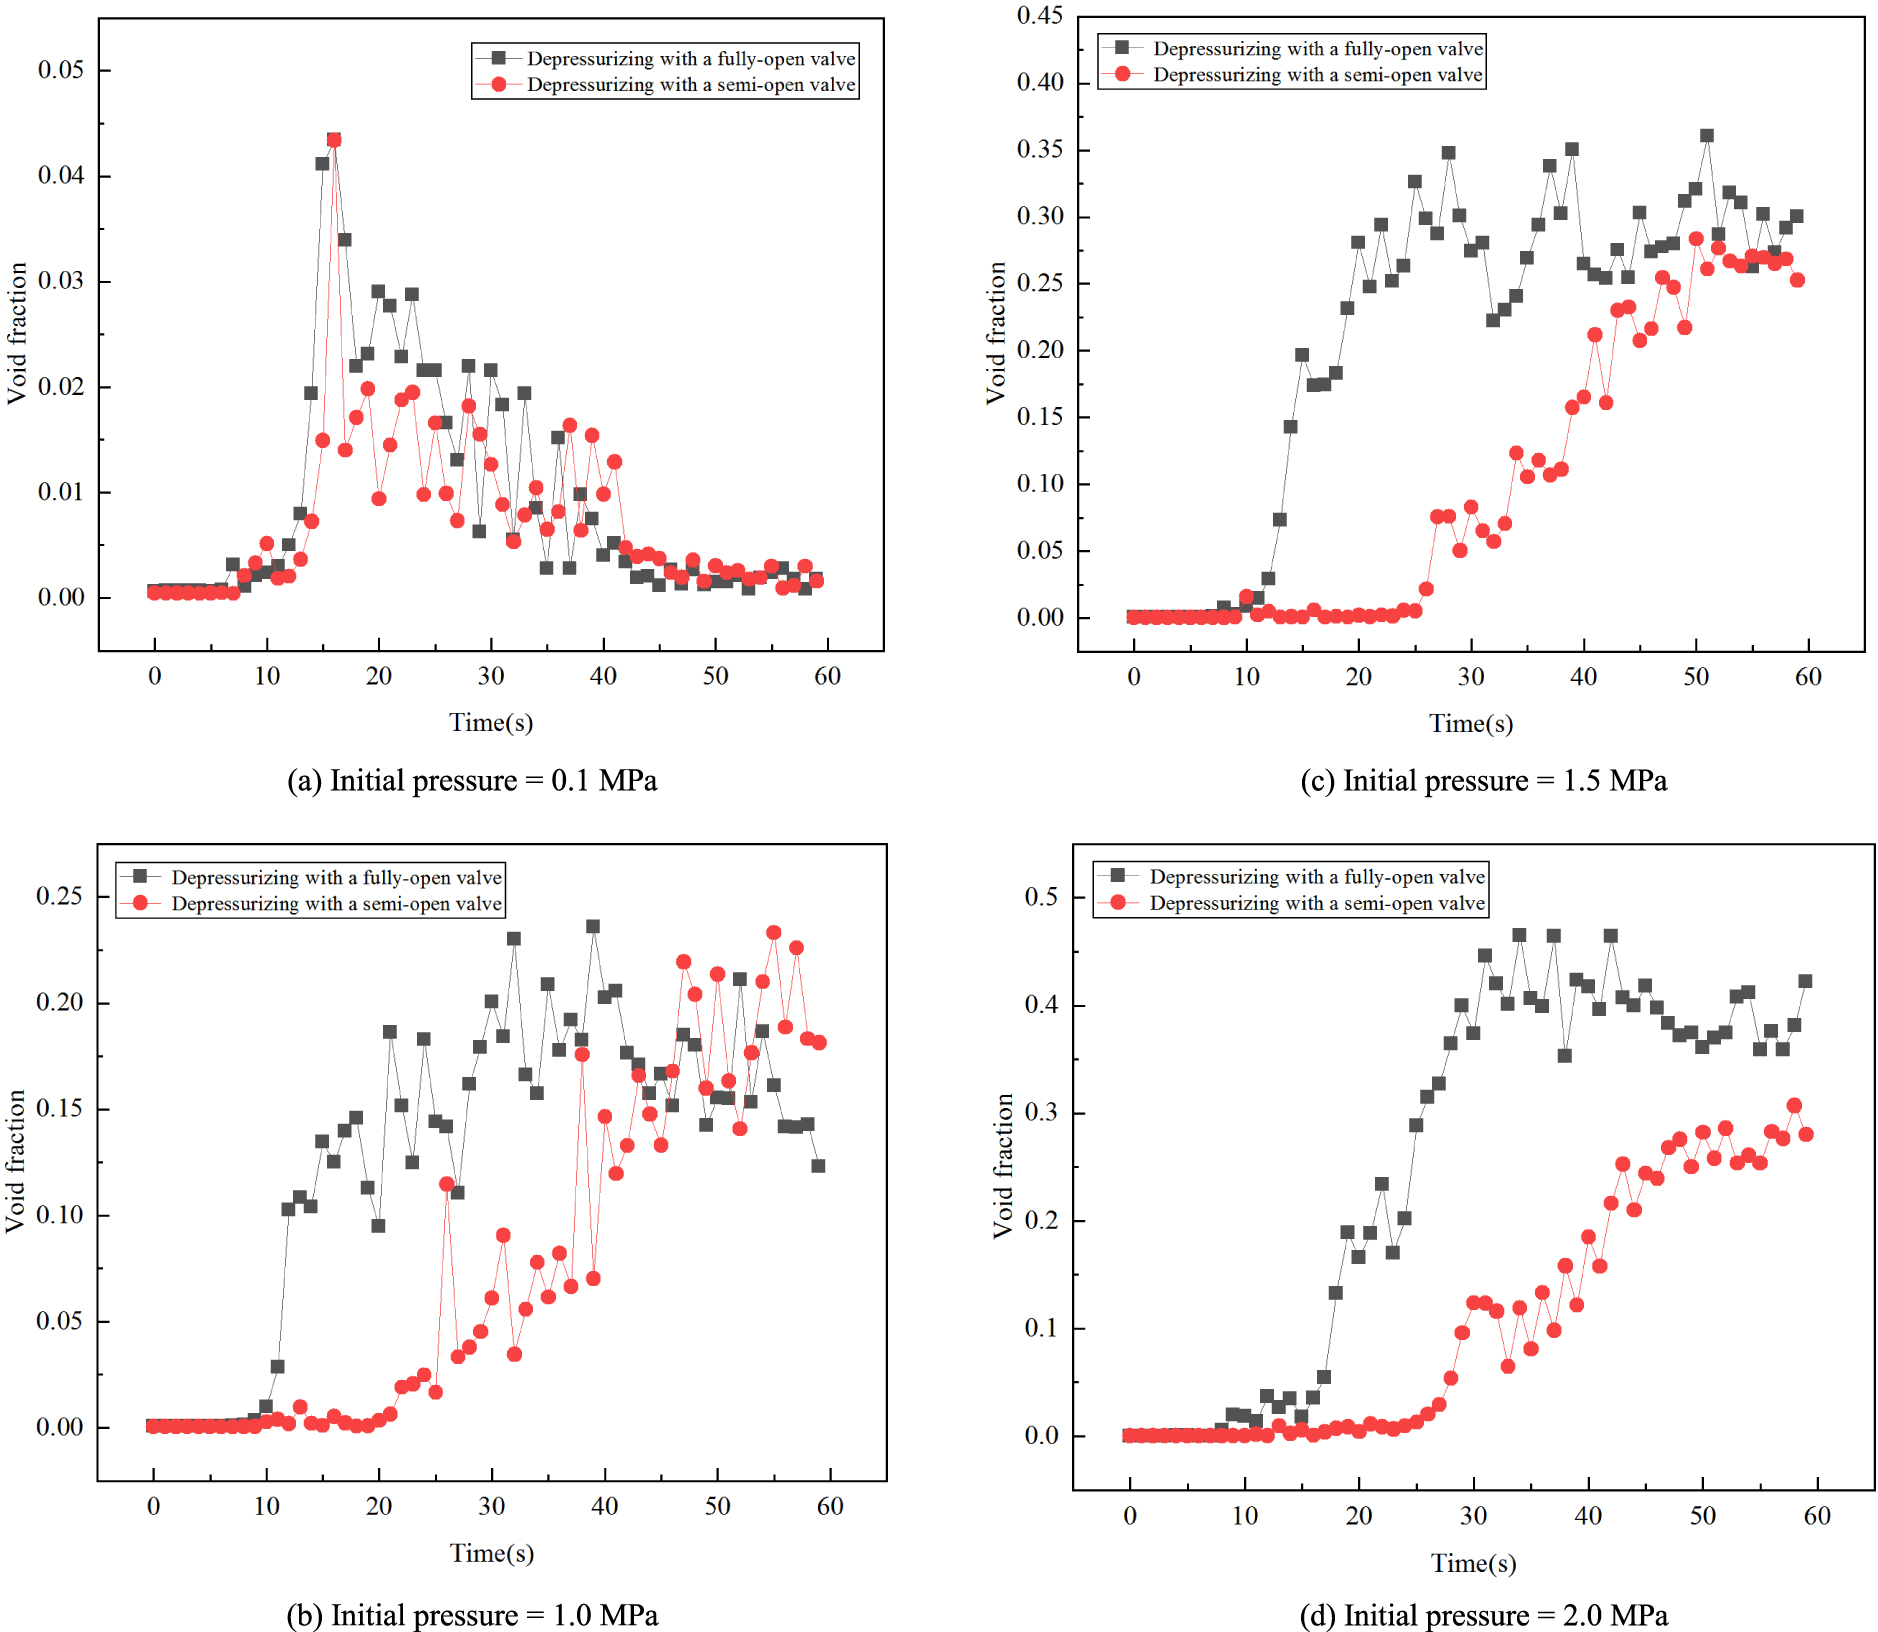
3.4. Void fraction change over time under different degassing process conditions
Two depressurizing degassing processes (fully-open valve and with semi-open valve) produced different results in void fraction behavior. Figure 8 shows the void fraction change over time with four different initial pressures (0.1 MPa, 1.0 MPa, 1.5 MPa and 2.0 MPa) under the two degassing process conditions.
When the initial pressure is low (0.1 MPa), Figure 8(a), the void fraction changes over time are about the same under the two degassing process conditions, indicating that the details of degassing have less influence on the void fractions when the initial pressure is low.
However, when the initial pressure is above or equal to 1.0 MPa, as can be seen from Figures 8(b) and 8(c), the void fraction corresponding to the degassing processes with a fully-open valve increases earlier and faster than that with a semi-open valve. This shows that the process of degassing has an influence on the void fraction when the initial pressure is high. This influence becomes more significant when the initial pressure is as high as 2.0 MPa, Figure 8(d). The void fraction under a fully-open valve condition is always larger than that under the semi-open valve condition for equal times.
The valve control methods (fully-open and semi-open valve conditions) used in the measurements were mainly designed to allow us to operate the experiment with relative ease. The rate of the pressure drop under the fully-open valve condition is greater than that under the semi-open valve condition. Although the fully-open and semi-open valve conditions could somehow relate to the faster and slower ascending flow scenarios respectively, we found it was hard to experimentally simulate the lake degassing scenarios using such a small experimental apparatus. In order to find out the flow regime changes in a lake (including the bubble size distributions at different times and depths of the lake), we will carry out a numerical simulation as our second-phase study to investigate the real lake transient degassing scenarios based on the experimental data and correlations obtained in this first-phase study.
4. Conclusions
Our experiments provide the following relations and results:
(1) A correlation between the supersaturation ΔP (in MPa) required for degassing and the initial pressure P0 is:
(Valid for: initial pressure MPa to 2.0 MPa; solution temperature = 20 °C).
(2) A correlation between the time delay Δt (in s) corresponding to bubble formation and the initial pressure P0 is:
(Valid for: initial pressure MPa to 2.0 MPa; solution temperature = 20 °C).
(3) The initial pressure has no obvious influence on the average diameter of bubbles. The higher the initial pressure, the greater the peak value of the void fraction. The number of bubbles always changes one-step earlier than the void fraction under any initial pressure conditions.
(4) The depressurizing method for the degassing has less influence on the void fractions when the initial pressure is low. The influence becomes obvious when the initial pressure is greater or equal to 1.0 MPa.
These experiments have contributed to our understanding of CO2 degassing processes in terms of CO2 supersaturation required for degassing, and the delay times corresponding to bubble nucleation and growth. If they are incorporated into numerical simulations of the CO2-driven lake eruption processes, our understanding of degassing in nature will be greatly improved.