


 CC-BY 4.0
1. Introduction
Preparation of soil salinity map is of great importance in the management of environment and agriculture. Most agricultural crops are sensitive to the high intensity saline soils [Goossens and Van Ranst 1998]. Furthermore, this phenomenon has a negative impact on the surface water and groundwater resources as well as on the social structure of a region [Li et al. 2014]. About 830 million hectares of the world soil resources (around 7%), including Argentina, Venezuela, Egypt, Iran, Pakistan, United States, India, China, and Australia, are affected by the soil salinity [Ghassemi et al. 1995]. In general, there is soil salinity in about 20% of the irrigated agricultural areas around the world, which is about 30% in the arid and semi-arid climates such as Egypt, Iran, and Venezuela [Goossens and Van Ranst 1998].
Remote sensing techniques are among the monitoring tools for the identification of soil salinity on a large spatial scale [Bouaziz et al. 2011]. Salt content of the soil affects the measured radiance in different wavelengths of the electromagnetic spectrum. Therefore, the processing of the satellite images can be used to produce saline soil maps [Metternicht and Zinck 2003]. However, there are some limitations to monitor the soil salinity by the satellite imagery such as (1) Different salts have different electromagnetic spectral absorption properties, which means that each wavelength can detect a particular type of salt, (2) The presence of vegetation cover can lead to mixed pixels producing an error in the detection of the salinity, (3) In some cases, the geometric properties of the salt surface due to the human activities on the soil, result in some ambiguities in the remote soil salinity detection [Eklund 1998].
In the last three decades, many studies have been accomplished to detect soil salinity using remote sensing data, especially in the optical spectral ranges. Satellite images have been used for monitoring, detecting, and generating saline soil maps all over the world [Bouaziz et al. 2011, Lasne et al. 2008, Metternicht and Zinck 2008, Verma et al. 1994].
1.1. Previous studies on detecting the saline soils using optical remote sensing
A lot of studies have been carried out to prepare saline soil maps using optical remote sensing based on the use of various vegetation indices such as NDVI1 , SAVI2 , RVI3 , SBI4 , GVI5 , and WI6 [Alhammadi and Glenn 2008, Eldeiry and Garcia 2008, Jabbar and Chen 2008, Lobell et al. 2010, Matinfar et al. 2013, Wang et al. 2002, 2013, Zhang et al. 2011]. Madani [2005] detected and monitored the soil salinity over the Siwa Oasis, Egypt using two Landsat images acquired on 1987 and 1999. The salinity index of pixels in the 1987 and 1999 was measured to be about 0–0.2 and 0–0.4, respectively. These values showed that the soil salinity had increased in that 12-year period. Fernandez-Buces et al. [2006] investigated the correlation of the COSRI7 remote sensing index from the Landsat ETM sensor with the soil salinity parameters, including the EC8 and Sodium Absorption Ratio in the Mexican area of Texcoco. The coefficients of determination of the results with the EC and the Sodium Absorption Ratio were calculated to be 0.885 and 0.857, respectively. Wu et al. [2008] identified the soil salinity using 5 Landsat images from 1973 to 2006 and monitored the salinity changes using a normal supervised classification method. The overall accuracy of the detection of saline soils in this study was acquired as 90%. They also proved that the new irrigation methods have a significant effect on the reducing soil salinization speed. Bouaziz et al. [2011] provided the relationship for predicting soil salinity (EC parameter) using 18 indices of salinity, vegetation, and intensity derived from MODIS9 in the northeast of Brazil which is a dry region. Linear spectral separation method was used to separate the soil from the vegetation per pixel. The coefficient of determination and RMSE10 were determined as 0.4 and 12 μscm−1, respectively. Zhang et al. [2015] investigated the correlation between the EVI11 and NDVI derived from MODIS with the soil salinity (EC parameter) in the catchment area of the Yellow River in China. The results showed a higher correlation of the EVI compared with the NDVI. The coefficient of determination of the EVI with the EC was calculated to be 0.59–0.92 regarding the vegetation type. Yahiaoui et al. [2015] analyzed the relationship between topographic parameters and soil salinity using reflectance values of two Landsat 7 images in winter and summer and the DEM12 in the Lower Cheliff plain (Algeria) in 2013. They concluded that soil salinity had no correlation with slope gradient, while it was significantly correlated with elevation when the EC values were less than 8 dS/m.
1.2. Previous studies on detecting the saline soils in the range of microwave wavelengths
Bobrov [1999] demonstrated that the value of the surface roughness, soil moisture, and evaporation from the soil surface have a high sensitivity to the soil salinity changes. It was accomplished by experiments on the saline soil samples with different salinity levels and on the non-saline soil samples at a frequency of 6.25 GHz. Lasne et al. [2008] investigated the effect of the soil salinity on the dielectric constant of the soil and the SAR backscattering coefficient in the frequency range of 1 to 7 GHz by implementing simulated experiments. The results showed the high sensitivity of the imaginary part of the dielectric constant to the salinity as well as the high effect of the salinity on the soil radar backscattering. Moreover, the salinity influences on the VV polarization was greater than that of the HH. Gong et al. [2013] conducted experiments on 150 soil samples with different moisture and salinity levels at the different frequencies in the range of microwave wavelengths (0.2 to 20 GHz). They concluded that the soil salinity has no effect on the real part of the soil dielectric constant, but the effect of its changes on the imaginary part is considerable. Moreover, the highest sensitivity of the dielectric constant to the salinity was observed at frequencies below 2 GHz and this sensitivity was very low at the frequencies higher than 8 GHz. Chi et al. [2017] estimated the amount of dielectric constant of the soil and the soil salinity content. It was performed by using the recorded quantities of the emissivity at the microwave frequencies (1 to 10 GHz) over the saline soils in the laboratory. Furthermore, there was found a relationship for the soil salinity estimation by using the standard PSO13 and improved PSO optimization algorithms. The success ratio of the results in the two algorithms was calculated to be approximately 60% and 75%, respectively.
According to the literature, one of the methods for estimating the soil salinity is the use of the microwave data in the frequencies less than 7 GHz. In this regard, passive microwave satellite data such as AMSR214 measurements can be utilized. Thereafter, the passive microwave brightness temperatures of AMSR2 in some frequencies are dependent on the Total Precipitable Water (TPW) Vapor in addition to salinity [Du et al. 2015, Jones et al. 2010, Merrikhpour and Rahimzadegan 2017b]. TPW is the amount of the water vapor contained in a vertical column to the unit area from the ground up to the top of the atmosphere [Frouin et al. 1990]. Several methods are presented for estimating TPW based on the satellite remote sensing data including images in the optical wavelengths (0.4–14 μm) [Gao and Kaufman 2003, Merrikhpour and Rahimzadegan 2017a, Rahimzadegan and Mobasheri 2011, Seemann et al. 2003] and the microwave wavelengths [Deeter 2007, Du et al. 2015, Merrikhpour and Rahimzadegan 2017b, Zhou et al. 2016].
In general, most of the remote sensing studies to detect the soil salinity are within the range of optical wavelengths. Moreover, investigations in the microwave wavelength range were executed using active microwave wavelengths in the laboratory. In addition, little research has been accomplished on the detection of the saline soils using the passive microwave data. Therefore, the aim of this study is to detect the saline soils in Iran using the estimated TPW and the brightness temperature in the vertical and horizontal polarizations of the 6 GHz channel of AMSR2. To calculate the TPW, the combination of the optical and passive microwave data including data from MODIS, ASTER, and AMSR2 has been used. The implementations of this study are performed for 80 days from the four seasons of 2015–2016. In this regard, the study area and used data of this study are presented in the Section 2. Furthermore, the methodology of the study, including the method of estimating the TPW parameter and introducing the microwave indices to detect the saline soils is presented in this section. Analysis of the results, and finally, the conclusion are presented in the Sections 3 and 4, respectively.
2. Materials and methods
2.1. Study area
Iran is the selected area of this study located in the southwestern Asia with an area of 1.65 million square kilometers. The climate of Iran is arid and semi-arid for about 90% of its area. Summer in the central regions of Iran is very hot and the temperature in some conditions is more than 50 °C. The temperature in winter in many parts of Iran is negative and in some days it reaches below −30 °C in the northwestern area. The average annual precipitation in the central plateau of Iran is about 50 mm, on the northern coast is 1000 mm, and in total is about 250 mm [Qureshi et al. 2007]. The soil salinity is one of the critical issues in Iran that has a negative impact on the agriculture and its water resources. Some issues triggered the development and expansion of the soil salinity in the recent years in Iran. Those issues include the lack of the adequate drainage of the surface water and groundwater, the lack of proper management of water resources, the use of the salt water for irrigation of the fields and the presence of the salt in the soils naturally (especially in the central regions of Iran). The soil salinity in the central regions of Iran are high due to the high temperature and the presence of salt in its soils. About 50% of agricultural lands of Iran is affected by the salinity of the soil in various degrees [Qureshi et al. 2007, Taghizadeh-Mehrjardi et al. 2014]. Figure 1 shows the location of Iran and the zoning map of soil salinity [Ghassemi et al. 1995].
Iran’s position and the zoning map of soil salinity [Ghassemi et al. 1995].
2.2. Data processing
In this study, five remote sensing data sets were used. Those data sets include (1) the brightness temperature in different channels of AMSR2, (2) the daily land surface temperature product of MODIS, (3) the MODIS daily surface reflectance in bands 1 and 2 for producing NDVI, (4) the MODIS cloud product (MOD35), and (5) the ASTER DEM. Moreover, the soil salinity zoning map of Iran produced by Ghassemi et al. [1995] was used to select the training and test data for evaluating the proposed method for the saline soil detection.
2.2.1. Brightness temperatures of AMSR2
The AMSR-E15 sensor on board the NASA16 Aqua satellite was launched on May 4, 2002, and it was retired in October 2012 [Al-Yaari et al. 2014]. The AMSR2 sensor on board of the GCOM-W117 satellite was launched on May 18, 2012 by the Japan Aerospace Exploration Agency as an alternative to the AMSR-E. The GCOM-W1 satellite is the first generation of GCOM series satellites that plays a key role in the global study of the water and energy cycle. AMSR2 measures the brightness temperature at the horizontal and vertical polarization in 7 channels at 6.9, 7.3, 10.6, 18.7, 23.8, 36.5, and 89 GHz. The most significant difference between AMSR2 and AMSR-E is the improvement of the 25 km spatial resolution of the AMSR-E to 10 km [Kachi et al. 2014]. AMSR2 produces geophysical products such as TPW at sea and ocean surface, cloud liquid water, rainfall, sea surface temperatures, wind speed at sea surface, sea ice, snow depth, and soil moisture. AMSR2 image acquisition is twice a day when it is ascending (at 1:30 pm when passing through the equator) and when it is descending (at 1:30 am when crossing the equator) [Wu et al. 2016].
In this study, the brightness temperature in the horizontal and vertical polarizations in 18, 23, 36, and 89 GHz bands was used to estimate the TPW. Moreover, the brightness temperature in 6 GHz channel was used as an effective parameter to detect the saline soil for 80 days from 2015 to 2016 (20 days every season of year). In order to synchronize the utilized AMSR2 and MODIS images, the daytime images (ascending overpasses) were used [JAXA 2018].
2.2.2. MODIS data
According to the space programs of the USA, NASA set up a system to monitor, analyse, and investigate the earth surface, oceans, atmosphere, and their interactions called EOS18 [Gao and Kaufman 2003]. MODIS with 36 spectral bands as a member of EOS was launched on Terra platform in December 1999 and the second MODIS sensor was launched on the Aqua satellite in 2002 [García-Mora et al. 2012, Justice et al. 2002]. In this study, the daily land surface temperature and daily reflectance products of MODIS on board of the Terra satellite were used. The last product in bands 1 and 2 was used to calculate the daily NDVI which is required in the TPW estimation algorithm. Furthermore, in using NDVI and land surface temperature, the MODIS cloud product (MOD35) with a spatial resolution of 1 km has been used to identify clear sky pixels with a probability higher than 95% [Ackerman et al. 2010] in the given time interval [NASA 2018b].
2.2.3. Digital elevation model
The DEM is one of the key data sets in many hydrological and meteorological studies. In this research, an ASTER DEM image of Iran with a spatial resolution of 30 m was used in the TPW estimation algorithm [NASA 2018a]. ASTER was launched by NASA in 1999 with a spatial resolution of 15 to 90 m, on board of the Terra satellite. This sensor has been gathering data with 14 spectral bands since February 2000 [Tachikawa et al. 2011].
2.2.4. Ground truth data
In this study, 348 point data including 117 saline soil points and 231 non-saline soil points were gathered as the training set form the soil map of Iran represented by Ghassemi et al. [1995] (Figure 1). Moreover 126 data containing 49 saline soil points and 77 non-saline soil points were considered as the test data.
2.3. Methodology
In the studies on the soil salinity in the microwave wavelength range, the brightness temperature in the L, S, and C bands (1–8 GHz) has been used [Bobrov 1999, Chi et al. 2017, Gong et al. 2013, Lasne et al. 2008]. The sensitivity of the brightness temperature in these bands to the salinity is high. The brightness temperature indicates the microwave radiation of the objects. The amount of radiation is proportional to the surface emissivity, and surface emissivity indicates the ability of the objects to radiate [Jones et al. 2010]. Figure 2 shows the sensitivity of different frequencies in the range of microwave wavelengths to some environmental parameters [Ulaby et al. 1986].
The sensitivity of microwave frequencies to some environmental parameters [Ulaby et al. 1986].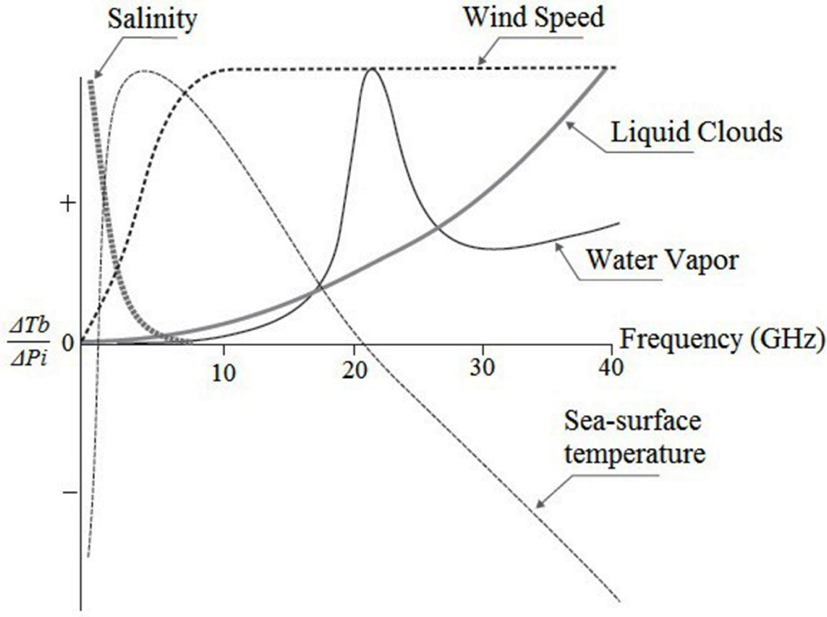
As shown in Figure 2, for the frequencies below 10 GHz, the lower the frequency, the higher the sensitivity to the salinity. In addition, in the saline soils with a low to high salinity, the brightness temperature at frequencies below 10 GHz in the vertical polarization is higher than that in the horizontal polarization [McColl et al. 2012]. Therefore, the difference in the brightness temperature between vertical and horizontal polarizations in this frequency range can be used to detect the soil salinity. Since the lowest frequency in the AMSR2 images is 6.93 GHz channel, in this research the brightness temperature of this band in the horizontal and vertical polarizations was used as the determinant parameter to identify the saline soil.
To investigate the difference in the brightness temperatures of the vertical and horizontal polarizations in the saline soils, the MPDI19 , and the ratio of the brightness temperature in the vertical to the horizontal polarizations (TBv∕TBh) at 6 GHz band were considered. The MPDI is a vegetation index in the microwave wavelength range that has been used in many studies. It is shown in (1) [Chen et al. 2014, Jackson and Schmugge 1991, Njoku and Li 1999]:
| (1) |
On the other hand, in the early studies, it was observed that the TPW value obtained from the algorithm based on the microwave brightness temperature in areas with high soil salinity shows a higher value than the real value. This higher value can be due to high dielectric coefficient of the saline soil and the high sensitivity of the microwave frequencies to this parameter [Lasne et al. 2008]. Therefore, in this research, the TPW obtained from AMSR2 images is also used along with the mentioned indicators as another determinant parameter for saline soil detection.
In this study, two procedures were used to identify the saline soils from the non-saline soils in Iran using the selected training data. In procedure 1, the TPW parameter and MPDI at the 6 GHz channel were used. In procedure 2, the TPW parameter and the ratio (TBv∕TBh) at the 6 GHz channel were used. Figure 3 schematically shows the steps of the implementation of this study.
The schematic flowchart of the implementation steps of this study.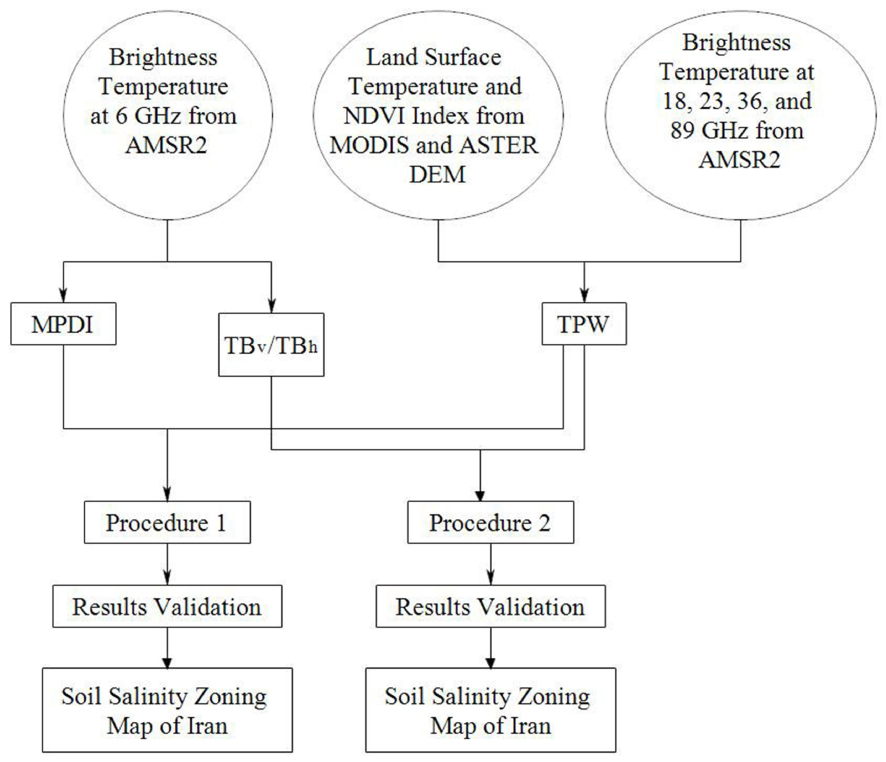
2.3.1. The algorithm of extracting TPW using AMSR2 data
In this study, the proposed algorithm by Merrikhpour and Rahimzadegan [2017b] was used to extract the TPW over the land from the AMSR2 measurements. Du et al. [2015] initially developed the TPW estimation algorithm presented by Jones et al. [2010] in the general form of (2) in both satellite ascending and descending overpasses:
| (2) |
| (3) |
2.3.2. Saline soil pixels identification
As mentioned in this study, three parameters MPDI at 6 GHz, the ratio (TBv∕TBh) at 6 GHz, and TPW are used to identify saline soils. For this purpose, the optimal threshold of these parameters must be calculated. In procedure 1 based on the values of the TPW and MPDI at 6 GHz using the training data, the optimal thresholds of these two parameters were calculated to separate the saline soils from non-saline soils. If at a pixel the values of the TPW and MPDI are higher than the calculated threshold values simultaneously, then that point was considered as the saline soil. In procedure 2, the extracted TPW and the ratio (TBv∕TBh) at 6 GHz were used. After acquired thresholds were implemented, a saline soil map was produced for each of the selected 80 satellite images. Then, the point which was assigned as the saline soil in the whole of 80 images was considered as a saline soil.
2.3.3. Results evaluation method
To evaluate the results of the saline and non-saline soil classification, the error matrix was produced using the test data, with overall accuracy and kappa coefficient [Congalton and Green 2008, Vieira et al. 2004] extracted. Equations (4) and (5) were utilized to calculate the overall accuracy and kappa coefficient, respectively [Congalton and Green 2008]:
| (4) |
| (5) |
3. Results and discussion
Initially, two assumptions were evaluated:
(1) In the saline soil pixels, the brightness temperature at 6 GHz channel in the vertical polarization is higher than that in the horizontal polarization.
(2) The TPW in the pixels with the saline soils has higher value than that in the non-saline pixels.
The evaluation was accomplished at two saline and non-saline points with approximately the same ground elevation that are fairly near each other in fifteen days from the four seasons of 2015–2016. The results are shown in Table 1 and corresponding charts are shown in Figure 4.
The results of the comparison between two saline and non-saline points in 15 days from the 4 seasons of 2015–2016, (a) TPW, (b) MPDI index, and (c) Ratio (TBv∕TBh) at 6 GHz band.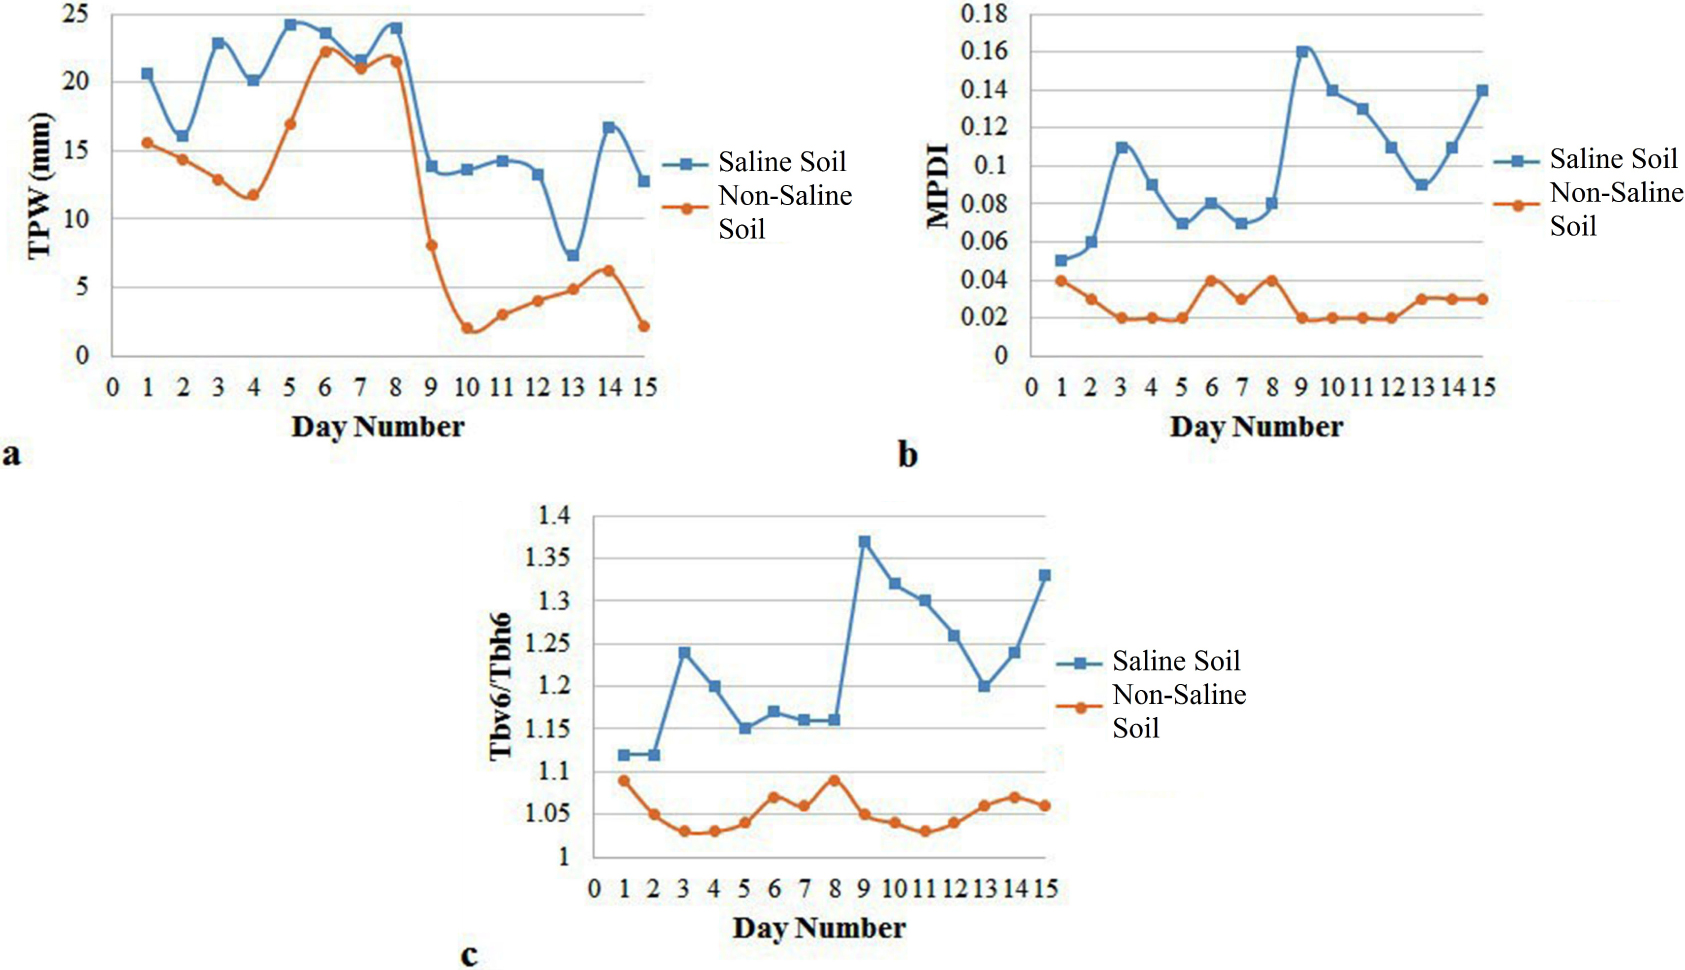
The results of the comparison of the TPW, MPDI, and (TBv∕TBh) at the 6 GHz channel for two saline and non-saline points in 15 days from the four seasons of 2015–2016
| Day number | Date | Saline TPW | Non-saline TPW | Saline MPDI | Non-saline MPDI | Saline (TBv6∕TBh6) | Non-saline (TBv6∕TBh6) |
|---|---|---|---|---|---|---|---|
| 1 | 3-May 2015 | 20.58 | 15.54 | 0.05 | 0.04 | 1.12 | 1.09 |
| 2 | 5-May 2015 | 16.13 | 14.38 | 0.06 | 0.03 | 1.12 | 1.05 |
| 3 | 7-May 2015 | 22.87 | 12.93 | 0.11 | 0.02 | 1.24 | 1.03 |
| 4 | 10-May 2015 | 20.09 | 11.74 | 0.09 | 0.02 | 1.2 | 1.03 |
| 5 | 4-Jul 2015 | 24.16 | 16.97 | 0.07 | 0.02 | 1.15 | 1.04 |
| 6 | 8-Jul 2015 | 23.58 | 22.29 | 0.08 | 0.04 | 1.17 | 1.07 |
| 7 | 13-Jul 2015 | 21.63 | 20.98 | 0.07 | 0.03 | 1.16 | 1.06 |
| 8 | 15-Jul 2015 | 23.91 | 21.54 | 0.08 | 0.04 | 1.16 | 1.09 |
| 9 | 4-Nov 2015 | 13.89 | 8.04 | 0.16 | 0.02 | 1.37 | 1.05 |
| 10 | 11-Nov 2015 | 13.63 | 2.01 | 0.14 | 0.02 | 1.32 | 1.04 |
| 11 | 13-Nov 2015 | 14.27 | 2.99 | 0.13 | 0.02 | 1.3 | 1.03 |
| 12 | 14-Nov 2015 | 13.3 | 4.06 | 0.11 | 0.02 | 1.26 | 1.04 |
| 13 | 3-Jan 2016 | 7.31 | 4.86 | 0.09 | 0.03 | 1.2 | 1.06 |
| 14 | 7-Jan 2016 | 16.64 | 6.24 | 0.11 | 0.03 | 1.24 | 1.07 |
| 15 | 14-Jan 2016 | 12.77 | 2.15 | 0.14 | 0.03 | 1.33 | 1.06 |
According to Table 1 and Figure 4, it is clear that the TPW, MPDI, and TBv∕TBh in the 6 GHz channel are significantly higher at the selected saline points than those in the non-saline points in all the four seasons of 2015–2016 (other selected points also had similar results). These investigations confirmed the sensitivity of the TPW parameter and the brightness temperature difference between the vertical and horizontal polarization in the 6 GHz band to the salinity of the soils.
Therefore, in order to detect the saline pixels from the non-saline ones, in procedure 1, the TPW and MPDI and in procedure 2, the TPW and the ratio TBv∕TBh at 6 GHz band, were calculated. Using the extracted training data from Figure 1, in procedure 1, the threshold values of the TPW and MPDI and in procedure 2, the threshold values of TPW and the ratio TBv∕TBh at 6 GHz channel were calculated. The results of the calculations showed that in procedure 1, the threshold values of the TPW and MPDI at 6 GHz were 11.7 mm and 0.08, respectively. For the procedure 2, threshold values of the TPW and the ratio TBv∕TBh at 6 GHz were acquired to be 11.7 mm and 1.17, respectively.
In order to evaluate the results of the soil salinity detection using the optimal thresholds, pixels were classified into the saline and non-saline soil and the results were evaluated with the extracted test data from Figure 1. The overall accuracy and kappa coefficient in the classification of the saline and non-saline soil in procedure 1 were calculated to be 0.865 and 0.715, respectively which are acceptable values (Table 2). The overall accuracy and Kappa coefficient in procedure 2 were calculated to be 0.809 and 0.607, respectively (Table 3).
Error matrix results in procedure 1
| Classes | Saline | Non-saline | Total | User’s accuracy | |
|---|---|---|---|---|---|
| Saline | 40 | 9 | 49 | 0.816 | |
| Non-Saline | 8 | 69 | 77 | 0.896 | |
| Total | 48 | 78 | 126 | Overall accuracy | Total |
| 0.865 | 0.715 | ||||
Error matrix results in procedure 2
| Classes | Saline | Non-saline | Total | User’s accuracy | |
|---|---|---|---|---|---|
| Saline | 40 | 9 | 49 | 0.816 | |
| Non-Saline | 15 | 62 | 77 | 0.805 | |
| Total | 55 | 71 | 126 | Overall Accuracy | Total |
| 0.809 | 0.607 | ||||
According to the results of Tables 2 and 3, it was concluded that the calculated overall accuracy and Kappa coefficient in procedure 1 were higher than those in procedure 2. The results of both procedures were used to provide a map of the saline soils areas in the study area. Figures 5 and 6 show the saline points detected in the study area, using the thresholds of the procedures 1 and 2, respectively.
Detected points as saline soil in the study area based on procedure 1.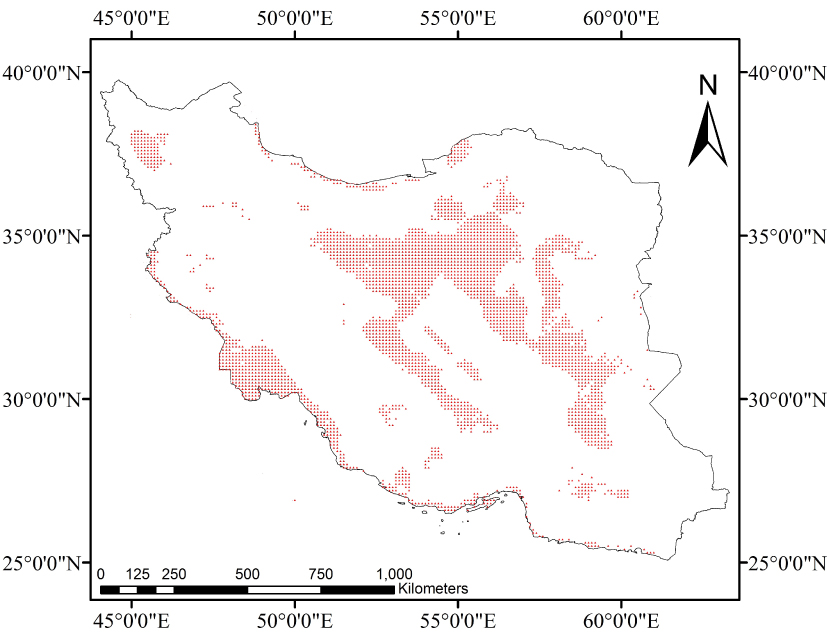
Detected points as saline soil in the study area based on procedure 2.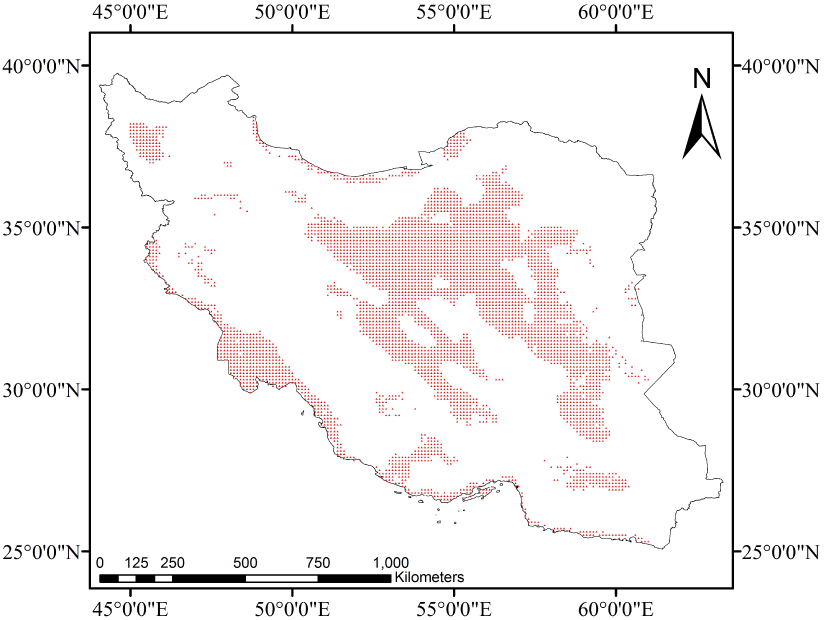
According to Figures 5 and 6, and comparing them with Figure 1 (as the evaluation map), it is proved that the pattern of identified points with the saline soil, especially in areas with severe salinity, is approximately the same in both procedures. However, in Figure 6 more points with the saline soil were detected compared with those in Figure 5. Most of the areas containing the saline soils in Iran were detected in the center of Iran (central desert), the southwest, and the southern coastline.
The uncertainty in Figures 5 and 6 corresponds to the detection of the northern coastline of Iran as well as Lake Urmia as the saline areas. The first uncertainty can be due to the presence of the coast and the presence of the saline water in the coastal areas. The second uncertainty is due to the abundant salt in the semi-dry Lake of Urmia, which in some areas contains the pure salt and in some areas the mixture of water and salt.
4. Conclusion
The soil salinity is one of the important issues in the water resources management and agriculture, especially in the arid and semi-arid countries. Hence, it is very important to use different data sources to identify this phenomenon on a large spatial scale such as a remote sensing tool. Then, the purpose of this study was to detect and prepare the saline soil map in Iran with the synergistic use of the optical and microwave remote sensing data. To identify this phenomenon, the TPW parameter obtained from the AMSR2 and MODIS images, the MPDI at the frequency of the 6 GHz, and the ratio of brightness temperatures in the vertical to horizontal polarization at 6 GHz frequency of AMSR2 were used. Implementations were carried out in two procedures for 80 days from four seasons 2015–2016. Using training data, in procedure 1, the optimal threshold for the TPW parameter and the MPDI in the 6 GHz channel was calculated. In procedure 2, the optimal threshold for TPW parameter and the ratio (TBv∕TBh) in the 6 GHz band were calculated. Then, the proposed indices of the both procedures were calculated. Afterwards, pixels which exceeding the calculated thresholds were considered to be points with the saline soil.
To evaluate the accuracy of the results, by using test data, the overall accuracy and kappa coefficient were extracted from the error matrix. The overall accuracy and Kappa coefficient in procedure 1 were 0.865 and 0.715, respectively, and in procedure 2 were 0.809 and 0.607, respectively. At the end, the points which were assigned as saline soil in the whole of the selected 80 days in the study area by implementing the calculated threshold values in the both procedures were considered as the drawing a final saline map.
Most saline areas identified in Iran were located in the central (central desert), the southwestern (Khuzestan province), and the southern coast of Iran. One of the advantages of this study is utilizing the brightness temperatures of the AMSR2 in 5 channels (6, 18, 23, 36 and 89 GHz) in the horizontal and vertical polarization in the saline soil detection along with MODIS bands. Using this innovative method and importing a limited number of training data from saline and non-saline soil points in different regions, we find it possible to present a soil salinity zonation map using satellite data, which has not been done in previous studies. Since Iran is a country with different climates and the intensity of soil salinity varies in different regions, the purpose of this study was to classify saline and non-saline soils. In future studies, it is recommended that, on a small spatial scale, by using the indices introduced in this study and soil salinity ground data such as EC and Sodium Absorption Ratio, a relationship is proposed to predict soil salinity parameters.
1Normalized Difference Vegetation Index.
2Soil-adjusted Vegetation Index.
3Ratio Vegetation Index.
4Soil Brightness Index.
5Green Vegetation Index.
6Wetness Index.
7Combined Spectral Response Index.
8Electrical Conductivity.
9Moderate Resolution Imaging Spectroradiometer.
10Root Mean Square Errror.
11Enhanced Vegetation Index.
12Digital Elevation Model.
13Particle Swarm Optimization.
14Advanced Microwave Scanning Radiometer 2.
15Advanced Microwave Scanning Radiometer for EOS.
16National Aeronautics and Space Administration.
17Global Change Observation Mission-Water 1.
18Earth Observing System.
19Microwave Polarization Difference Index.