


 CC-BY 4.0
1. Introduction and rationale
Magma is the most important transport agent throughout our planet. It is in fact the main carrier of oxygen through Earth’s interiors up to the surface, and its liquid portion, the silicate melt, operates as a very efficient high-temperature chemical solvent for metal oxides as well as volatile components [e.g., Trémillon 1974, Allanore 2013, 2015, Cicconi et al. 2020a, Moretti and Neuville 2021, Moretti and Ottonello 2022, Papale et al. 2022]. The redox state of magmas then refers to the ensemble of conditions and variables governing the oxidation state of metals, volatiles and the species they form, either dissolved in the melt or exsolved in a coexisting fluid. Therefore, parameterization of the redox state is fundamental to assess mass and energy transfer in magmas and particularly its phase equilibria and the P–T conditions at which these take place. Although this is well known in petrology, because phase equilibria are deeply impacted by the relative proportions of FeO and Fe2O3, knowledge of redox states during magma differentiation and particularly during magma ascent is highly important to help reconstruct the architecture of volcanic plumbing systems and the dynamics of rising natural magmas and associated fluids. Both of these aspects require the evaluation of the speciation of volcanic fluids and their state of saturation with the melt, making the redox state of the magma a main parameter of this evaluation, even if not explicitly treated [e.g., Spilliaert et al. 2006, Aiuppa et al. 2007, 2009, 2010, 2016, 2017, 2018, 2022, Mangiacapra et al. 2008, Barsanti et al. 2009, Allard 2010, Arienzo et al. 2010, 2016, Blundy et al. 2010, Allard et al. 2016, Edmonds et al. 2010, Edmonds and Wallace 2017, Esposito et al. 2011, Oppenheimer et al. 2011, Mormone et al. 2011, Pino et al. 2011, Moretti et al. 2013a, b, 2018, 2019, Moussallam et al. 2014, 2016, 2019, Hartley et al. 2014, 2017, Le Losq et al. 2015, Wallace et al. 2015a, Brounce et al. 2017, Allison et al. 2021, Gennaro et al. 2020, Paonita et al. 2021]. In particular, tracking the evolution in time and depth of the volcanic fluid phase has become central for the geochemical monitoring of volcanic activity and for eruption forecasting. This demands the adoption of models for melt–fluid saturation accounting for the redox state, which is made by profiling the evolution of the amount of oxygen available to react with elements in the system, that is, the fugacity of molecular oxygen, fO2 [Moretti and Papale 2004, Burgisser and Scaillet 2007].
Nevertheless, matters are complicated by the fact that volcanic systems show extreme thermal and physiochemical variations from deep regions of magma storage to surface, which are related to polybaric magma crystallization and mixing, as well as to processes of fluid loss/gain, or again rock assimilation [Moretti and Stefansson 2020, and references therein]. Over the range of temperatures of geological interest for volcanic systems, oxygen fugacity embraces several orders of magnitude (Figure 1). If we embody temperature changes by referring to the same equilibrium mineral assemblage [e.g. Fayalite-Magnetite-Quartz, FMQ; Frost 1991 and references therein], the ensemble of magmatic redox states encompasses about six orders of magnitudes on the present Earth [Behrens and Gaillard 2006].
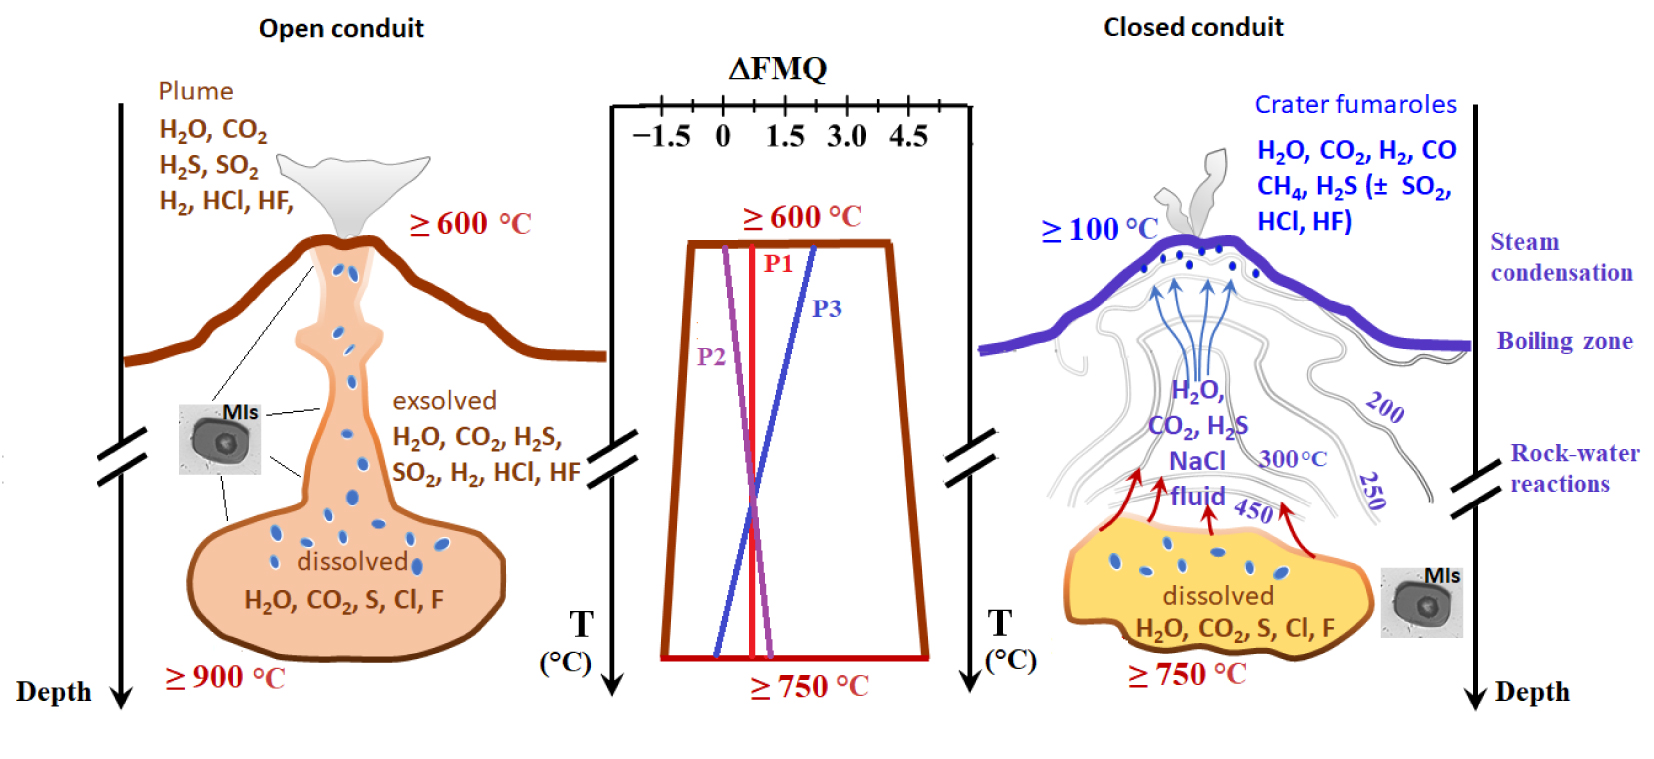
Sketches of open-conduit (left-panel), closed-conduit volcanoes (right-panel), and the range of fO2 (as ΔQFM) variations of present-Earth magmas (middle panel). Relative fO2 excursions are from Behrens and Gaillard [2006] for bottom magma ( − 1.5⩽QFM⩽5) and from the volcanic gas compilation of Moussallam et al. [2019] for the magmatic top (ideally vent conditions for open-conduit volcanoes or shallow magma chamber roofs for closed-conduit volcanoes). P1–P3 are qualitative trends for fO2 variations throughout volcano plumbing systems. Redrawn and modified from Moretti and Stefansson [2020]. Masquer
Sketches of open-conduit (left-panel), closed-conduit volcanoes (right-panel), and the range of fO2 (as ΔQFM) variations of present-Earth magmas (middle panel). Relative fO2 excursions are from Behrens and Gaillard [2006] for bottom magma ( − 1.5⩽QFM⩽5) and ... Lire la suite
In open-conduit volcanic settings characteristic for “basaltic” (sensu lato) magmatism, the main carrier of reactive oxygen up to the surface is hot iron- and sulphur-rich silicate melt, which is possibly a continuum phase from the depth to the surface. However, compositional changes due to magma differentiation, including degassing, can modify significantly the redox state, hence fO2, en route to the surface (Figure 1), given the fundamental role played by composition on iron and sulfur redox couples [Moretti 2021, Moretti and Ottonello 2003a, 2022, Moretti and Stefansson 2020, Cicconi et al. 2020a]. The physiochemical investigation of melt droplets quenched in growing crystals (glass or melt inclusions, henceforth MIs; Figures 1 and 2) during the polybaric evolution of ascending, emplacing and erupting magmas is the basic and most reliable tool to reconstruct the evolution of the fluid phase interacting with the magma from depth up to the crater vents. A large part of the current physiochemical knowledge of volcanic systems, including the main depths of magma storage, comes from magma thermo-oxy-barometry based on the chemical analysis of MIs.
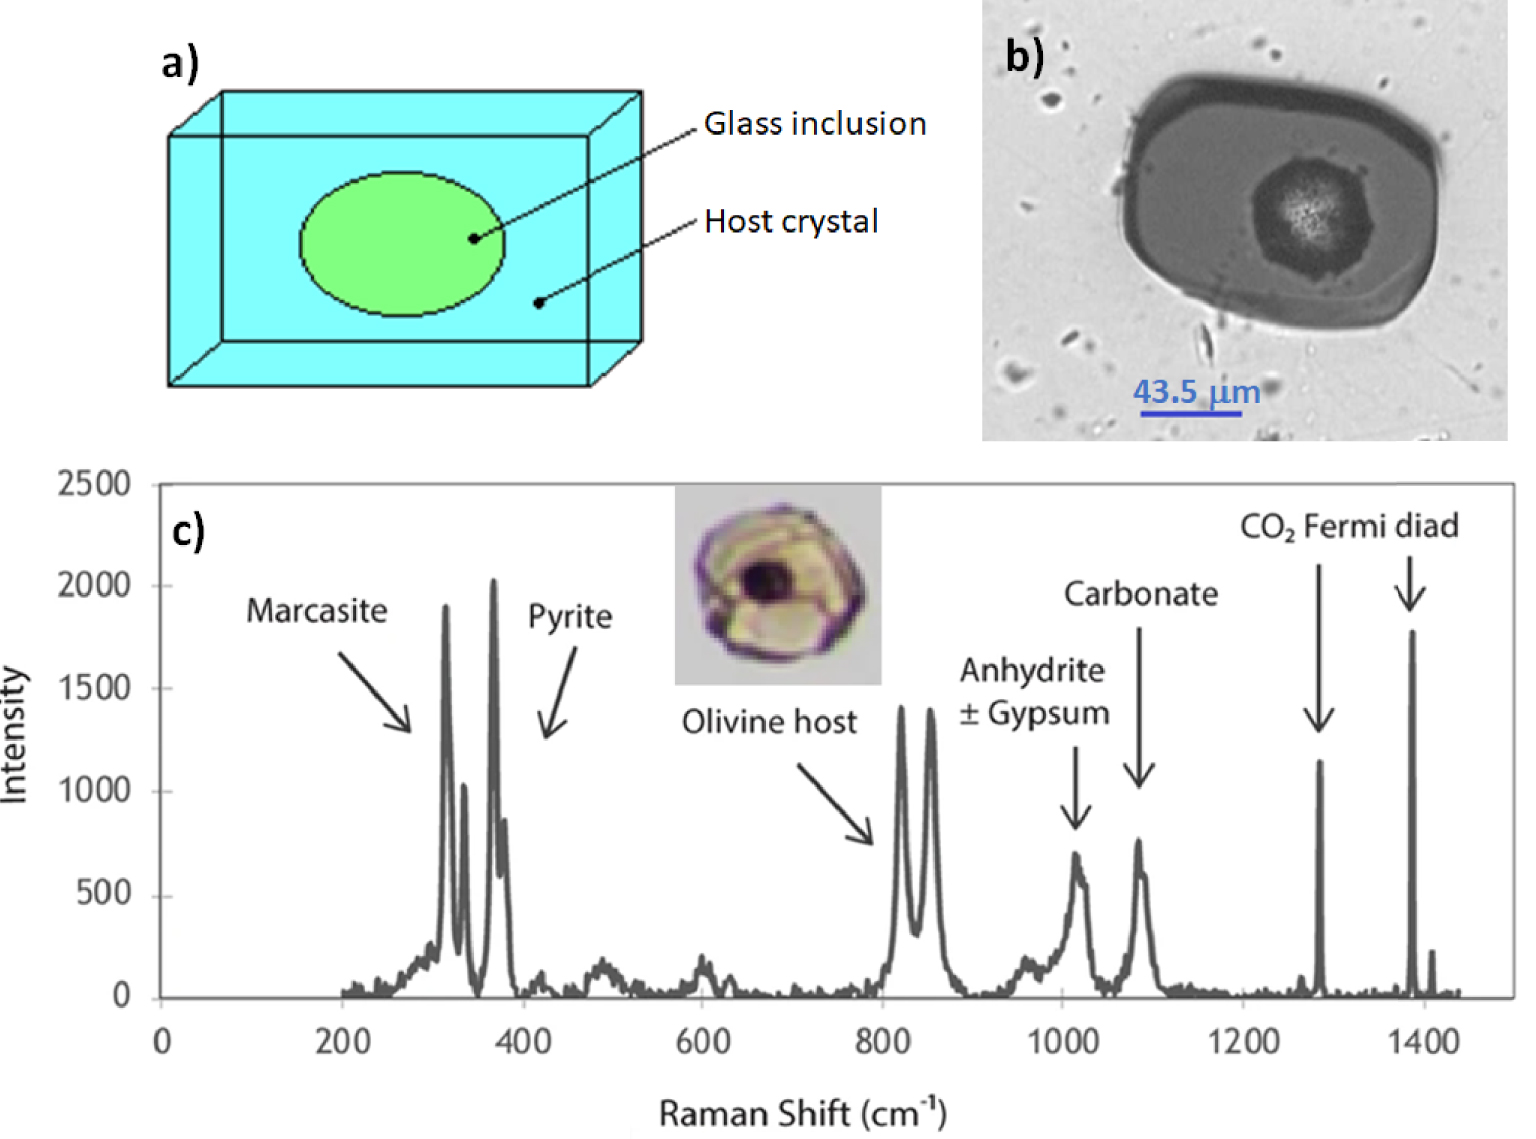
Sketch of a melt inclusion (MI) hosted in a crystal (panel a) and transmission light photograph of an Etna MI carrying a shrinkage bubble (panel b). Raman spectrum (panel c) of the bubble inside a Mt. Meager MI (see insert) carrying a shrinkage bubble and evidences of post-entrapment crystallization. The bubble contains gaseous CO2, pyrrhotite or pyrite (with polymorphs of marcasite), anhydrite, gypsum, and carbonate (modified from Figure 4 in [Venugopal et al. 2020], under a Creative Commons Attribution 4.0 International license, http://creativecommons.org/licenses/by/4.0/). Masquer
Sketch of a melt inclusion (MI) hosted in a crystal (panel a) and transmission light photograph of an Etna MI carrying a shrinkage bubble (panel b). Raman spectrum (panel c) of the bubble inside a Mt. Meager MI (see insert) carrying a shrinkage ... Lire la suite
Besides, hydrothermal systems can develop in case of closed-conduit volcanic systems (Figure 1), andesitic sensu lato, which are those most prone to violent explosive eruptions. At these volcanoes during periods of quiescence or of pre-eruptive unrest, closed conduit conditions help to accommodate and stabilize magma-induced thermal, baric and chemical anomalies in the form of convective geothermal systems. However, these are also a screen to the deeper magmatic system and its redox signature, deeply modified by the scrubbing of volcanic gases interacting with the aqueous fluids and by the subsequent rock–water interaction, and steam separation/condensation processes that are a prelude to fumarolic emissions [Giggenbach 1987, Hedenquist and Lowenstern 1994, Moretti and Stefansson 2020 and Figure 1]. The main geochemical objectives for tracking magma evolution and dynamics in geothermal settings then become the filtering out all these post-magmatic effects from measured fumarolic gases, in order to obtain the pristine magmatic gas getting injected at shallow depths into hydrothermal systems [Caliro et al. 2007, Moretti et al. 2013b]. Again, the analysis of MIs from minerals in magmatic rocks from past eruptions at such settings are fundamental to estimate the compositional variations of the magmatic fluid phase that feeds hydrothermal systems and, thus, to appreciate the current state of many subterranean magma chambers [Arienzo et al. 2010, Moretti et al. 2013b]. More importantly, thermo-oxy-barometric studies of MIs may help in putting constraints about fluid-magma thresholds for reactivation, migration and destabilization of the magmatic chamber(s) below the hydrothermal body, with obvious implications for the assessment of the hazard related to explosive volcanic activity [e.g., Boichu et al. 2008, 2011, Tramontano et al. 2017, Moretti et al. 2019].
The access to a correct thermo-oxy-barometric information on a volcanic system then depends largely on (1) the availability and conditions of occurrence of MIs, (2) their successful analysis and (3) the used equations, which in turn result from calibrations on experimental data and their quality.
In this contribution, after a description of the state of the art about MIs and of main modelling issues of their volatile contents, we will set a parametric comparison of main oxybarometers available in the literature. We will also provide a brief overview of the interplay between magma redox and major element chemistry, in order to show the role of composition on redox variations observed in nature. The performances and implications of different models on andesitic and basaltic melts of volcanological interest will be then presented. Finally, an application to volcano Etna will illustrate the role that the highly soluble water component plays by shifting redox equilibria at different moments of magma evolution.
2. Melt inclusions and models of fluid saturation and redox state: a brief summary of the state of the art
2.1. Generalities
In igneous rocks, glass or melt inclusions (MIs) are micrometric droplets of quenched melts hosted in crystals such as olivine, clinopyroxene or plagioclase (Figure 2). They provide unique insights into the nature of the magma, such as deep source (e.g., mantle), polybaric storage conditions, magma differentiation driven by magma mixing and/or fractional crystallization, pre-eruptive volatile contents and redox state [e.g., Schiano 2003, Moretti et al. 2013a, Arienzo et al. 2016]. The measurement of their volatile content has boosted the assessment of volatile budgets of endogenous origin, particularly CO2, S and halogens [e.g., Metrich and Wallace 2008, Wallace and Edmonds 2011]. Pre-existing bubbles already exsolved from a fluid-saturated melt may be trapped inside MIs, but in most cases trapped MIs are saturated monophase melt droplets, decoupled from their vapour phase.
After melt entrapment, MIs may undergo further compositional change due to growth of the host crystal at the expense of the MI rims or crystallization of daughter minerals from the melt/glass in response to slow ascent rates and system cooling [e.g. Venugopal et al. 2020; Figure 2]. Besides, during magma rise and consequent decompression, cooling or post-entrapment crystallisation, dissolved volatiles may diffuse and exsolve, nurturing trapped bubbles (if any) or nucleating into a new one (so called vapour or shrinkage bubble). This results from differential thermal contraction of host crystal and melt, which lowers pressure in the inclusion and generates CO2 saturation [e.g., Wallace et al. 2015b]. Therefore, an initially undersaturated MI can become saturated. Besides, MI vapour bubbles are reservoirs of major and volatile elements (such as S, H2O, CO2, Fe, Ca and Mg) that diffuse from the melt/glass phase to form new phases within the bubble. This diffusion is a source of systematic errors that affect the data obtained from analysis of the sole glassy portions of MIs and thus in turn the estimates of storage parameters (T, P, fO2) [Venugopal et al. 2020, and references therein].
Major elements plus Cl, F and S can be measured by electron microprobe (EMP). Some other light elements (Li, B, Be) are suitably detected by Secondary Ion Mass Spectrometry (SIMS). SIMS also provides trace element and volatile (e.g., H2O, S, Cl, F, CO2) analysis, and sub-per mil precision for a wide variety of light stable isotope ratios, including those of trace-level elements (δD, δ13C, δ18O, δ34S, δ7Li, δ11B, δ37Cl) [e.g., Hauri 2002, Hauri et al. 2002, Gurenko et al. 2005, Manzini et al. 2017]. Laser ablation inductively coupled plasma mass spectrometry (LA-ICP-MS) is the most well-established method for the determination of trace element abundances in MIs and their host minerals [e.g., Pettke et al. 2004]. Abundance and speciation of dissolved H2O and CO2 can be quantified via (transmitted light) micro-Fourier-transform infrared spectroscopy (FTIR) [e.g., Ihinger et al. 1994]. Iron and sulfur oxidation state and speciation can be determined via (synchrotron assisted) X-ray absorption near-edge structure (XANES) spectroscopy at the iron and sulfur K-edges [e.g., Lerner et al. 2021]. Iron oxidation state can also be evaluated via synchrotron assisted-Mossbauer spectroscopy [Gaborieau et al. 2020], as well as via Raman spectroscopy [Le Losq et al. 2019], whereas sulfur oxidation state can be assessed using EMP but at lower levels of precision than S-XANES [Carroll and Rutherford 1988]. Finally, Raman spectroscopy is routinely used to not only determine water content and speciation [Le Losq et al. 2012, 2013], but also to identify and estimate the CO2 present in the bubble and reveal the presence of mineral precipitates in the bubble, such as carbonates, other solid phases sequestering sulfur and also H2O in liquid form or structurally bound to hydrous minerals [Venugopal et al. 2020; Figure 2b].
We refer to the literature for a discussion of challenges, pros and cons of each method (calibration techniques, resolution of matrix effects, sample preparation, destructive versus non-destructive analyses, photo-oxidation/reduction), which should be carefully addressed for planning melt inclusion studies.
The continuous development of microanalytical techniques suitable for MIs’ characterization has boosted a fruitful and virtuous three-way link involving (1) experimental petrology to synthesize volatile-saturated glasses from melts of different compositions quenched at different P–T–fO2 conditions; (2) thermodynamic modelling of volatile saturation (or mixed solubility) and redox properties of melt–fluid systems, and (3) observational volcanology and analytical geochemistry to provide input data from MIs and gas emissions. Saturation/redox models can then be used as thermo-oxy-barometer to reconstruct magma polybaric evolutions and degassing patterns, including fO2 evolution from depth to surface (see Figure 1).
2.2. H2O–CO2-melt thermobarometry, degassing style and fluid–melt budgets
The quest for magmatic H2O and CO2 abundances has fostered an impressively vast amount of studies about magma degassing and the identification of depths of reservoir in which magmas pond by using several thermobarometic functions describing volatile solubility [see Papale et al. 2022, for a review]. These functions all have a thermodynamic background and have been used to implement models of gas–melt equilibrium in conjunction with an equation of state for H2O–CO2 in the gas phase. The most complete approaches include the full assessment of interaction parameters between oxide components (including H2O and CO2) in the melt phase, calibrated on the basis of experimental data about volatile solubility in melt at different pressures, temperatures and compositions relevant to magmas [see Papale et al. 2022, and references therein]. These models are also redox dependent, as the relative proportion of FeO and Fe2O3, particularly in iron-rich magmas, can shift significantly the H2O–CO2-melt saturation surface [Papale et al. 2006].
Because at depth the magmatic gas phase is essentially made of water and carbon dioxide, the (total) pressure of natural volcanic systems is approximated by the sum of H2O and CO2 partial pressures. These models have then done a great job in conceptualizing volcanic plumbing systems by giving a depth to main magma reservoirs, where most host crystals develop and trap MIs. This important information can then be confronted to assessments of geophysical nature from seismic and geodetic investigations [e.g., Mangiacapra et al. 2008, Arienzo et al. 2010]. Additionally, adoption of these models on MI-dissolved volatile contents have allowed to reproduce the polybaric degassing paths within the volcanic plumbing system. These paths are, among others, a function of the total (exsolved plus dissolved, or initial) volatile content: upon degassing, the total content of volatile components is constant in closed systems whereas its decreases in open systems; in both scenarios, H2O and CO2 partition differently between the melt and gas phases at any pressure step [Papale et al. 2006]. The distributions of MIs’ dissolved volatile contents from many volcanic sites show in particular that maximum dissolved CO2 contents measured in MIs cannot be reconciled with degassing patterns, demonstrating that a significant CO2-rich exsolved fluid phase exists at depth [e.g., Spilliaert et al. 2006, Aiuppa et al. 2007, 2010, Vigouroux et al. 2008, Allard 2010, Blundy et al. 2010, Mormone et al. 2011, Oppenheimer et al. 2011, Pino et al. 2011, Moretti et al. 2013a, b, 2018, 2019, Hartley et al. 2014, Caricchi et al. 2018, Paonita et al. 2021]. This evidences that CO2 dissolved in deep melts significantly underestimates the total CO2 content, which is in line with the clear imbalance between magma production (magma emitted at the surface and piled up in volcanic edifices) and degassing rates at many volcanic sites, which in turn implies deep degassing sources [e.g., Aiuppa et al. 2007, 2011, 2013, Shinohara 2008, Moretti et al. 2013a, b, Paonita et al. 2021, Pistone et al. 2021, Utami et al. 2021].
2.3. Redox-oxygen fugacity models for melts/ glasses
Carmichael [1966] and Carmichael and Nicholls [1967] used the oxy-thermometer of Buddington and Lindsley [1964] based on the two iron-titanium oxide solid solutions titanomagnetite (Fe3O4–Fe2TiO4) and hemoilmenite (Fe2O3–FeTiO3) to bracket fO2–T ranges of basaltic and acidic volcanic rocks. They showed that the fO2 of most of the glassy rocks, rapidly quenched and not affected by subsequent cooling, were quite close to the FMQ buffer. Since then, a scientific debate was initiated on the preservation (and the role) of the deep fO2 source signature in shallow magma, erupted products and discharged plume gases: was the fO2 of the rising magma maintained constant, or undergoing either reduction or oxidation (P1, P2 and P3, respectively, in Figure 1).
Besides, interest grew around general formulations relating fO2 and melt oxidation state, which started to be widely investigated by experimental petrology. In a suite of papers in the 1980s and early 1990s Carmichael and coworkers expounded their well-known composition-dependent equation relating iron oxidation state and fO2 in melts/glasses, calibrated on a large amount of experimental data [Kress and Carmichael 1991, and references therein]. This equation became the reference to calculate the fO2 of magmas, provided an estimate of FeIII∕FeII was available. Reference iron oxidation values were taken from whole rock analyses or alternatively were calculated by the olivine–melt [Roeder and Emslie 1970] or Cr-spinel–olivine [Maurel and Maurel 1982] exchange coefficients of Fe and Mg, provided the total iron content from EMP analyses of glass (matrix or inclusions) in contact with these minerals was available. The latter two are reliable techniques as long as melt–mineral equilibrium can be assumed, a condition which in polybaric volcanic rocks is most often satisfied for more primitive specimens slowly equilibrated in deep reservoirs. For example, by using the Roeder and Emslie [1970] and Maurel and Maurel [1982] functions on analyses of deep samples from Ischia and Aeolian island, D’Antonio et al. [2013] could show two trends for Italian volcanic rocks: (1) recent southern Italy volcanics show net increasing oxidation with increasing K-content, associated with the abundance of subduction-derived hydrous fluids, whereas (2) older potassic to ultrapotassic magmas of central Italy display a gentle reduction with increasing K-content, associated with CO2-dominated conditions likely due to carbonate assimilation.
The possibility offered by modern probes and spectroscopic tools to measure directly the oxidation state of redox sensitive elements (mainly iron and sulfur) in glasses has triggered the interest for formulation of new oxybarometers based on Fe- and S-oxidation states and which were used to show that oxygen fugacity of deep-seated, mantle-derived, melts can be strongly affected by the degassing of volatiles during magma ascent to the surface (qualitative paths P2 and P3 in Figure 1). By adopting modern probes on a set of melt inclusions, in conjunction with the measurement of the composition of volcanic plume gases, it is now possible to model volcanic fluid speciation from depth to surface. This is achieved by separating the contribution of fO2 due to the deep source’s compositional features, from those of the subsequent magma differentiation, the degassing style and also the cooling. Nevertheless, the results will depend on the functional forms adopted for both fluid–melt saturation and oxygen fugacity.
2.3.1. Iron oxybarometers
The starting point is the melt oxide component reaction:
| (1) |
| (2) |
From (2) we immediately deduce that the parameterization of 𝛾FeO melt∕𝛾FeO 1.5,melt is the key to obtain successful formulation to relate iron oxidation state to oxygen fugacity.
Jayasuriya et al. [2004] based their formulation starting from the adoption of a symmetric regular solution mixing model [see also Moretti and Ottonello 2022] to solve equation:
| (3) |
| (4) |
The search for one general formulation for all melt compositions of geological interest led the authors to formulate empirical expressions based on adjustable parameters, with even less formal rigor than (4). Among these we can recall the expressions from Carmichael and coworkers [Kress and Carmichael 1991, and references therein] and the Borisov et al. [2018] one (henceforth Bo), which use expressions of the type:
| (5) |
| (6) |
Equation such as (5) and (6) violate reaction (1) stoichiometry (i.e., d≠1∕4 in (5) and the same for a in (6)), which implies the loss of internal consistency and the failure of the Gibbs–Duhem relation for all component activities within the same phase [e.g., Lewis and Randall 1961]. Besides, this alteration of the O2 stoichiometric coefficient disagrees with mass conservation requirements of reaction (1). Equations of the type (6) do the job of fitting the iron oxidation state in multicomponent systems, only within the compositional domain in which they have been calibrated but they cannot be used to model the iron oxidation state in alkali-rich melts, particularly silica–alkali oxide binaries. However, multicomponent melts of geological interest tend to average the distribution of the effective charge of the oxygen ligand and surrounding metals [see Ottonello et al. 2001, Moretti 2005, 2021, Moretti and Ottonello 2022, for extensive discussion].
To put it in ionic form, by introducing the oxide ion, O2−, we may intuitively rewrite (1) as:
| (7) |
However, if we compare the equilibrium constants of reactions (1) and (7) we obtain:
| (8) |
This behavior, which implies maxima and minima in the activity ratio variation with composition even on a simple binary, cannot be formalized by means of regular or sub-regular mixing models of melt oxide components and their expansion in several terms. Rather, this behavior implies a change of trivalent iron speciation:
| (9) |
By comparing K1, Equation (2) and K9 we then obtain:
| (10) |
Trivalent iron has then a dual (or amphoteric) behavior (either network modifier, as Fe3+, or former, as
| (11) |
| (12) |
| (13) |
| (14) |
Structons are the polymeric entities making up the network and thus expressing the reactivity of the oxygen ligand. They are computed [see Moretti 2005, for details] by accounting for melt polymerization, which is the partitioning of melt–oxygen in three forms [Toop and Samis 1962a, b]
| (15) |
Because of their large thermal stability and their nature of continuous oxygen network, silicate melts are solutions that change their polymerization properties, and hence the network topology, while dissolving important amounts of other metals. Basically this means that, contrary to aqueous solutions, the distinction between solvent (the oxygen ligand structured in the melt network) and solute becomes blurred, without the possibility of defining and distinguishing solvation shells within which covalent bonding forces are exhausted [Moretti and Neuville 2021, Moretti and Ottonello 2022]. So, every added component impacts on the structure via polymerization, affecting the (undistinguished) solvent and solute. For example, water has a well-known large P-dependent solubility which results from breaking the biggest network units and melt depolymerization [see Papale et al. 2022, for a review].
Polymerization equilibrium K15 then shifts with composition because any silicate network is a solvent per se with peculiar dielectric and electrostriction properties, hence with a specific structural framework whose polymerization is the main chemical descriptor. Because of this, the continuous shift of polymerization with composition impacts the redox equilibrium in a non-linear way via its effect on [O2−] and also terms that are mainly entropic about component relaxation in melts [Ottonello 2021, Moretti and Ottonello 2003b, Ottonello 2005, Moretti 2021]. In fact, depending on bulk composition, K15 involves a change in the oxidation state of oxygen and hence in the polarization state of the ligand and in network relaxation [Ottonello et al. 2001, Moretti 2005]. Because the shift in the ligand polarization state affecting the network reactivity is related to the ionic (or covalent) bond fraction, and thus to atomistic properties, such as electronegativity or optical basicity [Duffy 1993, Moretti and Ottonello 2022, and references therein], Ottonello et al. [2001] proposed a composition-dependent polymerization constant based on the contrast in atomistic properties (optical basicity) between the anionic and the cationic matrix.
The IPA considers then dissociations of iron oxides into their ionic products:
| (16) |
| (17) |
| (18) |
| (19) |
Based on literature data on iron oxidation state, the IPA parameterizes K1, K16, K17 and K18 [Ottonello et al. 2001] and it was further expanded at pressure including volume terms for ionic species and oxide components by evaluating ∫ΔVreaction dP terms for each reaction, as well as water speciation [Moretti 2005, Moretti et al. 2014].
Moretti and Ottonello [2022] presented ab-initio implicit calculation of iron redox in melts. In their approach, based on Tomasi’s Polarized Continuum Model [PCM; Floris and Tomasi 1989, Floris et al. 1991, Tomasi and Persico 1994, Tomasi et al. 1999], there is no need to consider the structure of the silicate framework, because medium properties are summarized in its dielectric properties. Results (for the moment at 1 bar and 25 °C) confirm the role of the two redox reactions (7) and (9), as well as of the oxygen electrode reaction (13).
2.3.2. Sulfur oxybarometers
In a silicate melt, it is generally assumed that the most abundant S-species are sulfide and sulfate ions and sulfur dissolution in melt is expressed as [Fincham and Richardson 1954, Sakai et al. 1982, Wallace and Carmichael 1992, 1994, Carroll and Webster 1994, Moretti et al. 2003, Moretti and Ottonello 2003b, 2005, Baker and Moretti 2011, Nash et al. 2019]:
| (20) |
| (21) |
| (22) |
| (23) |
By subtracting reaction (21) from reaction (20), the typical redox mechanism for sulfur dissolved in melts (also undersaturated ones) can be obtained:
| (24) |
The redox numerical model, Conjugated Toop-Samis-Flood-Grjotheim (CTSFG) model, solves for the sulfide and sulfate capacities of any melt composition based on a linear combination of the equilibrium constants of the type of (20) and (21) for single oxide–sulfide and oxide–sulfate pairs and considering that:
| (25) |
The Moretti and Ottonello [2005] CTSFG model (see Code Availability section) is calibrated on >1000 experimental data on sulfide and sulfate solubility and allows estimating the amount of sulfur dissolved in melts as:
| (26) |
| (27) |
Via the CTSFG model, the IPA solves internally the mutual interactions of iron and sulfur species, represented by the equilibria:
| (28) |
| (29) |
On more empirical grounds, Wallace and Carmichael [1994] proposed the following equation (henceforth W&C) linking the mole fractions of SO
| (30) |
Other simple equations relating the redox state of silicate melts to XSO
| (31) |
More recently, Nash et al. [2019] proposed an assessment of melt reaction:
| (32) |
| (33) |
3. Comparison of redox models
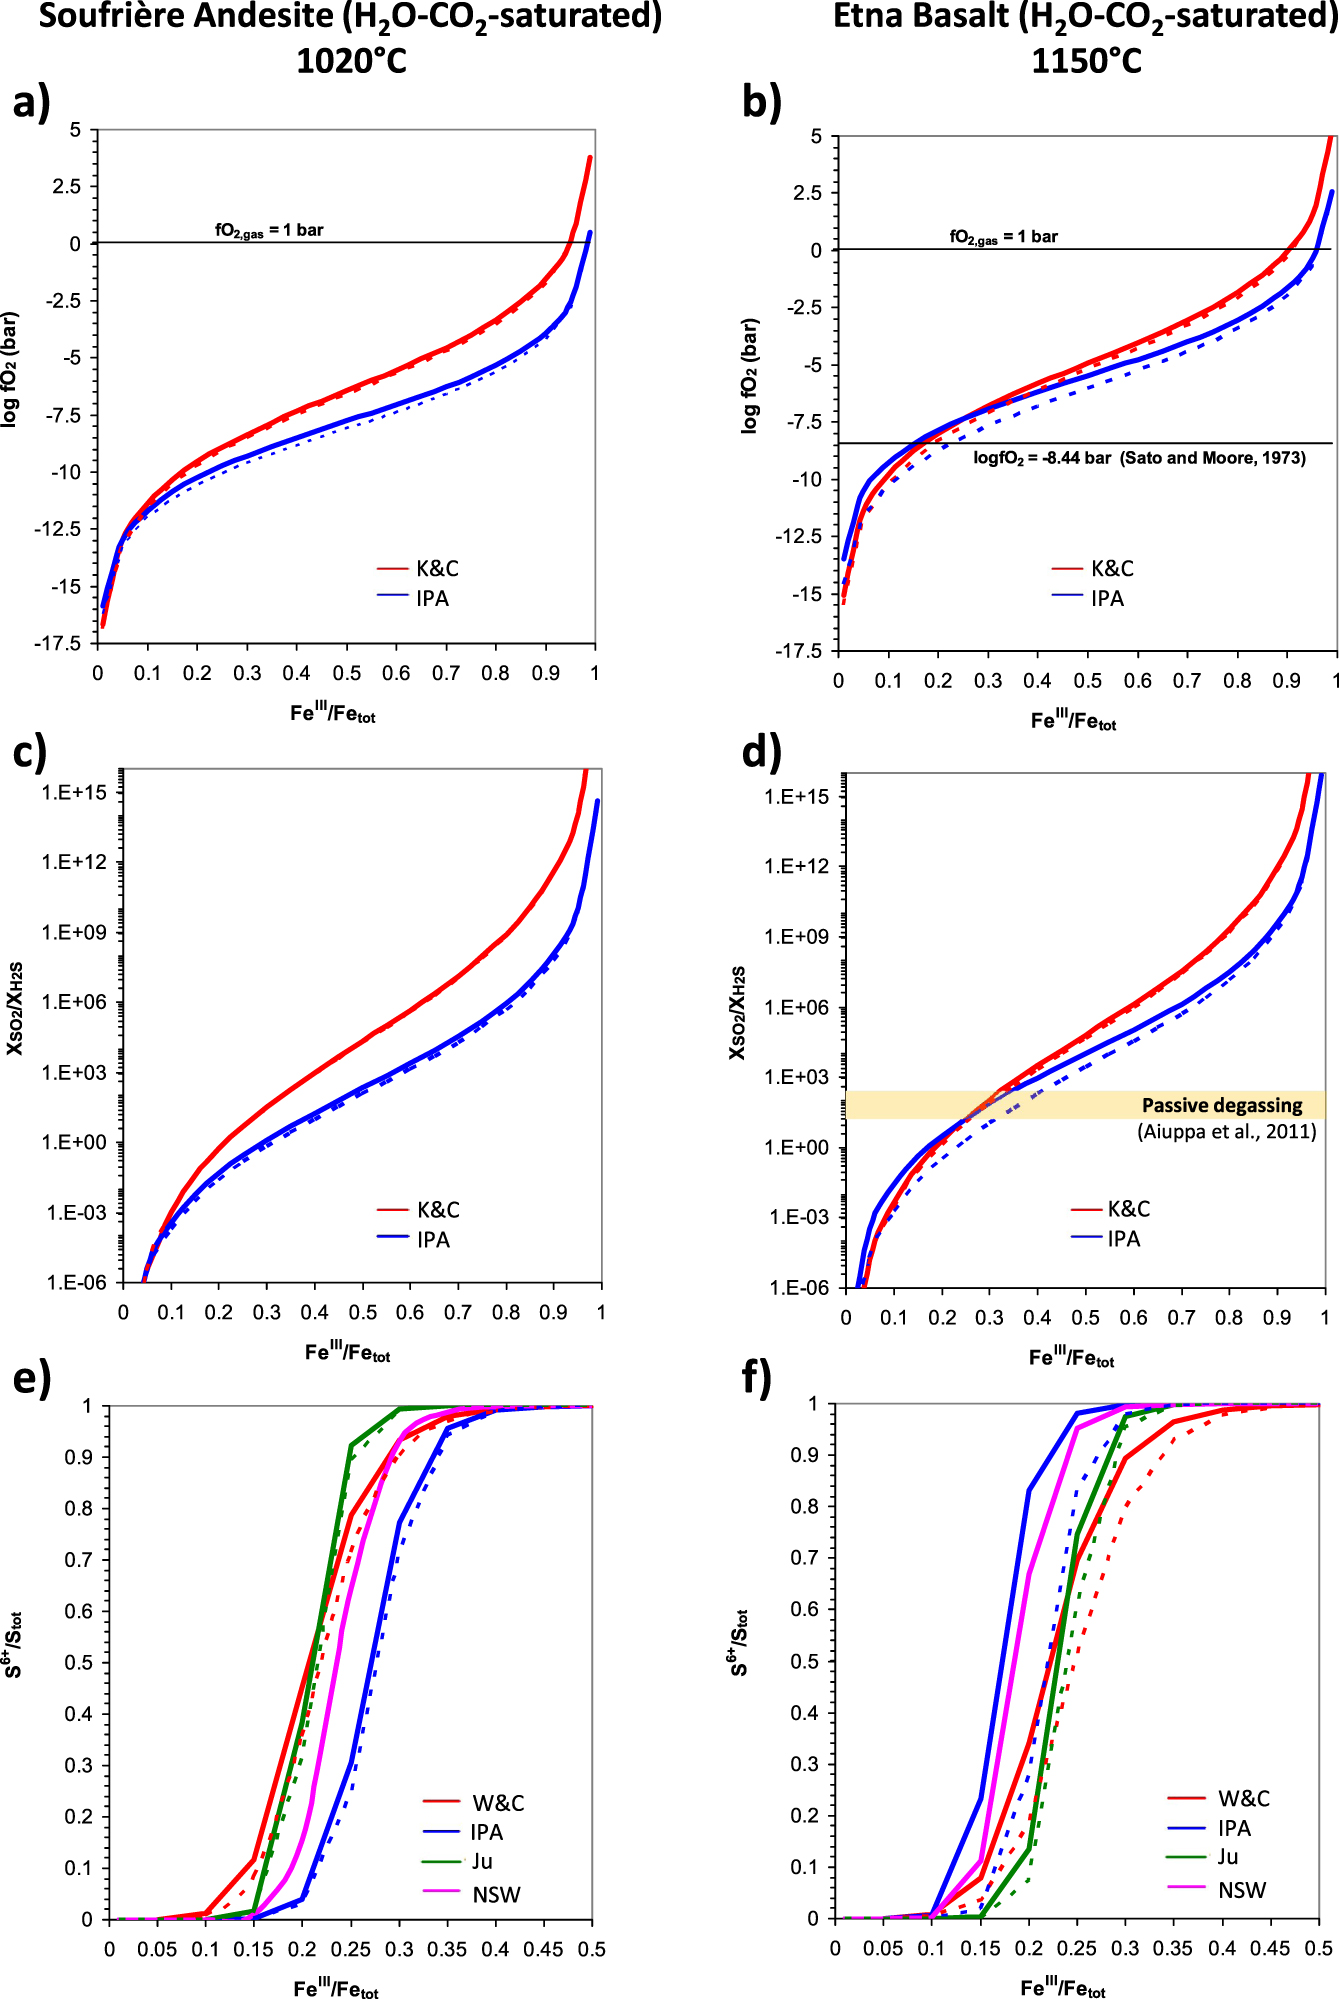
For the different oxybarometers available in the literature, I model the effect of different proportions of FeO and Fe2O3 at a given total iron content (i.e. the iron oxidation state) on the main redox indicators (fO2, SO2/H2S in gas, SVI∕Stot in melt) as well as on saturation pressure and gas H2O–CO2 compositions of two different melts of volcanological interests: Soufrière de Guadeloupe andesite [Metcalfe et al. 2022] and Etna basalt [Moretti et al. 2018]. Computations refer to (a) 1 bar and volatile-free conditions (Figure 3) and, for given values of dissolved H2O–CO2 from saturated MIs in literature (Table 1), (b) two pressure regimes for each system, represented by dissolved H2O–CO2 pairs corresponding to shallow and deep magma reservoirs (Table 1; Figure 4a,b). As independent variable for all computations I take the FeIII∕Fetot ratio, with calculation steps of 0.05. I push the calculation up to 0.99 for the sake of completeness of the present parametric approach, despite FeIII∕Fetot values >0.5 being unrealistic.
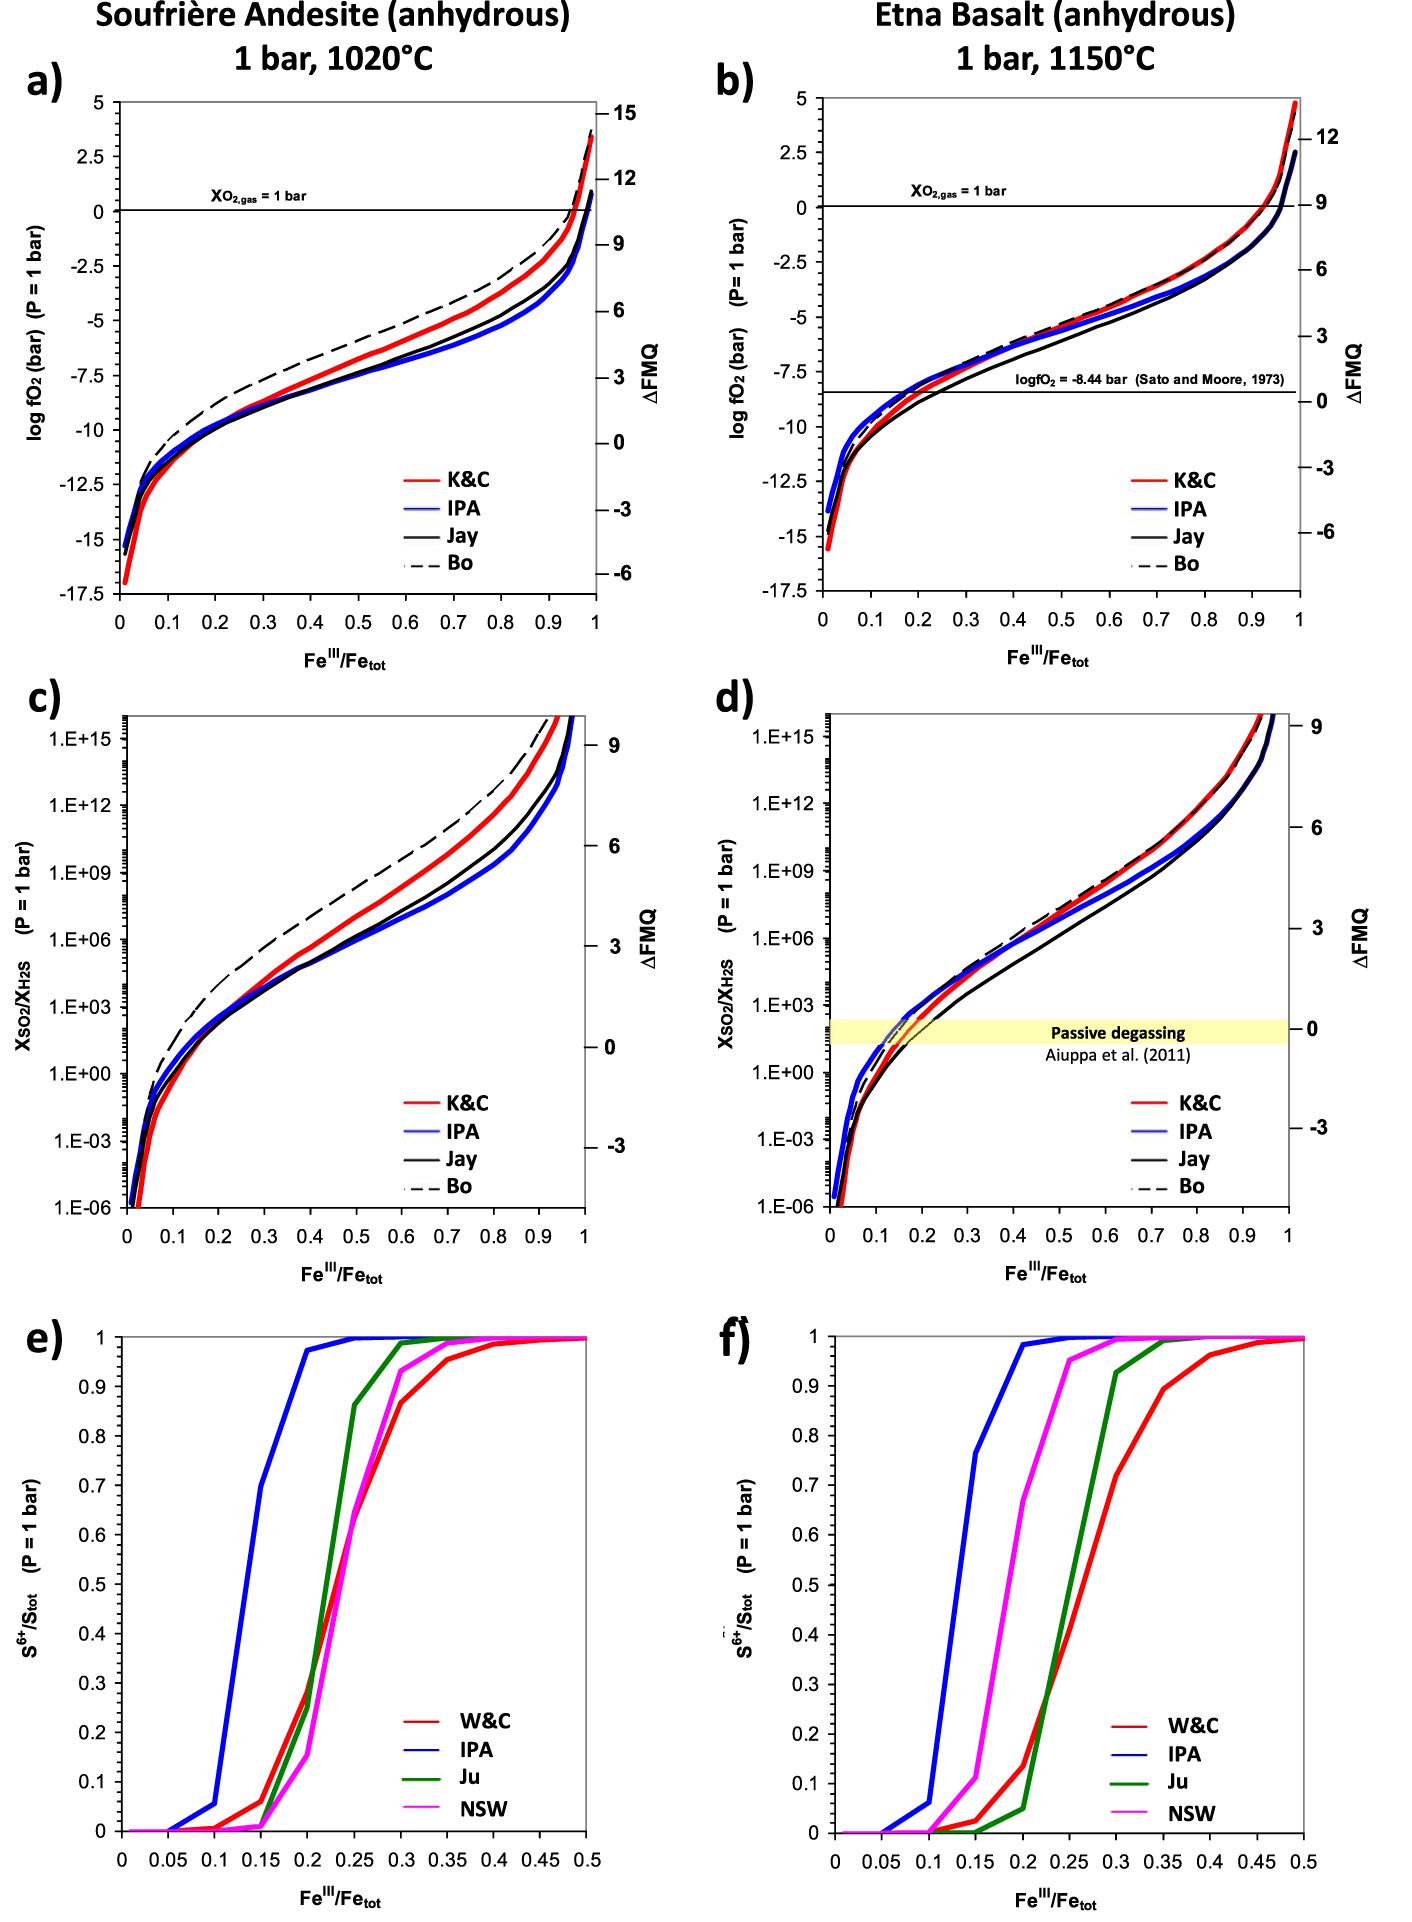
1-bar computations of logfO2, SO2/H2S and S6+∕Stot ratios for varying FeIII∕Fetot ratios via oxybarometers described in this study for a Soufrière de Guadeloupe Andesite at 1120 °C (panels a,c,e) and an Etna basalt at 1150 °C (panels b,d,f). Also reported are the fO2 value from (36) for Etna vents, extrapolated at 1150 °C (panel b) and the range of SO2/H2S variations (20–200) reported for Etna passive degassing (panel d). Right Y -axis in panels a–d refer to relative fO2 as ΔFMQ; this quantity is not reported in panels e, f because correspondences cannot be unique with S6+∕Stot values reported on the primary Y -axis given that the IPA and W&C use different fO2 estimations. In this study we attributed fO2 from the K&C equation to the Ju and W&C models; the NSW equation (33) does not use fO2 explicitly, although Nash et al. [2019] recommend values from the K&C equation. See Table 1 for adopted compositions, here simulated as volatile-free. Masquer
1-bar computations of logfO2, SO2/H2S and S6+∕Stot ratios for varying FeIII∕Fetot ratios via oxybarometers described in this study for a Soufrière de Guadeloupe Andesite at 1120 °C (panels a,c,e) and an Etna basalt at 1150 °C (panels b,d,f). Also reported are ... Lire la suite
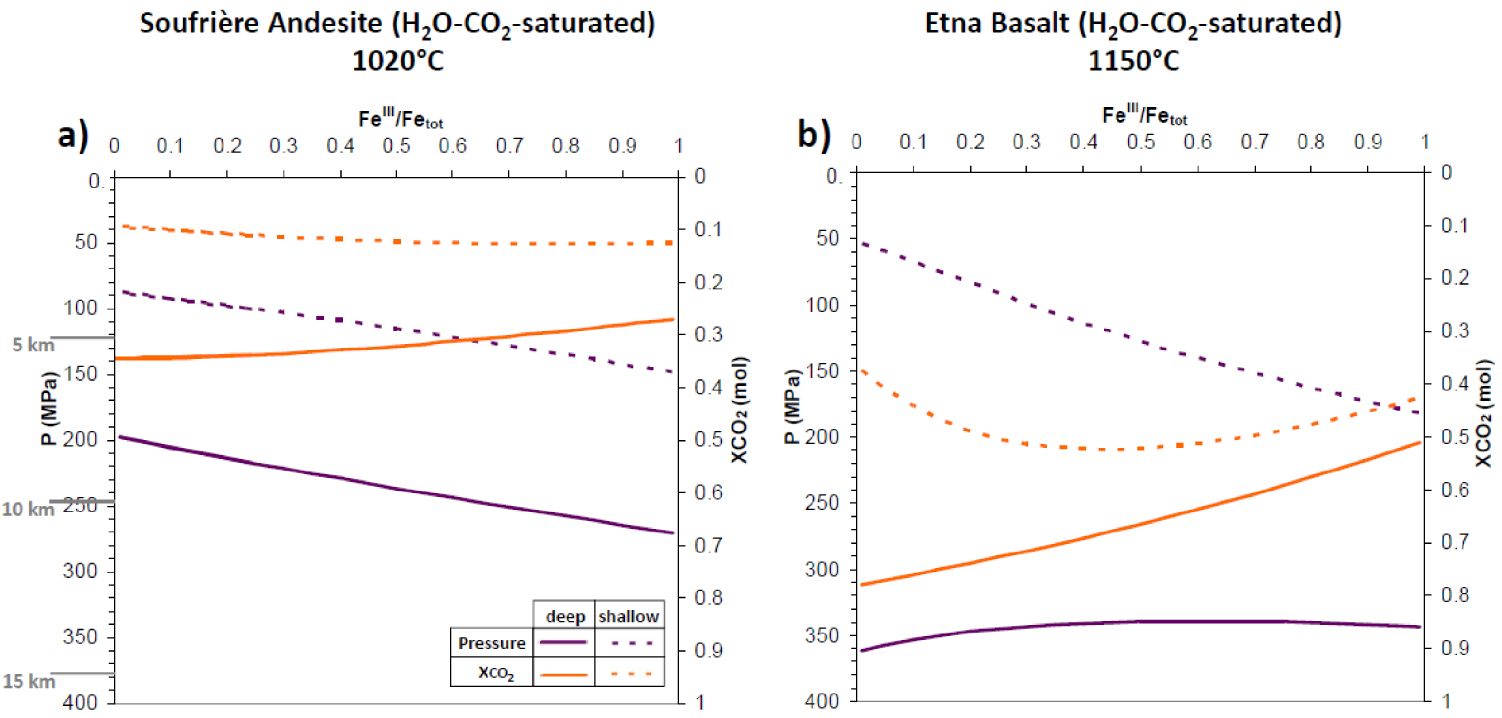
H2O–CO2-melt saturation pressures and gas phase composition for the Soufrière andesite at 1020 °C (panel a) and the Etna basalt at 1150 °C (panel b). Solid lines: deep system; dotted lines: shallow system; dark violet: saturation pressure; orange: XCO2 in gas. On the Y -axis are also reported, in grey, three depths (z) computed via P =𝜌 gz, with g the acceleration due to gravity and 𝜌 the magma/rock density, assumed constant at all depths (ρ = 2500 kg/m3). Masquer
H2O–CO2-melt saturation pressures and gas phase composition for the Soufrière andesite at 1020 °C (panel a) and the Etna basalt at 1150 °C (panel b). Solid lines: deep system; dotted lines: shallow system; dark violet: saturation pressure; orange: XCO2 in gas. On the Lire la suite
Compositions used in this study
| Soufrière de Guadeloupe andesite | Etna basalt | ||
|---|---|---|---|
| SiO2 | (wt%) | 73.17 | 47.25 |
| TiO2 | (wt%) | 0.537 | 1.94 |
| Al2O3 | (wt%) | 13.602 | 16.27 |
| FeOtot | (wt%) | 4.48 | 10.29 |
| MnO | (wt%) | 0.126 | 0.18 |
| MgO | (wt%) | 1.053 | 5.88 |
| CaO | (wt%) | 3.558 | 10.88 |
| Na2O | (wt%) | 1.695 | 3.5 |
| K2O | (wt%) | 1.653 | 2.13 |
| T (°C) | 1020 | 1150 | |
| Shallow magma | |||
| H2O | (wt%) | 3.4 | 2.5 |
| CO2 | (ppm by wt) | 120 | 150 |
| P-range (MPa) | 100.1–148.6 | 53.6–182.4 | |
| Deep magma | |||
| H2O | (wt%) | 4.2 | 3.24 |
| CO2 | (ppm by wt) | 866 | 1833 |
| P-range | (MPa) | 197.6–270.5 | 339.3–361.3 |
| Source | Metcalfe et al. [2022] | Moretti et al. [2018] | |
Pressure ranges were computed via the Papale et al. [2006] model for FeIII∕Fetot variations from 0.01 to 0.99. The temperature is the equilibrium temperature of the melt + gas system.
In the 1-bar case (Figure 3) I adopted the following oxybarometers: Bo, Jay, IPA and K&C for iron redox, and W&C, IPA, Ju and NSW for sulfur redox. In the P > 1-bar case (Figure 4) I could not adopt Bo and Jay for iron redox. Besides, the IPA provides a full internal computation of both fO2 and S-oxidation state, provided the FeIII∕Fetot ratio, whereas Ju, W&C and NSW adopt the fO2 value from the K&C equation, following either explicit model requirements and recommendations [e.g., Wallace and Carmichael 1994, Nash et al. 2019] or common practices adopted in many studies [e.g., Brounce et al. 2017, Moussallam et al. 2016, Venugopal et al. 2020].
Because in magmatic gases, the prevailing S species are SO2 and H2S [e.g., Giggenbach 1987, Moretti and Stefansson 2020, and references therein], the following reaction was also included:
| (34) |
| (35) |
Iron oxidation state (by XANES) and dissolved H2O and CO2 content of Etna MIs from Gennaro et al. [2020]
| Sample name | FeIII∕Fetot | H2O (wt%) | CO2 (ppm) | Ptot (bar) |
|---|---|---|---|---|
| FS-XS_8 | 0.306 | 5.77 | 2652 | 2387.3 |
| FS-XS_15 | 0.274 | 1.93 | 900 | 259.6 |
| FS-XS_20 | 0.352 | 2.81 | 1526 | 555.3 |
| FS-XS_22a | 0.327 | 4.81 | 2786 | 1650.6 |
| FS-XS_22b | 0.329 | 2.33 | 2033 | 380 |
| FS-XS_26b | 0.301 | 2.86 | 50 | 575.5 |
| FS-XS_28a | 0.358 | 2.48 | 2079 | 431.2 |
| FS-XS_28b | 0.336 | 2.92 | 1892 | 600.2 |
| FS-XS_30 | 0.321 | 2.51 | 1106 | 441.8 |
| FS-XS_35 | 0.333 | 3.99 | 1632 | 1130 |
| FS-XS_41 | 0.287 | 4.31 | 687 | 1321 |
| FS_00∗ | 0.277 | 3.7 | 882 | 970 |
| Spa_3n∗ | 0.328 | 0.16 | 50 | 2.7 |
| 2002_26∗ | 0.2 | 0.36 | 50 | 9.6 |
| 2002_30∗ | 0.229 | 1.06 | 50 | 77.7 |
| 2002_32 matrix gl∗ | 0.206 | 0 | 50 | 1.1 |
| 2006_4∗ | 0.248 | 0.92 | 470 | 58.5 |
| 2006_7emb∗ | 0.212 | 0.36 | 50 | 9.6 |
| 2008_1∗ | 0.168 | 0.13 | 430 | 2.1 |
| 2008_6A∗ | 0.209 | 0 | 50 | 1.1 |
| 2013_30∗ | 0.177 | 0.14 | 50 | 2.3 |
| 2013_33∗ | 0.225 | 0.08 | 50 | 1.4 |
| 2013_34∗ | 0.214 | 0.13 | 50 | 2.1 |
| Average | 0.27 |
Saturation pressure (Ptot) was computed from the model of Papale et al. [2006].
First of all, the different models return similar oxygen fugacities but with differences which are larger for andesite than basalts and which increase particularly for FeIII∕Fetot > 0.5 for both types (Figure 3a,b). The smaller spread of computed values for basalt is likely due to the large presence of basaltic samples in the calibration databases, in large part significantly overlapping for all these functions.
We also see that the IPA tends to give the lowest fO2 values for andesite at FeIII∕Fetot > 0.2 but for basalt the IPA returns the lowest fO2s at very oxidized conditions, for FeIII∕Fetot > 0.8. The physical limit of fO2 = 1 bar occurs at FeIII∕Fetot ≈ 0.95 for basalt but at 0.98 for andesite. For basalt, at FeIII∕Fetot < 0.8, lowest fO2 values are returned by the Jay model. We can also remark that for andesite highest values are systematically given by the Bo model. This model gives also highest values for basalt, but for FeIII∕Fetot > 0.3, where it tends to match perfectly the performances of the K&C equation. For basalt, at FeIII∕Fetot < 0.4, the Bo model tends to follow closely the IPA, which returns the highest fO2 values in this range of iron oxidation state. In andesite, for FeIII∕Fetot < 0.2, lowest fO2 values are given by the K&C model.
We may also remark that the Jay model and the IPA, on one side, and the K&C and the Bo ones, on the other side, have very similar trends and run closely with each other, particularly the IPA and Jay models in andesite and the K&C and Bo ones in basalt. This is a consequence of the coefficients for the logfO2 (or lnfO2) term, which follows reaction (1) for the Jay model and the IPA, but which is ≈0.2 for both the Bo and K&C equations.
In Figure 3b, I also report the fO2 estimate (−8.44, or ΔFMQ = 0.46) extrapolated at 1150 °C for Etna vents from the relation established by Sato and Moore [1973], even though originally calibrated for temperatures up to 1000 °C:
| (36) |
The very same behaviors as that of logfO2 are reported on the log-scale by SO2/H2S ratios in Figure 3c,d, as demanded by (35). Worth noting is the range values (20–200) for passive (uneruptive) Etna degassing reported in Aiuppa et al. [2011], which for its upper limit matches the (1-bar) ΔFMQ value of 0.46 from (36). The 20–200 interval (horizontal yellow bar in Figure 3f) is encountered in the ranges 0.11–0.16 for IPA, 0.11–0.17 for Bo, 0.15–0.19 for K&C and 0.17–0.22 for Jay. Higher SO2/H2S values (say around 1000) should be however expected during pre-eruptive stages, suggesting that the feeding magma arriving at the surface might have larger values of FeIII∕Fetot values, following models’ curves in Figure 3d.
S6+∕Stot ratios at 1 bar are plotted in Figure 3e,f. In the andesitic case lowest values are returned by the IPA (CTSFG model), which is leftward shifted by about 0.1 units in FeIII∕Fetot with respect to the Ju model: the IPA returns nearly full sulfur oxidation when the Ju computes a S6+∕Stot ratio of 0.5 at FeIII∕Fetot ≈ 0.22. Apart from the IPA, the W&C model gives the most sulfur oxidation for FeIII∕Fetot < 2, when it shows a cross-over with the Ju model. The cross-over with the NSW model is observed at FeIII∕Fetot ≈ 0.25. Below this value, the NSW model returns the highest sulfur reduction. Among these models, the IPA and the Ju vary from reduced to oxidized in about 0.15 units of FeIII∕Fetot. The W&C model varies from fully reduced to fully oxidized in about 0.3 units of FeIII∕Fetot, the NSW one in about 0.2 (Figure 3e). The larger FeIII∕Fetot interval displayed by the W&C to go from full reduction to full oxidation is related to the logfO2 coefficient of 1.02 instead of the value of 2 demanded by the O2 stoichiometric coefficient in reaction (24).
In the basaltic case, the IPA curve has trend and variations very similar to the andesitic one, suggesting that T-variations are compensated by compositional differences. Compared to andesite, the Ju and W&C curves shift to higher FeIII∕Fetot, with slight modifications in their shape due to the different fO2 for basalt with respect to andesite (provided via the K&C equation 6 for both expressions). The W&C remains the function requiring the largest FeIII∕Fetot interval to oxidize all sulfide in sulfate.
To describe the redox behavior of H2O–CO2-saturated andesite and basalt at given temperatures, we must first investigate the role of iron oxidation state on saturation properties such as pressure and gas phase composition. Figure 4a,b clearly shows the significant impact of iron oxidation state, a fact which is too often disregarded despite the abundance of iron in geological melts. In particular, increasing iron oxidation from fully reduced to fully oxidized decreases saturation pressure by a factor of about two for both “shallow” and “deep” andesite. An even larger variation, by a factor > 3 is observed in “shallow” basalt, whereas “deep” basalt maintains values around 350 MPa, even increasing to 365 MPa when approaching full iron reduction. Also, the gas-phase composition shows unexpected behaviors, which appear to depend on pressure: XCO2 increases with increasing FeIII∕Fetot for shallow andesite, but diminishes for the deep one (Figure 4a); in shallow basalt XCO2 shows a minimum at FeIII∕Fetot ≈ 0.45, whereas in deep basalt XCO2 decreases linearly with increasing iron oxidation.
These results demonstrate that an incorrect estimate of iron oxidation state has obvious implications for geothermobarometry based on melt inclusion volatile contents, resulting in inappropriate petrologic estimates of magma reservoir depths, uncertain reconstruction of plumbing systems and also potentially unacceptable mismatch between petrologic and geophysical observations.
For what concerns fO2, results are given in Figure 5a,b. The K&C model and the IPA return nearly the same value under reduced conditions (FeIII∕Fetot < 1) for andesite (Figure 5a), whereas for increasing iron oxidation the K&C equation returns fO2 values higher than the IPA, with differences of about 2.5 log-units at the (hypothetical) FeIII∕Fetot value of 0.95, when the K&C curve crosses the fO2 = 1 bar line. For andesite, both models compute a fO2 value slightly higher for shallow magma than deep one for the iron oxidation ratio. In the case of basalt (Figure 5b), the difference in values from the two models are smaller, but the IPA gives fO2 values higher than K&C ones for FeIII∕Fetot < 0.25. Besides, the IPA gives generally fO2 values that are higher for the deep basalt than for the shallow one and which are up to one-log unit in the 0.01–0.2 FeIII∕Fetot range. On the contrary, logfO2 values from the K&C equation are close for both shallow and deep basalt, but not indistinguishable as for andesite in panel a. The larger spread between deep and shallow basalt (Figure 5b), compared to andesite, is due to the role of pressure–volume terms, which is larger, lower the FeIII∕Fetot ratio. This effect is greater for the IPA than the K&C equation.
Computations of logfO2, SO2/H2S and S6+∕Stot ratios for the same melts as in Figure 4 and for varying FeIII∕Fetot ratios. The different oxybarometers described in this study were adopted. Also reported are the fO2 value from (36) for Etna vents, extrapolated at 1150 °C (panel b) and the range of SO2/H2S variations (20–200) reported for Etna passive degassing (panel d). In all panels, solid lines represent deep magma conditions and dotted lines shallow magma conditions. See Table 1 for adopted compositions. For each computation, corresponding pressure should be read in panels a and b for andesite and basalt, respectively. Because pressure is not constant, contrary to the 1-bar case of Figure 3, relative fO2 as ΔFQM is not given on secondary Y -axes, given that multiple ΔFQM values would correspond to quantities reported on primary Y -axes. Masquer
Computations of logfO2, SO2/H2S and S6+∕Stot ratios for the same melts as in Figure 4 and for varying FeIII∕Fetot ratios. The different oxybarometers described in this study were adopted. Also reported are the fO2 value from (36) ... Lire la suite
The logfO2 value of −8.44 from (36) is encountered by the shallow basalt for iron conditions more slightly reduced than at 1 bar (0.14 and 0.17 in FeIII∕Fetot for the IPA and the K&C equation, respectively), whereas the deep basalt matches it at slightly more oxidized conditions for both the K&C equation (FeIII∕Fetot = 0.19) and the IPA (FeIII∕Fetot = 0.23) (Figure 5b).
As for 1-bar data, log-scale SO2/H2S ratios from the K&C equation and the IPA show the same relative variations of logfO2 patterns for the same pressure class (deep or shallow; Figure 5c,d). In Figure 5d we see that the 20–200 SO2/H2S interval (horizontal yellow bar) reported by Aiuppa et al. [2011] is encountered at FeIII∕Fetot values higher than those from the 1-bar computation, that is, 0.25–0.31 for the K&C and the shallow-basalt IPA, and 0.31–0.4 for the deep-basalt IPA.
S6+∕Stot ratios (Figure 5e,f) from the W&C and Ju equations do not differ substantially from the 1-bar values, differences being related to the role of pressure and dissolved water on the fO2 calculated via the K&C equation. The NSW model instead returns the same results as in the 1-bar case, because (33) includes neither pressure nor fO2 and is P-independent (Figure 5e,f). The most significant variations are displayed by the IPA oxybarometer. In the case of andesite, shallow and deep computations are nearly equivalent (the shallow one slightly shifted to higher iron oxidation ratios), but compared to 1-bar results, they are shifted by 0.1 log-units to higher FeIII∕Fetot ratios. In case of basalt, we also observe a shift of 0.05 units to larger FeIII∕Fetot ratios, which become 0.1 for the deep basalt.
4. Application to Etna volcano
Because of its high solubility and pressure-dependence, water is certainly a major component of magmatic differentiation taking place on magma ascent. Therefore, MIs from decompressing and degassing magmas should record the effect of water on iron oxidation state. Figure 6 plots then the MI-based XANES FeIII∕Fetot data reported for Etna basalts in Gennaro et al. [Gennaro et al. 2020; see their Tables 4 and 5] and their covariation with dissolved H2O content. The data in the figure suggests indeed that the dissolved water can be a major compositional control of iron oxidation at Etna volcano. In particular, Figure 6 shows that in the Etnean magmas, (1) dehydration from ∼6 wt% to ∼2.5 wt% is associated with constant or even slightly increasing iron oxidation state, but (2) further dehydration is accompanied by iron reduction, with FeIII∕Fetot decreasing from about 0.32 to about 0.2.
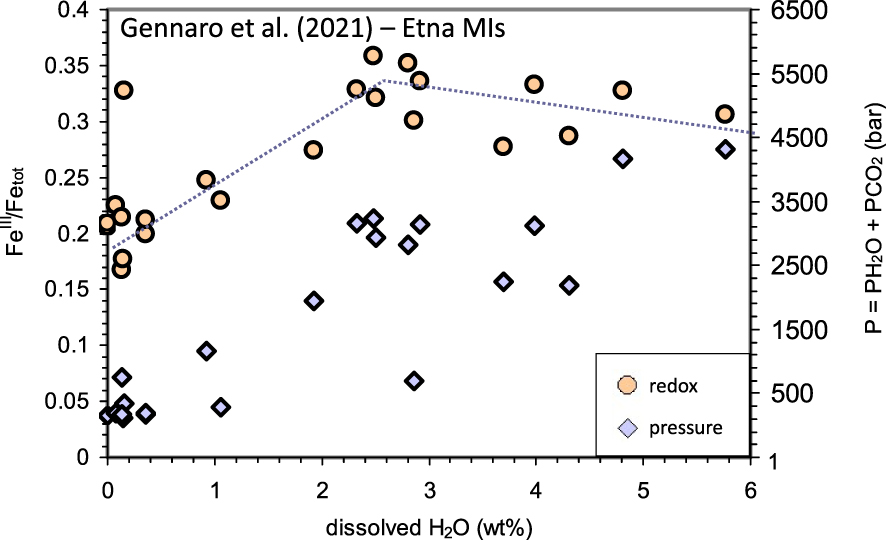
Dissolved H2O versus FeIII∕Fetot ratios (circles; left Y -axis), measured by Fe-XANES [Gennaro et al. 2020; see Table 2]. Also reported are melt–fluid saturation pressures (diamond; right Y -axis) computed via the Papale et al. [2006].
Figure 6 plots also the total pressure (P = PH2O + PCO2) recalculated via Papale et al. [2006] with using for all MIs the average Etna composition of Table 1. We see that pressure decreases more or less regularly, but not following a unique decompression trend. This well-known behavior reflects the presence of different populations of melt inclusions equilibrated under different H2O/CO2 gas ratios and gas/melt proportion for the same pressure. These different populations are associated with different gas/melt proportions, mainly due to deep-gas fluxing: deeply exsolved and CO2-dominated fluids rise through the plumbing system re-equilibrating with the magma at different depths and causing its dehydration [for a description of fluxing at Etna see also Métrich et al. 2004, Spilliaert et al. 2006, Aiuppa et al. 2007, Moretti et al. 2018]. This process also explains why at many open-conduit basaltic systems, including Etna, the onset of eruptions due to the arrival of deep and fresh magma is anticipated by periods of enhanced CO2 degassing and by the increase in plume CO2∕Stot ratios [Aiuppa et al. 2007, 2016, Paonita et al. 2021].
To understand more about the compositional role of water on fO2 in a rising and degassing Etna basalt, we then consider the average Etna melt (Table 1), the Gennaro et al. [2020] water contents with pressures from the Papale et al. [2006] model (Figure 6) and attribute to all compositions the average FeIII∕Fetot ratio (0.27) from Gennaro et al. [2020] to calculate the fO2 via the IPA and the K&C equation (Table 2).
We first perform computations by setting P ≈ PH2O, that is, separating the sole effect of water, which affects melt polymerization, from that of CO2, which in this system is the main fluid pressure medium. The results are plotted in Figure 7a,b and show that the IPA returns a range of ΔFMQ variations much narrower than that of the K&C equation, with an average ΔFMQ of 0.92. At very low H2O contents, both models approach the ΔFMQ value from (36) (0.46). It is worth noting that the K&C equation transposes entirely the melt FeIII∕Fetot variations into fO2 fluctuations (Figure 6). On the contrary, the IPA attributes a large part of the observed FeIII∕Fetot evolution to water content variations.
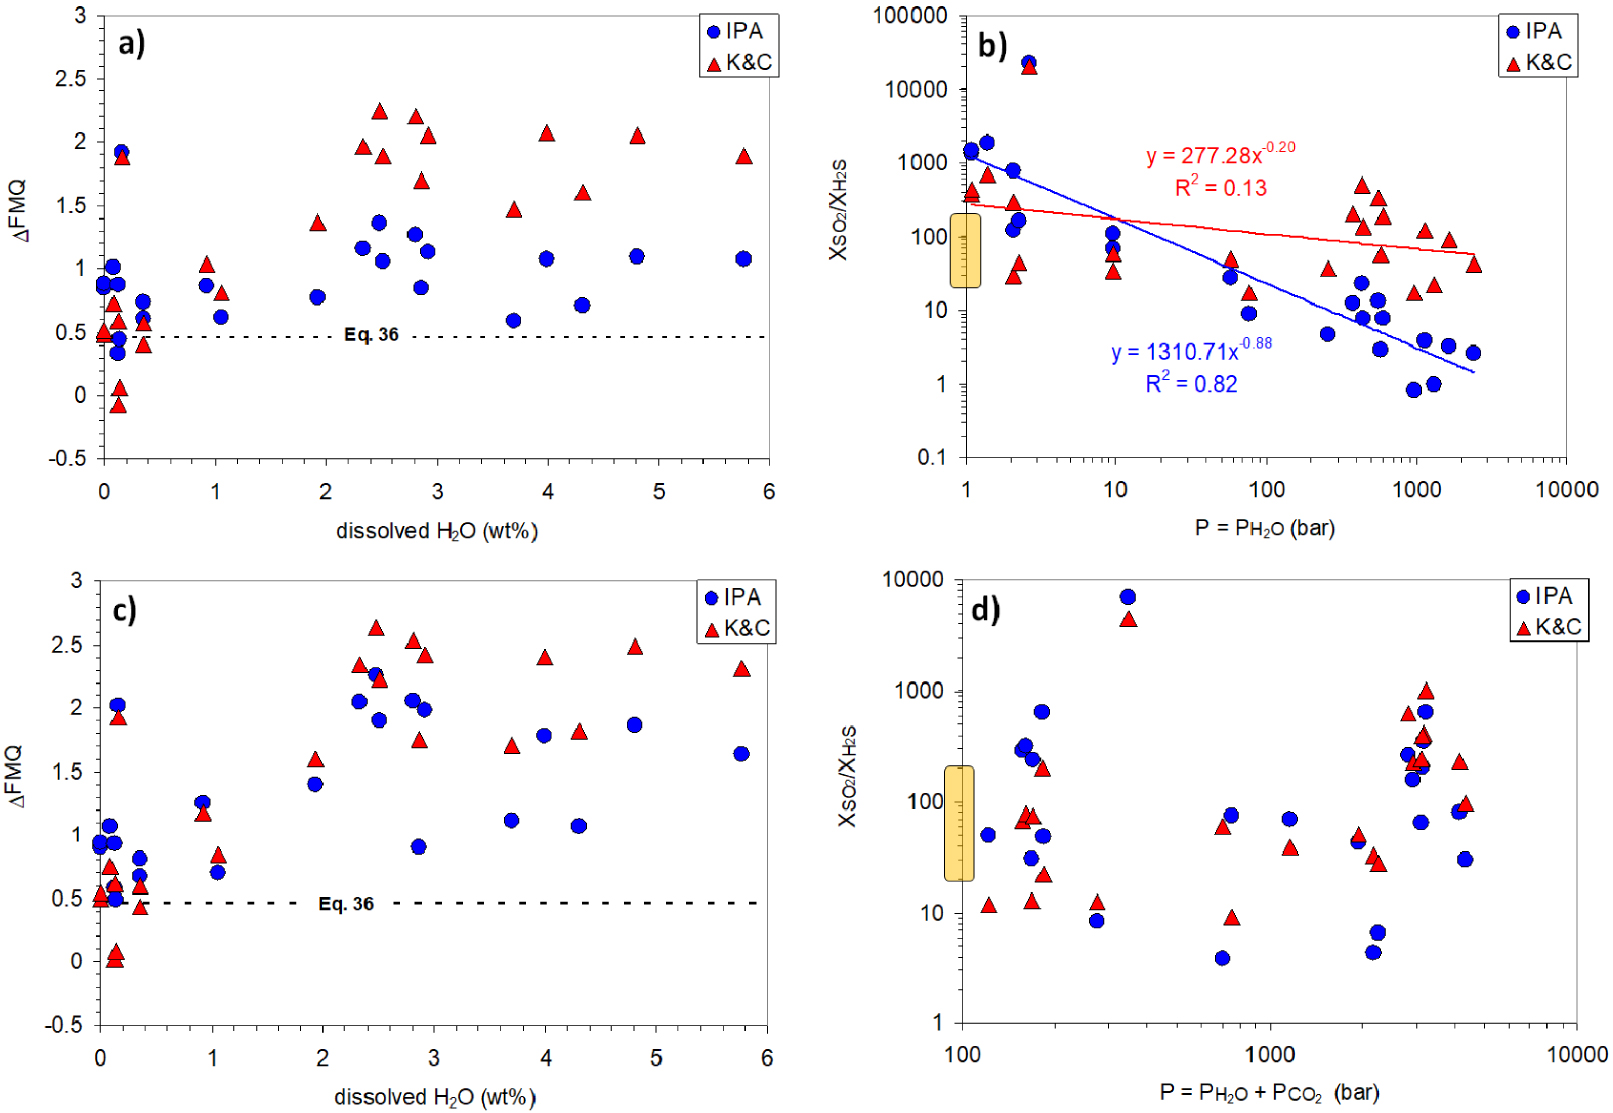
Results of the IPA and K&C computations of relative logfO2 (given as ΔFMQ; panels a,c) and SO2/H2S (panels b,d) for P = PH2O (panels a,b) and for Ptot = PH2O + PCO2 (panels c,d), as computed via Papale et al. [2006]. Also reported are the fO2 value from (36) for Etna vents, extrapolated at 1150 °C (panels a,c) and the range of SO2/H2S variations (20–200) reported for Etna passive degassing (panels b,d).
In terms of SO2/H2S gas ratios (Figure 7b; log-scale), both models calculate increasing ratios with increasing dehydration and thus decreasing PH2O. This trend is however more marked and also well-defined for the IPA than the K&C. Compared to the Aiuppa et al. [2011] measured values (20–200; yellow semi-transparent box on the Y-axis), both models overestimate the SO2/H2S at PH2O = 1 bar. However, we should remember that the observed range of values refer to passive (uneruptive) degassing, whereas magmas arriving at the surface are expected to carry larger SO2/H2S ratios. For the same reason, the passive degassing interval is very likely determined by magmas at PH2O > 1 bar, up to almost 100 bar (Figure 7b).
By including PCO2 (Ptot = PH2O + PCO2) (Figure 7c), computed ΔFMQ values for most hydrous datapoints are shifted to higher values compared to the previous case, particularly for the IPA results, whose average ΔFMQ is now 1.3. For dehydrated melts both models approach the ΔFMQ value (0.46) from (36). The IPA results follow a trend more similar to the K&C equation than previously, but this latter model still transfers almost completely to fO2 the trend of FeIII∕Fetot variations observed in Figure 6. SO2/H2S gas ratios (log-scale) from both models are quite scattered when plotted versus Ptot (Figure 7d). Passive degassing values (20–200) are compatible with degassing magma at different depths.
In order to inspect how iron oxidation state varies for hydrous Etna compositions, I then run at 1150 °C the K&C model and the IPA based on the average Etna composition for the 42 H2O–CO2-saturated compositions reported in Moretti et al. [2018] (see Table 3). Missing the information on iron oxidation state in these samples, I compute the saturation pressures (Table 3) via Papale et al. [2006] by using the average FeIII∕Fetot ratio (0.27) from Gennaro et al. [2020] data (Table 2; Figure 6). Then, I calculate precisely the FeIII∕Fetot for these samples by imposing at all pressures the average fO2 value corresponding to ΔFMQ = 1, which is intermediate to the averages returned by the IPA computations reported in Figure 7a,c.
Dissolved H2O and CO2 content of Etna MIs from Moretti et al. [2018], also including data from Del Carlo and Pompilio [2004]
| H2O (wt%) | CO2 (ppm) | P (bar) | XH 2Ogas (mol) | FeIII∕Fetot | Source | |
|---|---|---|---|---|---|---|
| IPA | K&C | |||||
| 2.22 | 272 | 952.0 | 0.369 | 0.282 | 0.243 | Del Carlo and Pompilio [2004] |
| 1.02 | 283 | 836.7 | 0.969 | 0.241 | 0.246 | Del Carlo and Pompilio [2004] |
| 2.25 | 503 | 1392.2 | 0.325 | 0.262 | 0.240 | Del Carlo and Pompilio [2004] |
| 2.86 | 880 | 2830.2 | 0.348 | 0.226 | 0.228 | Del Carlo and Pompilio [2004] |
| 3.13 | 576 | 1677.1 | 0.456 | 0.275 | 0.236 | Del Carlo and Pompilio [2004] |
| 1.26 | 289 | 876.5 | 0.204 | 0.249 | 0.246 | Del Carlo and Pompilio [2004] |
| 1.56 | 451 | 1201.7 | 0.214 | 0.247 | 0.243 | Del Carlo and Pompilio [2004] |
| 2.63 | 266 | 1862.4 | 0.502 | 0.253 | 0.236 | Del Carlo and Pompilio [2004] |
| 3.04 | 207 | 1847.7 | 0.624 | 0.265 | 0.235 | Del Carlo and Pompilio [2004] |
| 2.55 | 615 | 1614.4 | 0.348 | 0.262 | 0.238 | Del Carlo and Pompilio [2004] |
| 1.94 | 221 | 841.2 | 0.390 | 0.277 | 0.245 | Del Carlo and Pompilio [2004] |
| 1.94 | 1404 | 2561.4 | 0.235 | 0.214 | 0.231 | Del Carlo and Pompilio [2004] |
| 1.94 | 3 | 292.0 | 0.967 | 0.307 | 0.249 | Del Carlo and Pompilio [2004] |
| 1.94 | 210 | 803.6 | 0.378 | 0.279 | 0.245 | Del Carlo and Pompilio [2004] |
| 1.94 | 0 | 220.0 | 0.998 | 0.311 | 0.250 | Del Carlo and Pompilio [2004] |
| 1.29 | 811 | 1693.7 | 0.126 | 0.221 | 0.239 | Moretti et al. [2018] |
| 1.29 | 539 | 1306.3 | 0.153 | 0.234 | 0.242 | Moretti et al. [2018] |
| 1.39 | 474 | 1216.5 | 0.180 | 0.240 | 0.243 | Moretti et al. [2018] |
| 1.25 | 720 | 1565.4 | 0.128 | 0.224 | 0.240 | Moretti et al. [2018] |
| 2.10 | 323 | 1864.1 | 0.362 | 0.239 | 0.236 | Moretti et al. [2018] |
| 0.95 | 415 | 1865.5 | 0.118 | 0.206 | 0.239 | Moretti et al. [2018] |
| 0.54 | 226 | 675.3 | 0.083 | 0.228 | 0.249 | Moretti et al. [2018] |
| 3.02 | 708 | 1837.7 | 0.405 | 0.265 | 0.235 | Moretti et al. [2018] |
| 1.60 | 149 | 631.3 | 0.375 | 0.274 | 0.247 | Moretti et al. [2018] |
| 1.60 | 149 | 631.3 | 0.375 | 0.274 | 0.247 | Moretti et al. [2018] |
| 1.99 | 200 | 886.6 | 0.418 | 0.277 | 0.244 | Moretti et al. [2018] |
| 1.99 | 200 | 886.6 | 0.418 | 0.277 | 0.244 | Moretti et al. [2018] |
| 1.31 | 81 | 421.0 | 0.402 | 0.272 | 0.249 | Moretti et al. [2018] |
| 1.31 | 81 | 421.0 | 0.402 | 0.272 | 0.249 | Moretti et al. [2018] |
| 1.31 | 81 | 421.0 | 0.402 | 0.272 | 0.249 | Moretti et al. [2018] |
| 1.31 | 81 | 421.0 | 0.402 | 0.272 | 0.249 | Moretti et al. [2018] |
| 2.50 | 140 | 782.0 | 0.596 | 0.301 | 0.244 | Moretti et al. [2018] |
| 2.50 | 140 | 782.0 | 0.596 | 0.301 | 0.244 | Moretti et al. [2018] |
| 1.88 | 92 | 540.7 | 0.540 | 0.290 | 0.247 | Moretti et al. [2018] |
| 1.88 | 92 | 540.7 | 0.540 | 0.290 | 0.247 | Moretti et al. [2018] |
| 2.08 | 546 | 1430.2 | 0.284 | 0.255 | 0.240 | Moretti et al. [2018] |
| 2.08 | 546 | 1430.2 | 0.284 | 0.255 | 0.240 | Moretti et al. [2018] |
| 3.24 | 1833 | 3118.8 | 0.307 | 0.225 | 0.225 | Moretti et al. [2018] |
| 3.24 | 1833 | 3118.8 | 0.307 | 0.225 | 0.225 | Moretti et al. [2018] |
| 2.86 | 717 | 1817.2 | 0.377 | 0.261 | 0.235 | Moretti et al. [2018] |
| 2.86 | 717 | 1817.2 | 0.377 | 0.261 | 0.235 | Moretti et al. [2018] |
| 1.74 | 532 | 1356.5 | 0.228 | 0.247 | 0.241 | Moretti et al. [2018] |
| 1.74 | 532 | 1356.5 | 0.228 | 0.247 | 0.241 | Moretti et al. [2018] |
| 1.76 | 532 | 1356.5 | 0.228 | 0.248 | 0.241 | Moretti et al. [2018] |
| 1.75 | 532 | 1356.5 | 0.228 | 0.247 | 0.241 | Moretti et al. [2018] |
| 2.50 | 94 | 674.8 | 0.673 | 0.307 | 0.245 | Moretti et al. [2018] |
| 3.50 | 1136 | 2464.2 | 0.405 | 0.250 | 0.230 | Moretti et al. [2018] |
Results of this exercise are given in Table 3 and Figure 8. The much larger reliability of the IPA in treating the role of composition, in this case due to water only, emerges from the trend sketched by modelled compositions. The IPA results at constant FMQ+1 adapt, at least in part, to the trend of Gennaro et al. [2020] data, telling us that a part of FeIII∕Fetot variations are due to the compositional variations determined by water content. Instead, the K&C model returns no variations of FeIII∕Fetot with the H2O content (Figure 8). This is in line with the results in Figure 7a,c, which showed that the K&C equation in the range of conditions of interest here actually is insensitive to water content and turns all the fluctuations in FeIII∕Fetot into fO2 variations.
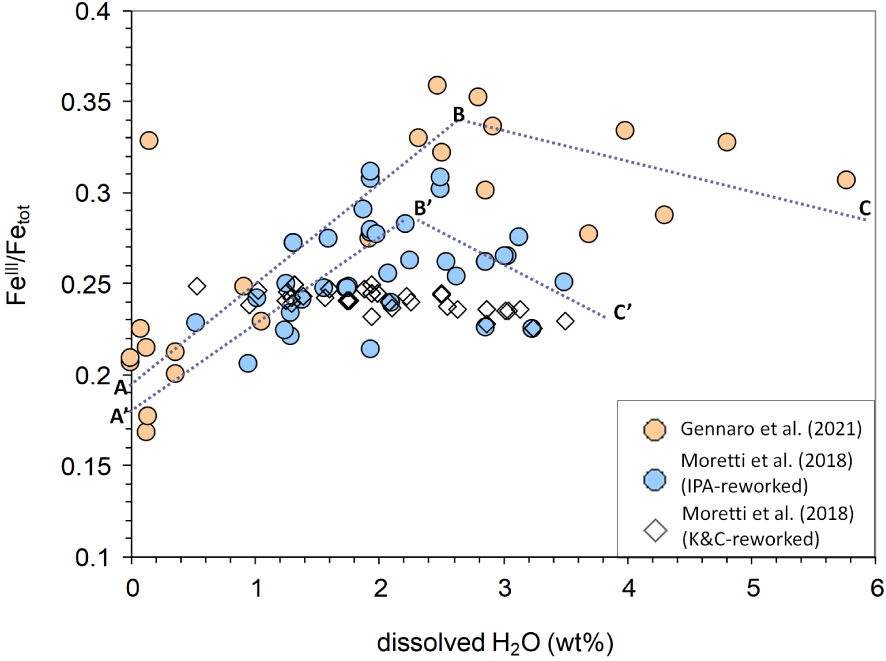
Dissolved H2O versus FeIII∕Fetot ratios measured via XANES by Gennaro et al. [2020] (see Table 2) and from MIS reported in Moretti et al. [2018] (Table 3) computed at FMQ+1 via the IPA and the K&C equation. Note that secondary phenomena (post entrapment crystallization and H+ diffusion) may have affected measured MI oxidation states, yielding iron oxidation. Although these were approximately evaluated by Gennaro et al. [2020] to shift positively the FeIII∕Fetot ratio of at most 0.06 units for most hydrated samples, they cannot be precisely assessed and then ruled out. Masquer
Dissolved H2O versus FeIII∕Fetot ratios measured via XANES by Gennaro et al. [2020] (see Table 2) and from MIS reported in Moretti et al. [2018] (Table 3) computed at FMQ+1 via the IPA and the K&C equation. Note ... Lire la suite
Therefore, we can conclude that dehydration of Etna basalt at some point (H2O ≈ 2.5 wt%, from the data of Gennaro et al. [2020]) produces iron reduction, which takes place up to the surface also for a constant relative fO2 corresponding to FMQ+1. Besides, the difference in slope of trends in Figure 8 is such that on the reduction due to dehydration part of the diagram (H2O < 2.5 wt%)
Finally, Figure 9 combines all available data to show that Etna MIs bear information on several degassing patterns with pressure (depth), resulting from the combination of two extremes processes: (1) decompression degassing, producing a gas phase enriched in H2O on magma rise, and (2) CO2-fluxing, leading to CO2-dominated gas phase at shallow depths and also at vent conditions. Both mechanisms yield melt dehydration [Spilliaert et al. 2006, Blundy et al. 2010, Oppenheimer et al. 2011, Pino et al. 2011, Moretti et al. 2013a, b, 2018, 2019] and result in a generally positive correlation between melt FeIII∕Fetot and XH2O in the exsolved gas phase. Nevertheless, negative correlations yielding trends of oxidation with dehydration at high water content (see trends BC and B′C′ in Figure 8) can be appreciated.
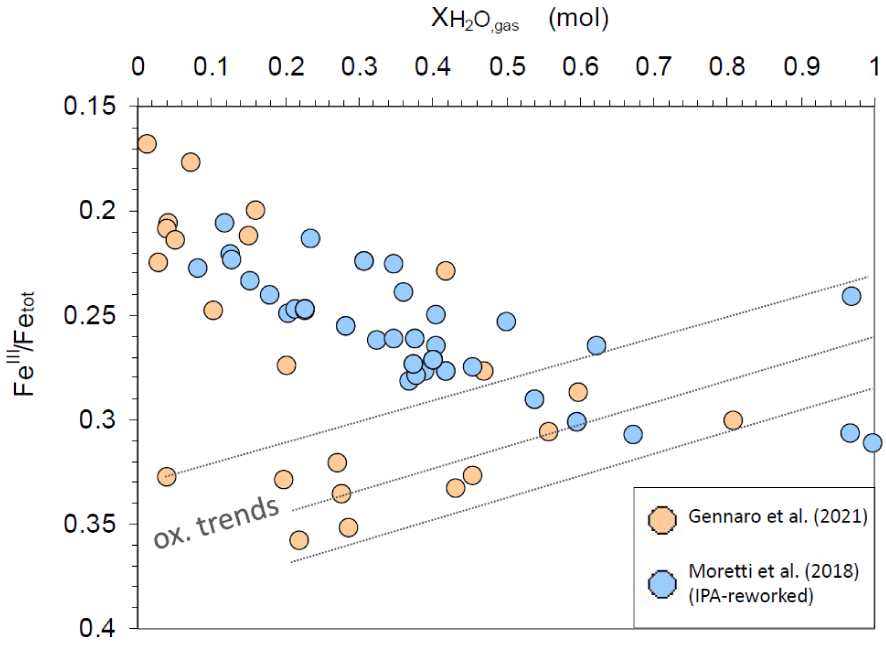
Molar water proportion in the exsolved gas (XH2Ogas) versus measured or computed FeIII∕Fetot ratios for MIs from Gennaro et al. [2020]; measured FeIII∕Fetot ratios via XANES; see Table 2] and from Moretti et al. [2018] (Table 3, IPA-computed FeIII∕Fetot ratios at FMQ+1). Redox variations occur in the 0.1 MPa–432 MPa range of total pressure [via the Papale et al. [2006] fluid–melt saturation model].
5. Discussion and conclusions
The characterization of melt inclusions in terms of dissolved volatiles and oxidation state of iron and sulfur has allowed a vast amount of assessments of volcano-magmatic fluid speciation and evolution from depth to surface vents, where discharged gases are measured. A critical issue is represented by the magma redox evolution, which is typically reported as the oxygen fugacity, fO2. Tracking redox evolution and fluid speciation via modelling of melt–fluid saturation plus fO2 in different environments from the magma source at depth to the surface is challenging, even at equilibrium conditions and for well-established relations about solid–liquid–gas exchanges. The use of empirical expression may do the required job, but without a clear appraisal of the reactive nature of silicate melts, any redox assessment can be biased. Oxygen fugacity, in particular, is a parameter that cannot be treated as a Maxwell’s demon or an adjustable parameter to fit the experimental data. Determination of fO2 from melts/glasses demands accounting for the role of bulk composition, which shifts the redox properties through the reactive behavior of the silicate network, that is, its polymerization.
Therefore, the right choice of models is strategic for (1) the petrologic interpretation of plumbing systems, (2) the definition of magma processes throughout the P–T conditions encountered during magma differentiation and rise, and (3) the prompt evaluation of the magma state based on the monitoring of volcanic gases.
In many studies [e.g. Oppenheimer et al. 2011, Moussallam et al. 2014, 2016, 2019], it is shown that fO2 tends to decrease on magma rise and decompression degassing [path P2 in Figure 1; see also Moretti and Stefansson 2020], at least if the melt contains iron [Burgisser and Scaillet 2007]. However, the fact that the fO2 signature of deep magmas is lost because fO2 decreases on magma rise sounded counterintuitive to many. However, if we simply consider the Total Oxygen/Total Cations ratio from melt formulas, we see that an olivine melt has a value of 4/3, orthopyroxene and clinopyroxene 3/2, whereas silica has a value of 2 and albite of 8/5. By including water, the Total Oxygen/Total Cations ratio tends to increase even more with the progressive dehydration taking place on decompression. So, we should expect fO2 increasing toward the surface simply because magmatic differentiation, which includes degassing and dehydration, points to increasing the relative amount of oxygen in the melt. However, magma rise and differentiation imply increasing polymerization, particularly via melt dehydration, which decreases the amount of reactive oxygen, measured by [O2−]. Because O2− activity is directly related to fO2 via the oxygen electrode (reaction (13)) we can then easily figure out why, at a given temperature, fO2 decreases. This behavior is then a reflex of the fact that in silicate melts, oxygen tout court cannot be identified as the solvent, despite its nominal abundance [Allanore 2015, Moretti 2021, Moretti and Ottonello 2022]. Nevertheless, fO2 decrease does not mean necessarily iron reduction: this is seen in Figure 4b, for the same FeIII∕Fetot values of both shallow and deep Etna basalt, and in Figure 9, where a change of trivalent iron speciation clearly intervenes at H2O ≈ 2.5 wt%. Therefore, speciation state, which in melts depends on composition and polymerization, is a one of the major controls of the oxidation state of multivalent elements dissolved in melts. In particular, at large depths the fO2 decrease upon magma differentiation does not correspond necessarily to iron reduction (Figure 9).
In this study we have shown the performances of different oxybarometers at 1 bar and also at pressures corresponding to H2O–CO2-melt saturation. The following recommendations and main points emerge:
(1) because the assessment of volatile amounts is central, MIs’ representativeness must be fully understood. This demands a large set of MIs for statistical treatment [e.g., Barsanti et al. 2009] as well as Raman characterization of shrinkage bubbles to quantify CO2 loss to the bubble [Venugopal et al. 2020, and references therein]. Recommended practices to follow can be found in Rose-Koga et al. [2021].
(2) The Etna example of this study, based on the Fe-XANES data of Gennaro et al. [2020], shows that empirical iron-oxybarometers, such as the K&C equation (6), compute fO2 decrease, but because magma evolution is about oxygen-based reactions, reactive-species models accounting for melt nature, particularly polymerization, can provide more precise estimates of these variations. In particular, in the case of Etna, the fO2 decrease on melt rise is less important when assessed via the IPA than via the K&C equation. This is because of the role played by water in modulating redox transfers via the melt network and the activity of O2−, [O2−], hence the oxygen electrode. In the specific case of Etna, at FMQ+1 the IPA predicts iron reduction on dehydration for H2O < 2 wt%, but oxidation, or no change within approximation, for dehydration occurring at H2O > 2 wt% (Figure 8). We see that even at constant relative fO2, depending on composition (the water content) dehydration-induced decrease of [O2−] may either favour Fe2+ via reaction (9) or Fe3+ via reaction (7). Interestingly, the experimental Gennaro et al. [2020] data show clearly the threshold between these two mechanisms for H2O-contents around 2.5 wt%. This behavior, which recalls very closely that shown by the Dickenson and Hess [1982] data for increasing K2O in SiO2–Al2O3–Fe2O3–FeO–K2O systems equilibrated on air [see also Cicconi et al. 2020a, Moretti 2021, Moretti and Ottonello 2022], is then partially captured by the IPA at constant FMQ+1. Interestingly, this behavior might imply that for P ≈ 3 kbar (the pressure corresponding to the oxidation–reduction threshold in Figure 6) Etna melts record the change of speciation of trivalent iron reported at around 4 kbar by Moretti and Ottonello [2022] on the basis of completely independent volume-compressibility arguments on volatile-free melts.
(3) For both basalt and andesite, the 1-bar IPA model is definitely the one returning most of the sulfur oxidation at a given FeIII∕Fetot, hence fO2, condition (Figure 3). However, the IPA model is expected to be the one more precisely calibrated at 1 bar, because its accuracy results from the accuracies in reproducing a vast domain of 1-bar solubility data and sulfide–sulfate capacities (reactions (20), (21) and (22)–(27)). On the other hand, all the other models (Ju, NSW, W&C) do not consider the role of pressure, but were calibrated on sulfur oxidation/speciation data from samples quenched from high pressure equilibrium experiments. Therefore, these formulations are not intended to work at 1 bar. This argument can be appreciated if we consider that the Ju and W&C models cannot reproduce the 1-bar S-oxidation state in the SiO2–Na2O join at 1250 °C by Nagashima and Katsura [1973], whereas the IPA model does [Moretti and Ottonello 2005, Moretti 2021, Papale et al. 2022] by accounting for compositional effects, which are exacerbated in a simple silica–alkali binary system [Allanore 2015, Moretti and Neuville 2021, Moretti and Ottonello 2022]. Basically, the IPA and NSW models ((27) and (33), respectively) show largest variations of S6+∕Stot, but for two different reasons: composition for the IPA, temperature for the NSW. On the other side the W&C and Ju equations (30) and (31) are the most “static” models to report S6+∕Stot versus another redox indicator such as fO2 or FeIII∕Fetot: if at a given temperature they each show slight variations from one composition to another, like andesite to basalt in Figure 3f, this is simply because composition plays some role in shifting the fO2 calculated from FeIII∕Fetot via the K&C equation (6).
(4) For H2O–CO2-saturated melts, the pressure and XCO2 behaviors shown in Figures 4a and particularly 4b testify for the strong non-linearities due to composition, especially at high pressure and in the presence of significant amounts of iron, such as in basalts. Whether these non-linearities are in part due to model uncertainties or to the physics of dissolution, it is clear that any model can be improved by implementing the calibration database wherever counterintuitive features are observed.
The exsolution of the gas/fluid mixture is a form of magmatic differentiation that depends on the melt–volatile saturation state (or “volatile mixed-solubility” in some literature), which is related to speciation and hence fO2. Again, the composition of the whole system is the key and at equilibrium it is futile to discriminate “what controls what”. Certainly, the interplay of compositional variables, plus pressure and temperature regimes, makes every volcano unique.
(5) Oxygen, or at least a part of it, should be considered as a fluid mobile component, basically meaning that from depth to surface its amount in the system is not fully pre-determined but may slightly vary: in volcanic degassing studies we tend in fact to picture the magma as essentially a two-phase melt–fluid system. Magma is however a multiphase system that includes many solid solutions (the minerals) and in which all phases dissolve oxygen or are dominated by it. In this context, the two mobile phases, fluid and melt, are highly reactive and exchange with the surrounding rocks and fluids, from mantle though crust, up to the surface. Although the big capacitors of mobile oxygen are FeO and Fe2O3 components, particularly in basalt, in such a scenario pre-determining the amount of oxygen like in some forward models [e.g. Burgisser and Scaillet 2007] may unrealistically constrain fO2, a de facto virtual parameter (because it is about an undetectable species) but with a strong thermodynamic meaning [Ghiorso and Kelemen 1987, Cicconi et al. 2020b, Moretti and Stefansson 2020, Moretti and Neuville 2021]. For these reasons, Moretti and Papale [2004] avoid the oxygen mass balance.
Even though iron is the most used reference element to express the reducing or oxidized conditions of the different envelopes, it is important to remember that magmas are enriched also in other minor multivalent elements, such as Cr, V, Ce, Eu etc. [e.g., Berry et al. 2006, Mallmann et al. 2021, and references therein; Cicconi et al. 2021, and references therein]. In geological melts, these elements are only present at low abundances relative to Fe, so their redox exchange minimally affects the FeIII∕Fetot ratio. However, redox equilibria of these elements are all potential oxybarometers and their characterization and translation of their oxidation state into fO2 [e.g., Fraser 1975, Berry and O’Neill 2004, Karner et al. 2007, Mallmann et al. 2021] can be fundamental to solve melt–fluid speciation issues.
Code availability
The iron-redox code [Ottonello et al. 2001, Moretti 2005] can be accessed from https://github.com/charlesll/iron-magma.
The CTFSFG code [Moretti and Ottonello 2005] can be accessed from https://github.com/charlesll/sulfur-magma.
At these sites, Fortran source codes are available together with instructions to run them and relevant information on licensing and credit to be given.
Conflicts of interest
The author has no conflict of interest to declare.
Acknowledgements
I wish to thank the volume editor, Dr. D. R. Neuville, and two anonymous reviewers who helped improving the quality of the manuscript. This study contributes to the IdEx Université de Paris ANR-18-IDEX-0001.