


 CC-BY 4.0
1. Introduction
Groundwater resources are essential for humanity as well as for nature and are the most important reserve of fresh water on Earth. Groundwater represents an important source of water supply for people and for the development of livelihoods, economic and living conditions around the world. It is thus critically important for sustainable development as it provides water for domestic use, agriculture, industries and other socioeconomic sectors and as well for many ecological services. It is estimated that at global scale, groundwater withdrawals have increased sixfold in the past 60 years [Van der Gun 2012], linked to population growth, industrialization, urbanization and change of diet [De Marsily and Besbes 2017]. Depletion of aquifers1 with important drawdowns of water table occurred in several regions around the world, leading in some cases to irreversible degradation of groundwater chemical quality and to land subsidence [Bierkens and Wada 2019]. Groundwater resources are thus threatened in terms of both quantity and quality, due to anthropogenic pressure and climate changes. Managing them is a great challenge, as groundwater is a distributed and a hidden resource. The resource being limited, aquifers should be utilized collectively and responsibly, requiring a sustainable management approach involving all stakeholders. However, in practice, water tends to be pumped out independently, leading to a chaotic and non-sustainable exploitation. To improve the situation, all stakeholders need to have sufficient knowledge and understanding of processes taking place, from rainfall to recharge, drainage and discharge [De Marsily and Besbes 2017]. Without an inclusive and integrated water resources management of groundwater, socio-political issues may arise and worsen (conflicts of use), specifically in areas where water scarcity is already a burden.
Key groundwater knowledge refers to understanding the basic principles of hydrogeology, namely definition of aquifer and aquitard among the underground layers, spatial heterogeneity of underground reservoir as well as the abstract concept of a groundwater table. As mentioned by [De Marsily 1986], a groundwater table is an abstract concept of the reality of the underground water world. One depicts the spatial representation of a water body with its upper and lower boundaries, and possibly also its side limits. This can be compared to a fog bank.
The perception and understanding of groundwater by stakeholders around the world are diverse, largely because of the regional and cultural dimensions related to the underground. One vision is related directly to springs, natural water holes and wetlands, and their observation across seasons. For example, in Australia, the Rainbow Serpent is a spiritual entity recognized by Aboriginal people and credited with the creation of the Australian landscape. According to a regional study in the Northern Territory with a comparative analysis of hydrogeology map and Aboriginal knowledge, the outline of the major regional aquifer in central Arnhem Land has a rainbow serpent shape. Local people are aware that groundwater inflow supports flow of major rivers during dry season, and that they are living on top of water stored underground [Zaar et al. 2002]. Similarly, in other parts of the world, outflowing water at springs or at artesian free-flowing water wells as in volcanic sedimentary plains in Java Island (Indonesia); water is considered as a gift from the goddess of nature. Putting a valve on these free-flowing water wells can lead to fears among farmers about the possible scarcity of water. Finally, in European countries for example, rather than imaging a water table as a fog bank, as defined by de Marsily, the common image of groundwater is an underground river or even a lake!…The popular imagination about groundwater is definitively not the unique perception shared by all stakeholders, as strong effort has been made by scientists to transfer knowledge (e.g. The Groundwater project2 or several videos on YouTube of sand-boxes).
The explanation of complex hydrogeological processes (from recharge to discharge; from mineralization to contamination) calls for simplification and didactic explanations for non-specialists. Driving principles should be explained with precise key-elements; for instance, the role of vegetation growth and of air temperature on the groundwater recharge or the range of groundwater travel times as it varies over several orders of magnitude.
All knowledge related to hydrogeology principles are usually carried out via static schematization of the reality, most of the time using one cross section to address the vertical dimension of an aquifer. Both spatial and temporal dimensions are difficult to be grasped by non-specialists: stakeholders, water users, farmers or people from industrial and domestic water sectors. With this aim, a conceptual model, which is a schematization of the complex reality of the invisible groundwater world, is used at the scale of a hydrogeological system or catchment unit. However, it often remains static and simplified in 2D. 3D groundwater flow animations are not always available for all studies. Comprehensive full data set to set up such 3D groundwater flow numerical model is necessary. In the perspective of groundwater resource management, 3D groundwater flow, modeling is not realized, and not used as a decision support tool. Occasionally, very simplified sketches or even animation clips are used without being able to transfer accurately hydrogeological processes, at least not anchored in the real local setting. It may even carry an incorrect understanding of the complexity of groundwater systems. The velocity of hydrogeological process is hardly transcribed. Demonstration of sand-tank groundwater models, i.e. physical models, concern one type of hydrogeological setting, porous media generally, and are not applicable for all other aquifer types.
In integrated water resources management and especially in water stewardship actions concerning groundwater, the engagement of actors in a collaborative management is acknowledged to be important. A collective action plan and a strong involvement of a variety of stakeholders are recognized to lead to a more efficient and sustainable management of aquifers. Co-management is a key element within water policies, involving power sharing between water users and government entities, as reported in [Shalsi et al. 2019]. Such a multilateral approach implies mutual learning between water users, policy makers, technical experts on groundwater resources and management, including culture heritage, community values and technical expertise. Stakeholders’ ignorance concerning groundwater resources and the impacts of their various activities, dissociates them from any long-term responsibility [De Marsily and Besbes 2017]. Sharing knowledge and information, even participation to monitoring activities provides a better understanding of the groundwater resources and their hydrodynamics under climatic and anthropic conditions (withdrawals, land use changes, etc.).
Stakeholders may be from various backgrounds; those directly concerned about water uses by their activities (e.g. agriculture under irrigation, industry, water supply) or within organizations (authorities, companies, NGOs); those who will take financial decisions. These stakeholders play a role and have an influence, based on their understanding of water resources issues and solutions. Their interactions and contribution will lead to a more efficient and/or rapid implementation of water resources management. Their involvement in a participatory approach can rely on several methodologies [e.g. Baccar et al. 2021; Etienne et al. 2011], including stakeholder mapping and analysis regarding the issues to be addressed via different solutions—technical ones or policies [e.g. Reed et al. 2009]. Everyone has his own knowledge based on observation, self-monitoring and perception about groundwater. Engaging stakeholders implies exchanges among water users, technical experts, policy makers, and also general managers. For communication of knowledge about groundwater, technical experts use sketches, graphs, maps, and possible outcomes of mathematical modelling, but also translate that knowledge into narratives, in the frame of participatory scenario analysis methods [Rouillard et al. 2022].
From this perspective, Danone Waters looked for a way to combine 3D representations of subsurface of earth and a visualization of groundwater water flow from rainfall to springs. KARSYS is a pragmatic approach for developing 3D conceptual models of groundwater systems in karst regions. It was developed at the Swiss Institute for Speleology and Karst Studies [Ballesteros et al. 2015; Jeannin et al. 2013; Malard 2018] and has been made available online via the Visual KARSYS website. In the frame of the collaboration, new developments have led to addition of a Flow Animation Module (FAM) which could transmit the principles of hydrogeology to stakeholders associated with the groundwater resources management. For a few years now, KARSYS is being applied to hydrogeological systems in volcanic island environments too, highlighting also the ability of this approach to be applied to non-karstic environments. The aim of this development is to represent explicitly the underground processes, which cannot be seen directly and thus require abstract thinking for a non-specialist to imagine these over different time and spatial scales (from mm to km and from a few hours to multiple decades). Sharing such concepts to non-initiated persons is a real challenge but essential to manage water resources.
In this paper, after a brief review about relevant general hydrogeological concepts, we present the main principles of the KARSYS approach. Then, the principles of 3D dynamic visualization are sketched, as well as the way FAM was included within Visual KARSYS. Finally, the implementation to a case study in East Java, in a volcanic hydrogeological setting, is presented.
2. Material and method
2.1. Hydrogeological conceptual model—short review
A conceptual model in hydrogeology is a qualitative and schematic (i.e., simplified) description of an existing hydrosystem based on characteristics and processes (hydraulics, gravity, permeability, etc.) as defined by [Anderson and Woessner 1992] or [Ghasemizadeh et al. 2012]. Conceptual models may be generic (focusing on processes and related to well-defined contexts: coastal aquifers, alluvial, hypogenic, etc.) or site-specific (focusing on site characteristics, with possible high-frequency monitoring on a demo site [Cooper et al. 2018]). They can be static (steady state only) or dynamic if they address different water stages (i.e., low-flow, high-flow, drought, etc.).
Theoretically, conceptual models are seen as a prerequisite for the construction and analysis of numerical models [Betancur et al. 2012], as they allow to point out the main characteristics and processes which must be computed in order to reproduce the expected dynamics (i.e., recharge, effects of pumping, intrusion of salted water, etc.). In parallel, numerical models are expected to support and to confirm the conceptual model with a more quantitative approach (Figure 1).
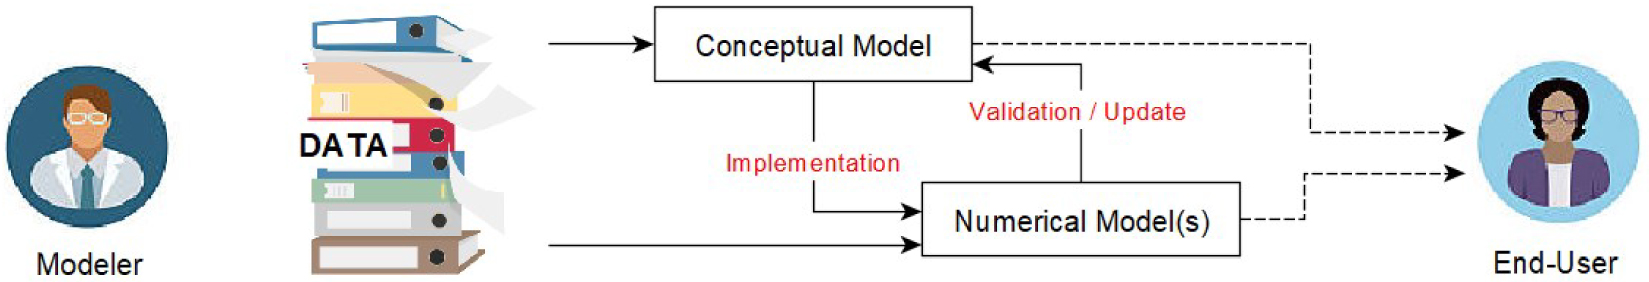
The modeling workflow assumes the explicit conceptual model to be built before implementing numerical models. These two models can be presented to the end-user for a better understanding of the characteristics and processes taking place in the hydrosystem.
In practice, the building of the conceptual model prior to the design of a numerical model often remains implicit. The modeler usually keeps the qualitative and schematic description of the studied hydrosystem in mind. The results of the numerical model are then presented as the explicit representation of the hydrosystem, making it difficult to understand the main characteristics and processes (recharge, evapotranspiration (ET), transfer in the unsaturated zone, etc.), to validate them and use them critically. By presenting numerical results in which some of the characteristics and processes remain implicit, the modeler cannot be guaranteed that the end-user has properly perceived the message (the interpretations), and that he will be able to use them for decision making.
In order to better communicate the concepts, processes and results, we can build an explicit conceptual model in which principles are spatially presented, according to data of the studied site. This can be presented prior to any numerical models or results of simulations to address the basic questions: “where are the main recharge zones”, “where does the groundwater flow through?”, “where could I drill to intersect the water table?”, etc. It also provides an detailed image which is the same for all stakeholders, at least concerning (i) the geometry of the aquifer, (ii) the way groundwater flows and (iii) the way it is recharged. Such an unified representation enables easier understanding and further management strategies. Concepts and processes can be validated at any time by simulations.
2.2. “KARSYS” and “Visual KARSYS”
KARSYS [Jeannin et al. 2013] is a pragmatic approach developed for geologists and hydrogeologists (i.e., “modelers”) to build an explicit conceptual representation of groundwater flow systems in heterogeneous rocks via a 3D geological modeling and a series of principles (i.e., algorithms). An interesting aspect of this approach is to provide guidelines for a step-by-step construction of conceptual models (i.e., the representation of the modeler’s understanding of the groundwater flow system), following a well-defined approach (defined data and principles), and in a detailed and easy to understand way (a 3D model which can be viewed by anyone). Although KARSYS was first developed for karst aquifers, most of the principles can be applied to other heterogeneous aquifers (volcanic, highly fractured, glacial, etc.).
Visual KARSYS is a webtool developed for users to apply the steps of KARSYS by themselves to their site of interest. It offers a database to capture and to format all required data, a 3D viewer and different tools that allow the construction of complex geological models (including faults, erosion phases, etc.) and the extrapolation of the supposed saturated zones in the permeable layers. Another advantage of the webtool is that outputs from Visual KARSYS (data, information, models and maps) can be directly shared between users for being consulted or edited.
A dedicated output page (Figure 2) has been developed for the end-users to access the KARSYS conceptual model and all associated data. From this page, end-users can extract information from anywhere in the modelled area by generating geological or hydrogeological cross-sections or maps or expected logs of virtual drillholes. They can also export data and results to use them in other applications.
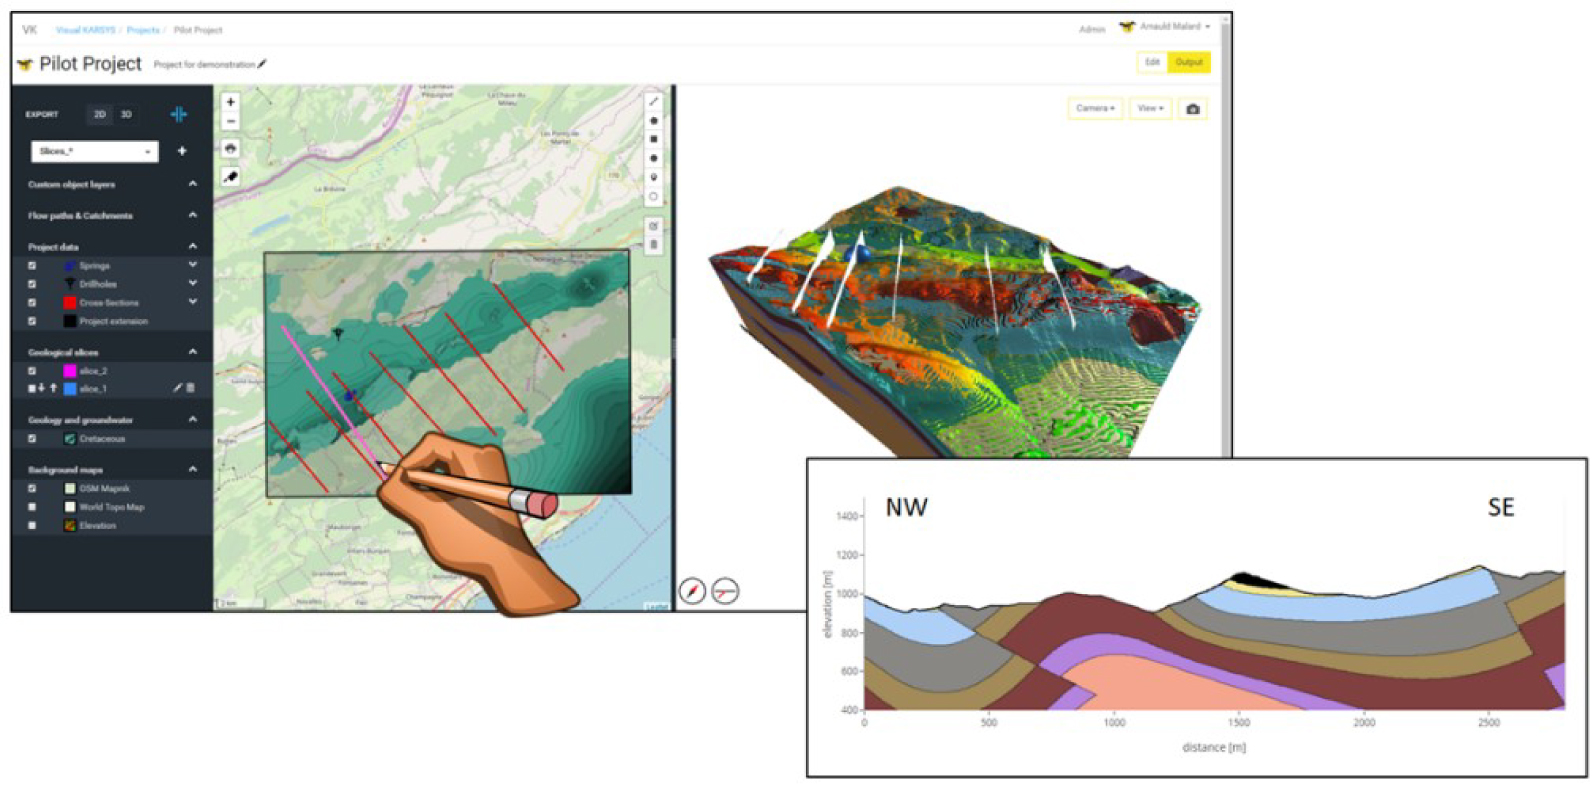
Overview of the output page. End users can display geological layers on the map or create geological cross-sections or logs for any virtual drillholes.
Visual KARSYS not only supports the development of conceptual models for stakeholders (end-users) but also for scientists from geosciences (i) to frame the relevant issues, define outcomes and manage complexity, as a common starting point [Jakeman et al. 2016] and (ii) to improve conceptual models, to test the role of different structures within the groundwater flow path before carrying out a numerical modeling.
2.2.1. 3D groundwater (GW) conceptual model development
Four basic steps are required for building a KARSYS model. Prior to these steps, users are expected to define the boundaries of the project area, the coordinates system and to enter a series of required data and information in a specific order (geological cross-sections, maps, drillholes, etc.). In step (1), users are required to define the geological units which form the geological framework and to assign hydrogeological roles (pervious vs. impervious, type of permeability, etc.) as well as hydraulic properties (basically porosity and hydraulic conductivity of pervious units, with the exception of the karstified units). Step (2) is dedicated to the building of the 3D geological model by using GmLib [Lopez et al. 2018], a specific library which allows the implicit modelling of geological data in 3D. Step (3) allows the user to infer the location and the geometry of the main groundwater zones based on hydrological evidences (location of springs, water-head measurements in drillholes, etc.) and a series of principles based on the extrapolation of the hydraulic gradients. In step (4), users can sketch the main expected drainage axes in the aquifer and delineate the boundaries of the catchment area. This last step is completed by FAM which allows a more dynamic visualization, from rain to the aquifer outlets (basically the springs).
2.2.2. 3D dynamic conceptual model development
Till the end of 2020, Visual KARSYS merely allowed the user to build “static” conceptual models, basically for low-flow stages. By early 2021, in the frame of a joint project between Danone Waters, SISKA and i4ds, new developments were made in Visual KARSYS in order to allow the users to build a more “dynamic” visualization of the groundwater and surface flow in 3D (FAM). This module is designed for karst, volcanic and other highly heterogeneous aquifers. The aim of the FAM is to depict visually, the way surface water and groundwater flows through the hydrosystem via the following processes: the runoff, the allogenic vs. autogenic recharge, the infiltration through the unsaturated zone, the flow paths in the saturated zone, the overflow from the springs, the effects of drillholes pumping, etc.
In the FAM, users can create different recharge scenarios for different timescales: starting from 30 days, 10 years, to more than 200 years and run the corresponding animation in order to visualize processes taking place at the selected timescale and for the different range of permeabilities. FAM is coded in JavaScript and runs in real time for 120 s. When running, the FAM allows the visualization of the following processes for the selected timescale (Table 1).
List of the timescale scenarios available in the FAM and their associated processes
| Groundwater processes | Timescale |
|---|---|
| ∙ Partition between ET/runoff/infiltration ∙ Fast recharge/discharge ∙ GW fluctuations visible via glowing effect, and hydrograph ∙ Fast flow (high permeable units, K > 10−3 m/s) |
Few days event Duration: 30 days Timestep: 6 hours |
| ∙ Seasonal GW recharge ∙ Seasonal variations of ET ∙ Moderate flow (mid-permeable units, 10−3 > K > 10−6 m/s) |
Few seasons Duration: 10 years Timestep: 1 month |
| ∙ GW residence time ∙ Mineralization and mixing processes ∙ Slow flow (low permeable units, K < 10−6 m/s) |
Few decades Duration: 240 years Timestep: 2 years |
Generated particles of rainfall are emitted following the provided rainfall time-series: X mm of rain over one timestep corresponds to 60X particles emitted from the clouds. The evapotranspiration (ET) is generated once particles of rainfall hit the ground surface (Figure 3). When reaching the top of the ground surface, the probability that a particle turns into ET is based on the ET rate for the simulated period (month), modulo, a random variable (#Check 1). The remaining particles are partitioned to runoff particles or to recharge particles depending on the hydraulic conductivity (K) of the geological unit (#Check 2). Runoff particles flow downwards following the steepest slope of the relief. When moving to another place (3D voxel), particles might have the probability to again infiltrate or flow further down as runoff depending on K.
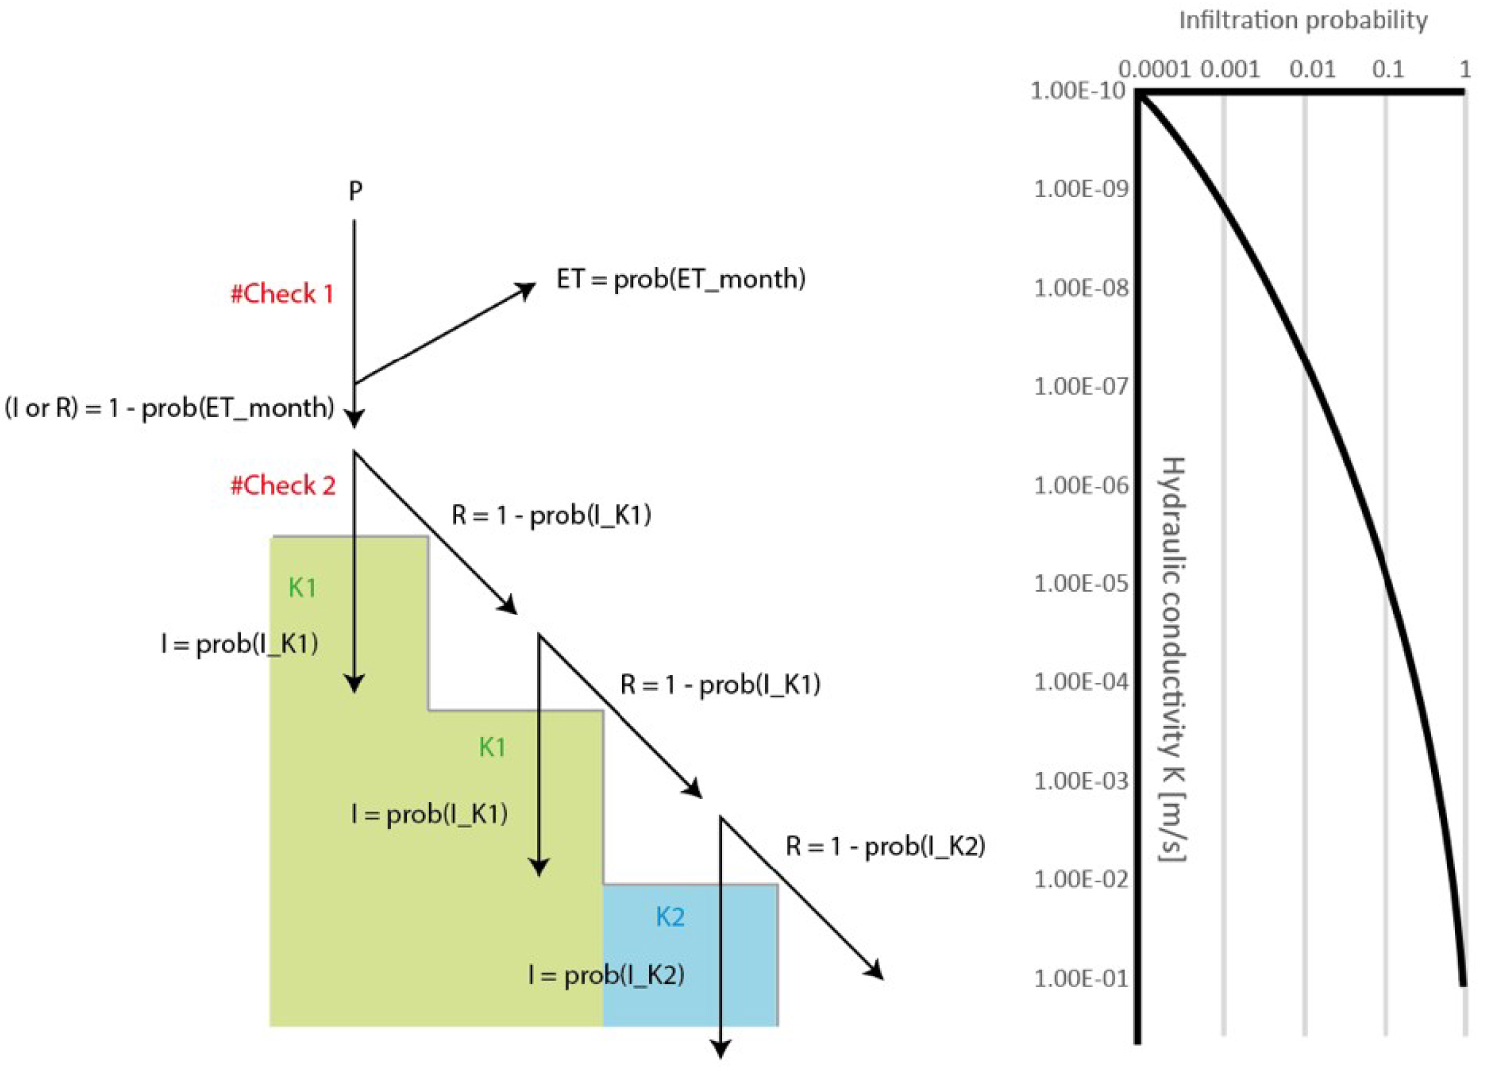
Left: The partition of the falling rain (P) between evapotranspiration (ET), runoff (R) and infiltration (I) is controlled by two independent checks. #Check 1 applies at the first collision with the ground surface. Particles are converted to ET depending on a randomness probability value based on the ET monthly rate. #Check 2 applies on each collision with the ground surface. Right: Depending on a randomness probability value based on the hydraulic conductivity (K), the particle will infiltrate or will turn to runoff. Masquer
Left: The partition of the falling rain (P) between evapotranspiration (ET), runoff (R) and infiltration (I) is controlled by two independent checks. #Check 1 applies at the first collision with the ground surface. Particles are converted to ET depending ... Lire la suite
Infiltrated particles (I) flow vertically through permeable units until reaching: (i) the aquifer basement or (ii) the saturated zone. The velocity of particles is a function of the aquifer’s zonation (unsaturated, saturated) and of the hydraulic conductivity of the geological unit (K).
In the unsaturated zone, the vertical velocity of the particles (v) is in the form: v = K ⋅ B where B is a constant parameter depending on the timescale.
In the phreatic zone, a predefined flow field is generated based on the geometry of the saturated zone and on the location of the springs. This will govern the trajectory of the particles towards the spring(s). The velocity of the particles is controlled by K and by an empirical factor based on the relative significance of the different outlets draining the saturated zone (F). The equation is expressed as: v = C ⋅ Kx ⋅ Fy where C, x and y are constant parameters.
An example of animation for a few-days event with a located rainfall is given in Figure 4.
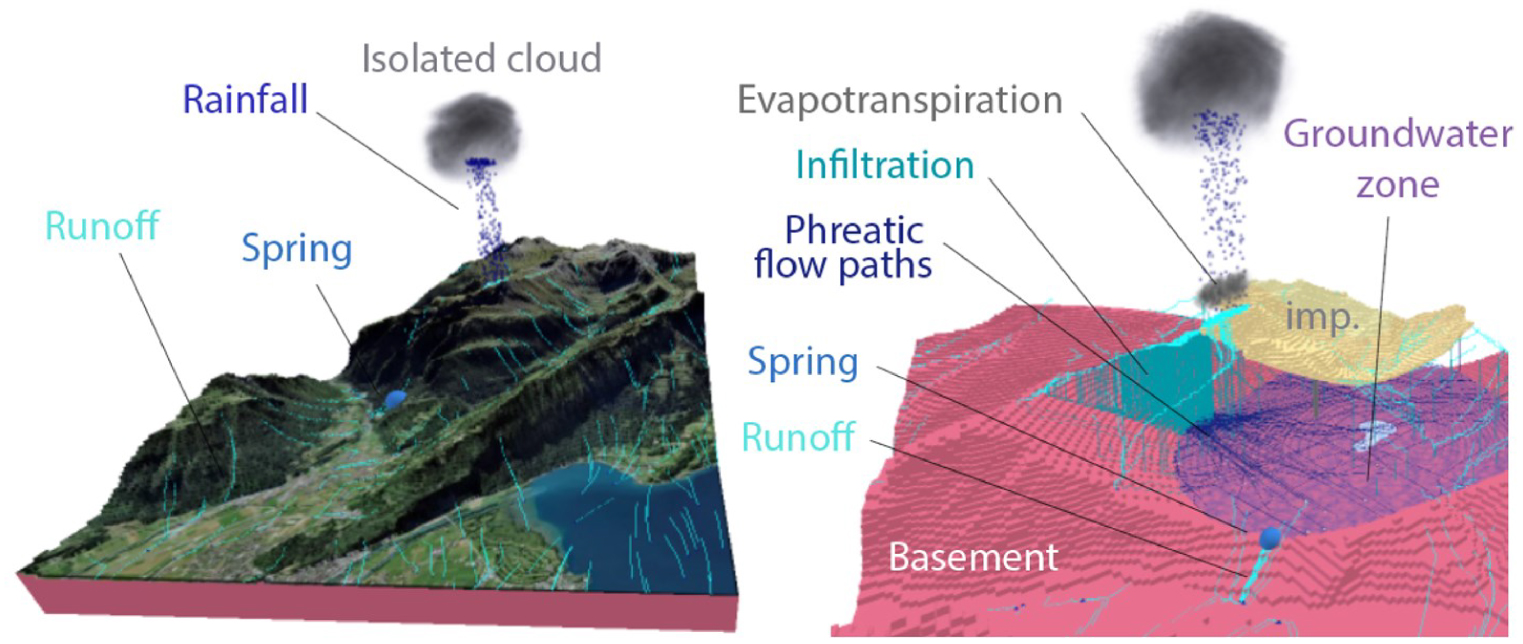
Overview of a short-term animation depicting the expected surface and groundwater flow paths for a rain isolated event at the top of the volcano. Left: surface processes (rainfall, runoff). Right: underground processes (the aquifer layers have been disabled for making the flow lines visible, “imp.” refers to the impervious cover). It is possible to track the trajectory of the infiltrated particles from the surface to the spring and back to the surface downstream the spring.
Location of the clouds and variations of the rain intensity (P) in time can be parametrized. The ET is computed and represented as small clouds (or fumaroles) rising up from the ground surface. The amount of ET is adjustable at monthly time-step. P minus ET generates runoff (R) on impervious rocks and recharge or infiltration (I) on permeable rocks depending on K. R is represented as moving dark blue particles leaving light blue lines behind. The lines clearly illustrate the merging of flow paths forming streams and rivers at ground surface. Recharge particles are white and flow vertically downwards through the unsaturated zone leaving dark blue vertical lines behind. Particles follow the basement of the aquifer until reaching the saturated zone where they flow towards the spring and return to surface runoff. A glowing effect indicates the groundwater body inflating and deflating according to the input/output balance of the particles entering/leaving the saturated zone. This particle tracking produces a clear idea of the various flow conditions and velocities taking place at ground-surface and in the underground.
Additional tools allow users to take full advantage of the results of the animation. They can hide the 3D model along selected directions and orientations in order to create sliced views and to focus on particular places without the view being disturbed by the complexity of the model. A live graphic of the expected hydrological regime for a saturated zone or a spring (i.e., recharge minus discharge) can also be displayed to provide a pseudo-quantitative estimate of the groundwater flow. At the end of the animation, the cumulated rainfall and the respective partition between ET, R and I are given (in mm per unit of time and the total amount over the simulation period).
3. 3D Application of dynamic conceptual model of Pasuaran
3.1. Test site of Pasuaran
The 3D GW dynamic conceptual model under KARSYS is applied to the case study of Pasuaran, East Java, Indonesia. The study area is a large one of about 560 km2 (20 km along EW and 28 km along NS) and covers the northern flank of the Bromo-Tengger volcano, the Monte Bromo being the highest point (2470 m). It encompasses the highest caldera, Tengger caldera, and the coastal plain. The high discharges of groundwater flow, both springs and from free-flowing wells in the plain, are located on this side of the volcano, and therefore of high hydrogeological interest as well for water resources management. The 3D geological model has been built according to information and data found in the following documents [Abidin et al. 2004; Toulier et al. 2019; Tugas Akhir 2019].
From a geological point of view, the Bromo-Tengger mountain is a complex andesitic stratovolcano. It began to grow about 1.4 million years ago. Over time, numerous eruptions produced sequences of lava flows accumulation and subordinate pyroclastic deposits, all of them constituting the framework of this composite volcano [Thouret 1999 in Toulier et al. 2019]. The volcano is incised by steep slopes canyons on the flank due to erosion. The Pasuruan north plain, as a peripheral zone of the volcano, is constituted by quaternary volcano-sedimentary deposits. Their thickness is more than 300 m as reported by [Mazzini et al. 2018]. The volcano-sedimentary series comprise a large variety of typical facies, from proximal (lava flows, pyroclastic falls and flows, lahars) to distal sequences (volcano-sedimentary deposits with higher content of clay). A fine clayey sediments layer of about 10 m thickness forms the top of these series in the northern plain [Toulier et al. 2019].
From a hydrogeological point of view, according to [Toulier et al. 2019], the volcano system is composed of 6 hydrogeological units, from the caldera to the volcano-sedimentary plain: (i) the central zone forms a sand sea caldera, with dark sand of high porosity, probably hosting an unconfined aquifer (ii) the proximal zone of the edifice with several hundred meters of pyroclastics, overlying lava flow complex, with high porosity and permeability, (iii) the median zone with non-weathered lava flow complex, a huge unit that can be considered as homogeneous as a whole, with few low discharges at the inter lava flows locations (perched and local aquifers), (iv) distal zone with slope deposits characterized by a low permeability due to their clayey content, and (v) the volcano-sedimentary plain, with a confined multi-layers aquifer, as the main hydrogeological feature providing groundwater at the artesian springs (Umbulan spring namely, the largest with a discharge of 3250 L⋅s−1 and Banyu Biru, 200 L⋅s−1) and free flowing wells. [Toulier et al. 2019] inventoried 460 artesian wells in the plain, with an average discharge of 4.1 L⋅s−1 each. Considering the density of wells (∼6 wells km-2) and the area of the plain, it was estimated that 20% of wells were out of the survey. A maximum of 600 wells is then estimated, with a total of 2400 L⋅s−1. Hydro-climatological data from a monitoring network considering the altitudinal gradient are available in [Toulier 2019].
There is a groundwater resource management issue in the Pasuruan Plain. The Umbulan spring discharge is decreasing. The monitoring of the spring since 2007 confirms the decreasing trend in discharge. If oral testimonies report a discharge of about 5000 L⋅s−1 in the 1980s, the discharge in 2007 was around 4000 L⋅s−1. Nowadays it is about 3250 L⋅s−1. In 2021, the Umbulan spring was utilized for the water supply of Surabaya city located nearby, the second largest town in Java Island. An uncontrolled groundwater use through free-flowing wells in the plains for paddy fields—rice cultivation—reduces the groundwater level, and consequently impacts the lowland pressure-driven artesian springs, e.g., Umbulan spring [Khasanah et al. 2021]. The pressure on the groundwater resource is getting higher, with potential tensions between water users. The decrease of the groundwater level already led to the increased need of pumps in the wells and social conflicts may arise due to the possible unaffordable cost of such equipment for some local farmers.
3.2. Building of the KARSYS conceptual model
Geological units have been simplified and grouped to improve the readability of the model (Table 2). The building principles follow the chronology of the main lava (and pyroclastic deposits) flow events and are based on the followings: (i) Each new lava flow is channeled into existing valleys and overflows from the topography into downstream areas (fans-like morphology), (ii) Pyroclastic flows are deposited in stratum around the places of emission, (iii) Between two distinct episodes of flows, deep valleys could potentially have been incised and (iv) Deep valleys do not incise below the sea level. The resulting geological and hydrogeological 3D models are presented in Figure 5.
Hydraulic characteristics of the 6 hydrogeological units of the Pasuruan model
| Modeled geological units (Visual KARSYS) | Hydraulic conductivity (K) |
|---|---|
Sand sea caldera  |
Highly permeable unit, 1 × 10⁻² m/s |
Ashes and pyroclastic fan deposits  |
Low permeable unit, 1 × 10⁻⁶ m/s |
Pyroclastic deposits  |
Low permeable unit, 1 × 10⁻⁵ m/s |
Basalts, andesites  |
High permeable unit, 1 × 10⁻³ m/s |
Volcano sedimentary plain  |
High permeable unit, 1 × 10⁻³ m/s |
Old weathered volcanic deposits (Basement)  |
Non-permeable unit |
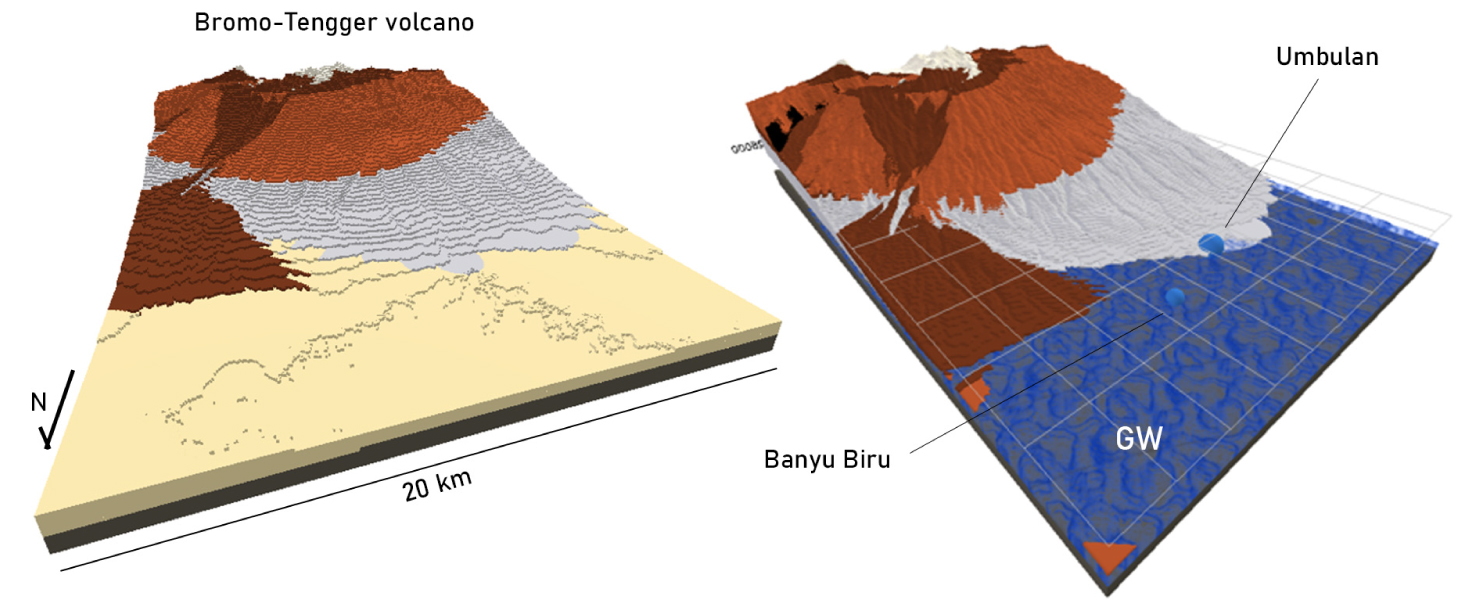
Left: Geological 3D model of the Pasuruan test site. Dark-brown formations refer to ashes and pyroclastic fall deposits, light-brown formations refer to pyroclastic deposits, grey formations refer to basalt/andesite lava flows, light-yellow formations refer to plain sediments. Right: Hydrogeological 3D model with visualization of springs (blue spheres) and groundwater bodies (“GW”) under the impervious overlying layer in the plain (the light-yellow layer is removed).
The KARSYS model shows that a large groundwater zone develops in the volcano-sedimentary plain and extends upstream in the different lava flow units. In the volcano-sedimentary plain, the groundwater zone is confined below successive layers of low pervious ashes. In the upstream part of the groundwater zone, most of the groundwater is supposed to be drained by the springs while in the downstream part it directly discharges into the sea.
3.3. Scenarios visualization
Two animation scenarios are set: (i) a short-event of rain and (ii) a long period of recharge over several decades in order to point out specific processes that take place for these contrasted timescales. The short-term animation figures out the dynamics of the surface processes (runoff and evapotranspiration) and of the groundwater in the mid to high permeable units (i.e., K > 10−3 m/s) while the long-term animation makes it possible to show the dynamic of the groundwater in the low permeable units (i.e., K < 10−6 m/s) and the progressive mineralization of the particles according to the time they spend in the different aquifers. Results are displayed as pictures but it should be kept in mind that the results are displayed in a 3D animated scene where water particles are computed live.
3.3.1. Short rain event
A 30-day rainfall series with a 6-hour timestep (i.e., 120 values) has been created to reproduce a tropical rain event in wet season (Figure 6). Clouds (i.e., the place where the water is emitted as rain) are located in the upstream part of the area at an elevation of 4000 m asl above the upper flanks of the Bromo-Tengger volcano. In January, the cumulated rainfall is considered as 219 mm and ET as about 20% of the raw precipitation.
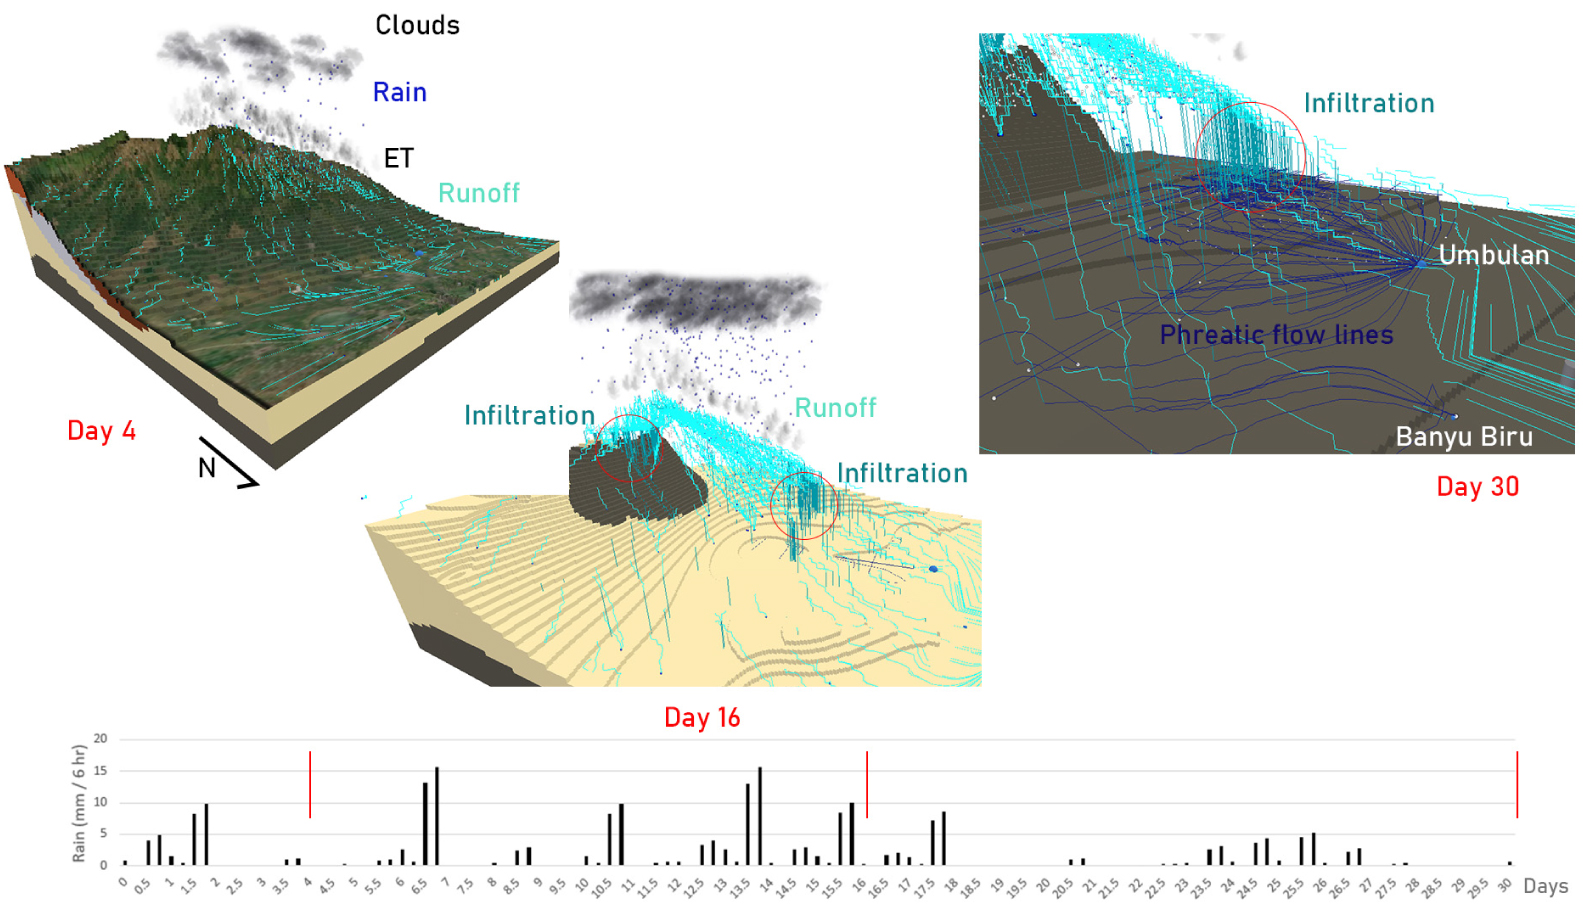
Three selected stages (day 4, 16 and 30) of the 30-day event animation applied to the Pasuruan test site.
At day 4, after a first rain event, most of the particles flow as runoff over the top of the pyroclastic units with moderate permeability. The infiltration is limited. At day 16, we can see that most of the infiltration takes place within the ravine beds at the point of contact with the more permeable basalts (K = 10−3 m/s) or in the caldera which is composed of permeable sands (K > 10−2 m/s). At day 30, we can see that the infiltration still occurs in the basalts and no significant amount of water flow through the pyroclastic units. The water reaches the saturated zone and forms phreatic flow-lines that converge in the direction of the springs. As expected because of the location of the cloud, most of the phreatic flow lines go to Umbulan which displays a higher regime than Banyu Biru (about a factor 10 which is reliable with the proportion of displayed lines). At the end of the animation, the computed ET is about 67 mm, the infiltrated water 36 mm and the runoff 116 mm. Because of the relative low permeability of the pyroclastics, 50% of the water is drained as runoff, the infiltration being about 16% in this particular case.
3.3.2. Long term
A 240-year series with a 2-year timestep has been created to reproduce the groundwater flow over the long term, especially in the low permeable units (pyroclastics and fan deposits). The cumulated rainfall over 2 years is about 2580 mm (i.e., 1290 mm/year) and the clouds extend over the whole area. Overviews of the animation results are given in Figure 7.
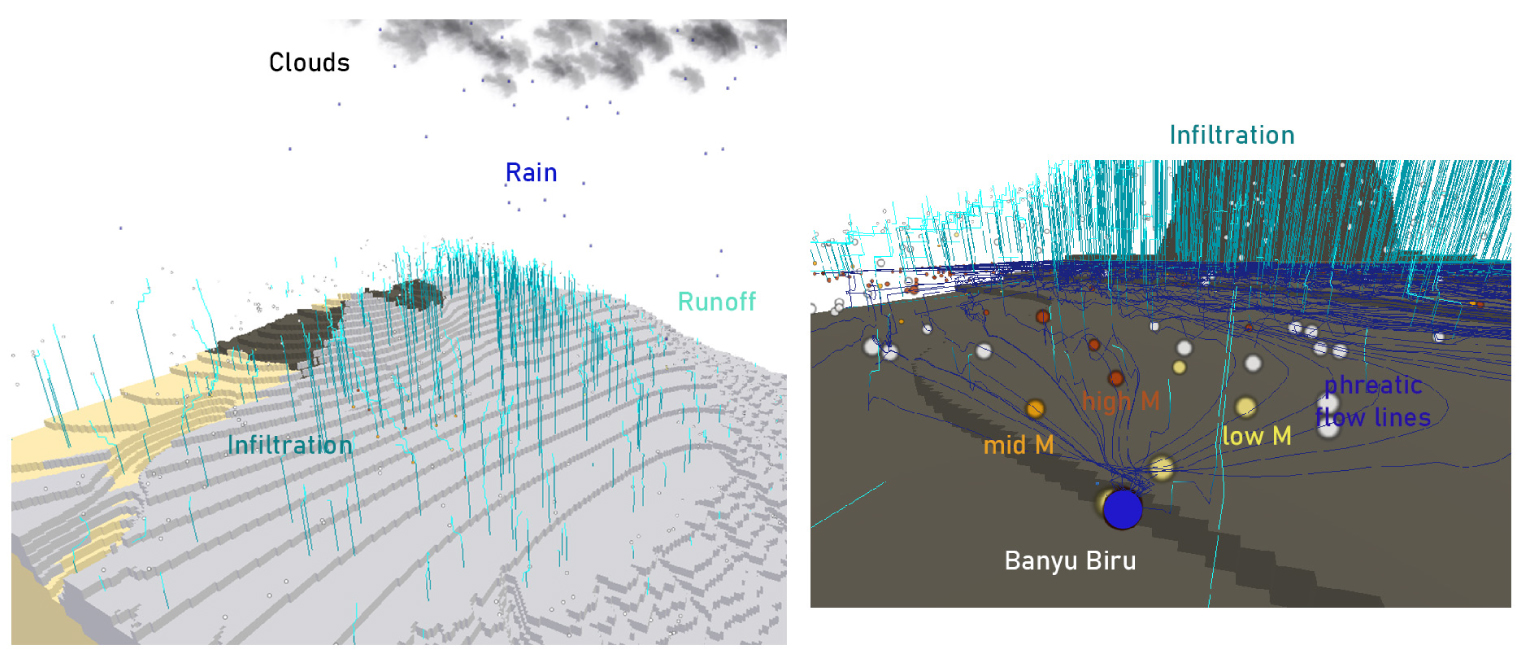
Overview of a long-term event animation applied to the Pasuruan test site. “low M”, “mid M” and “high M” respectively refer to low-mineralized, mid-mineralized and high-mineralized particles.
After a few years, we can see the infiltration through the low permeable pyroclastic units which was not visible for the short-term animation. In the groundwater zone, the color of the particles allows to distinguish the low-mineralized water (i.e., the “freshwater”), the mid-mineralized one and the highly mineralized one as well as the mixing processes taking place upstream of the springs, resulting in mixed mineralized water at the springs. High-mineralized water refers to particles which have a longer transit time in the aquifer (at least >2/3 of the total duration of the animation). This applied, for instance, to particles which first infiltrate through the low-permeable ashes and pyroclastic fan deposits (K = 10−6 m/s) and finally reaches the basalts where they mix with freshly infiltrated particles. At the end of the animation, the cumulated rainfall is about, 310,000 mm, the ET 129,000 mm (41%), the runoff and infiltration 181,000 mm (59%).
4. Discussion
Different questions may arise by reading the previous sections. First of all, we can think about the usefulness of such a tool, including FAM. This could be seen as a “nice to have” or a gadget in the sense that this type of dynamic 3D conceptual model remains a fairly qualitative model (even if it can provide pseudo-quantitative results) which is usually based on a few data and a series of assumptions and principles. This is exactly the expected goal of Visual KARSYS and it does not intend to replace numerical models which provide more quantitative and physically based results. The spirit of such a tool is to really offer the possibility for a modeler (geologist, hydrogeologist) to explicitly describe the hydrosystem as all parameters and information are modeled (i) in 3D and (ii) over a period of time and to present preliminary interpretations regarding main characteristics and processes (groundwater resources, flow, recharge, etc.) even to non-specialists. The development of the FAM has raised many questions about how to represent explicitly, the hydrogeological processes, especially with timescales (short recharge events, seasonal variations, long-term trends) and permeability issues, which make it virtually impossible to represent the dynamics of these processes in a single model. This implies that if all these multiscale processes cannot be visualized altogether, they are difficult to communicate—and even impossible without dynamic conceptual models to address these issues. The FAM offers the possibility to get an idea of the main characteristics and process dynamics of the studied hydrosystem within a few minutes and requires a limited effort to be built compared to numerical models which may require weeks for setup and calibration. When working on site with limited data and information, such an approach may be more efficient than building a sophisticated numerical model which cannot be properly parameterized.
The second question may be related to the reliability of this type of explicit conceptual model. Indeed, the implementation and the calibration of these models are usually based on (i) a few “hard” data (observed geological outcrops, drillholes, caves and mines survey, etc.), (ii) a few “already interpreted data” as geological maps, cross-sections, interpretation of geophysical data, etc., (iii) a series of geological and hydraulic principles (lateral continuity, thickness conservation, gradients, etc.) and (iv) the knowledge or the experience of the modeler to describe the “reality” of the invisible underground environment. In this context, the tool is usually not the limiting factor for interpretation, but rather the available data and the quality of the information on the site of interest. Introducing and combining as much data and information as available in an explicit conceptual model also allows for direct discussion of the density and reliability of the data and thus the uncertainties of the model, which is less often possible with numerical models.
5. Conclusion
This paper intends to introduce the usefulness of a dynamic modeling and visualization tool (Visual KARSYS and the FAM) which allow modelers (geoscientists) to build specific conceptual models of the studied hydrosystem (i) in 3D to show the main characteristics and (ii) in time to visualize the hydrogeological processes taking place in the aquifer. This tool is developed for the modelers to specifically describe the hydrosystem on which they work prior to design and implement numerical models in which most of the site characteristics and processes might remain implied. It is also useful for non-specialists (stakeholders, water authorities, etc.) to communicate the main characteristics of the aquifer and hydrogeological processes or to answer pragmatic questions which remain qualitative (via an interactive 3D viewer, video-clips, etc.). Such models do not intend to replace numerical ones which provide more quantitative results. However, they can and should be used as a basis for interpretation and discussion before undertaking numerical modeling work.
We expect increased general use of detailed and specific conceptual models to support and improve the management of the groundwater resources in a more integrated approach (tapping strategies, protection policies, conflicts of use, etc.). Past and current applications to different sites in different countries (Switzerland, France, Spain, Slovenia, etc.) demonstrate the interest of the end users in this type of representation and support for their groundwater management activities.
Visual KARSYS and the FAM are still work in progress and evolving. New developments are possible according to needs and funding. Any inputs for improvement are welcome too.
Conflicts of interest
Authors have no conflict of interest to declare.
Acknowledgements
The Visual KARSYS project is supported by the Swiss Federal Office for Environment via two grants for the promotion of environmental technology: UTF 537.13.16 (2016–2019) and UTF 647.26.20 (2020–2021). The flow animation module has been supported by Danone Waters, in the frame of a contract with ISSKA in 2021.
The authors thank the three reviewers for their relevant comments and suggestions that allow to improve the general quality of the paper.
More information about Visual KARSYS on Twitter: @Visual_KARSYS
1 In this paper, the term “aquifer” refers to both unsaturated and saturated zones of the permeable rocks (European definition).
2 On Line platform for Groundwater Knowledge (https://gw-project.org).