


 CC-BY 4.0
1. Introduction
Population growth leading to increased agricultural production [de Marsily 2008, 2020] and demand for drinking water [He et al. 2021] combined with climate change and variability poses a real threat to the availability of water resources worldwide and in Africa in particular [UN-WWDR 2021, Sylla et al. 2018, for West Africa]. Despite major disparities related to differences in physical environments and the climatic mosaic of the continent, the decline of a quality water resource is a reality and a threat in the most vulnerable arid to sub-humid areas, where more than 40% of the population lives.
West Africa is one of the regions most affected by climate variability and change. During the 20th century, the West African region experienced a succession of wet and dry periods marked by significant rainfall deficits of varying intensity depending on the sub-region, particularly since the 1970s [Nicholson 1978, Servat et al. 1997, Paturel et al. 1997, 2002, Lebel and Ali 2009, De Longueville et al. 2016, Nicholson et al. 2018]. There is a contrasting response of hydrological systems to this variability in rainfall between the Sahel region (annual rainfall < 700 mm) and the Sudanian region (annual rainfall > 700 mm) [Descroix et al. 2009, Nka et al. 2015]. In the Sahel region, an increase in runoff in most small and medium-sized watersheds is noted [Albergel 1987, Descroix et al. 2009, Amogu et al. 2010]. In the Sudanian region, there has been a clearly greater decrease in runoff than in rainfall [Mahé 2009, Descroix et al. 2015]. The increase in runoff in the Sahelian zone is linked to a change in land use that has also caused an increase in the water table in endoreic basins such as those in southwest Niger [Leduc et al. 2001, Favreau et al. 2009]. In the Sudanian area, the significant decrease in river discharge is related to a decline in base flow caused by the drop in the water table [Mahé 2009, Tirogo et al. 2016].
However, in West Africa, little is known about the response of groundwater to climate-induced variations. Studies that have addressed this issue have shown that the relationships between precipitation and water table recharge are complex to determine because they are highly variable in space and dependent on several factors [Tirogo et al. 2016, Cuthbert et al. 2019, Ascott et al. 2020]. These factors include anthropogenic influence (dam construction, changes in land use, increased water withdrawals) and natural factors such as the surface water drainage network as well as the spatial distribution of hydraulic properties and geometry of the aquifer. In addition to this variability in the evolution of the water table, there is also uncertainty in the estimation of the future climate of the area [e.g., Monerie et al. 2020]. In a context where the demand for water continues to grow, groundwater resources, which are of paramount importance for water supply to populations, socio-economic activities and vital ecosystems [Calow and MacDonald 2009, USAID 2014], warrant better control for sustainable management.
In the present study, we focus on the groundwater resource of the Kou basin (1860 km2) in the western sedimentary basin of Burkina Faso. This groundwater is a major socio-economic asset, at the origin of important springs such as those of Nasso/Guinguette (three main springs), which have an exceptional discharge compared to that of the region (≈1.5 m3/s for the Guinguette spring during the low-flow period in 2011). The groundwater resource is used for irrigation, but also by various industries and for the supply of drinking water to many communities, including the country’s second largest city, Bobo-Dioulasso. Water needs at the basin level are constantly increasing while the groundwater level is dropping (ca. 0.5 m between 1990 and 2015) as is the discharge rate of springs. Through geochemical and isotopic analyses, Dakouré [2003] and Huneau et al. [2011] showed there is a predominance of ancient waters in the southeast part of the much larger Taoudeni sedimentary basin with a low renewal rate. In a more recent geochemical study, Kouanda [2019] nevertheless reported on the existence of significant ongoing recharge in the same area. In this context where the water table is influenced by the rainfall variability and by strong demand, the question arises as to what would be the cause of the decline in the discharge of springs. Analysis of the response of the water table to climatic variations based on groundwater level records has proved to be limited by the spatial heterogeneity of its behaviour and the factors that influence it [Tirogo et al. 2016]. Therefore, hydrogeological modelling was recommended to study the behaviour of the water table with respect to climate and to pumping. In this area, several hydrogeological models run in steady state [Sogreah Ingénierie 1994, Dakouré 2003, Derouane 2008, Sauret 2008] and aimed at understanding the hydrodynamic functioning of the aquifer system have not provided answers to the question.
Here, we propose to study the behaviour of the aquifer system using a hydrogeological model in both steady and transient states. Indeed, the response of aquifers to various demands is a dynamic and spatially variable process that can be effectively analysed by modelling [e.g., Bredehoeft 2002, Dong et al. 2012, Condonet al. 2021]. Transient modelling enable the simulation of temporal and spatial variations in water table [Howard and Griffith 2009] and hence the study of its behaviour in response to past or future climate change and anthropogenic activities [e.g., Scibek and Allen 2006, Knowling et al. 2015, de Graaf et al. 2019]. The analysis of the combined impact of pumping and climate provides a better appraisal of groundwater dynamics subject to temporal trends (rainfall and pumping variability) in a context of spatial heterogeneity (drainage, aquifer geometry, hydrodynamic parameter distribution, etc.). In this article, we first present the hydrological, geological and hydrogeological framework of the study area, with particular emphasis on the discharges of the hydrosystem, at springs and as a result of withdrawals (Section 2). The results of the hydrogeological modelling, the development of which is described in Section 3, are presented in three main parts, namely, the calculation of the input data of the model, the calibration of the model in steady and transient states, and the evaluation of the impact of climate change and pumping (Section 4), before they are discussed (Section 5).
2. Study area
2.1. General information
The study area covers approximately 3600 km2 in southwest Burkina Faso between longitudes 4°00′ W and 4°49′ W and latitudes 10°56′ N and 11°31′ N (Figure 1). The Kou hydrological basin (1860 km2) is located in the administrative area of the Hauts-Bassins region and is home to the country’s second largest city, Bobo-Dioulasso [904,920 inhabitants according to the results of the Fifth General Census of Population and Housing in 2019, i.e. approximately 92% of the population is urban in the Kou basin, INSD 2022]. It is in a Sudanian zone (800–1200 mm annual rainfall) characterized by two alternating seasons (dry season from November to April and rainy season from May to October). The average annual rainfall recorded between 1961 and 2014 at the Bobo-Dioulasso rainfall station is approximately 1025 mm and the monthly average temperatures range between 25 °C and 31 °C during the same period. Monthly potential evapotranspiration is highest in March (202 mm) and lowest in August (116 mm) [Tirogo et al. 2016].
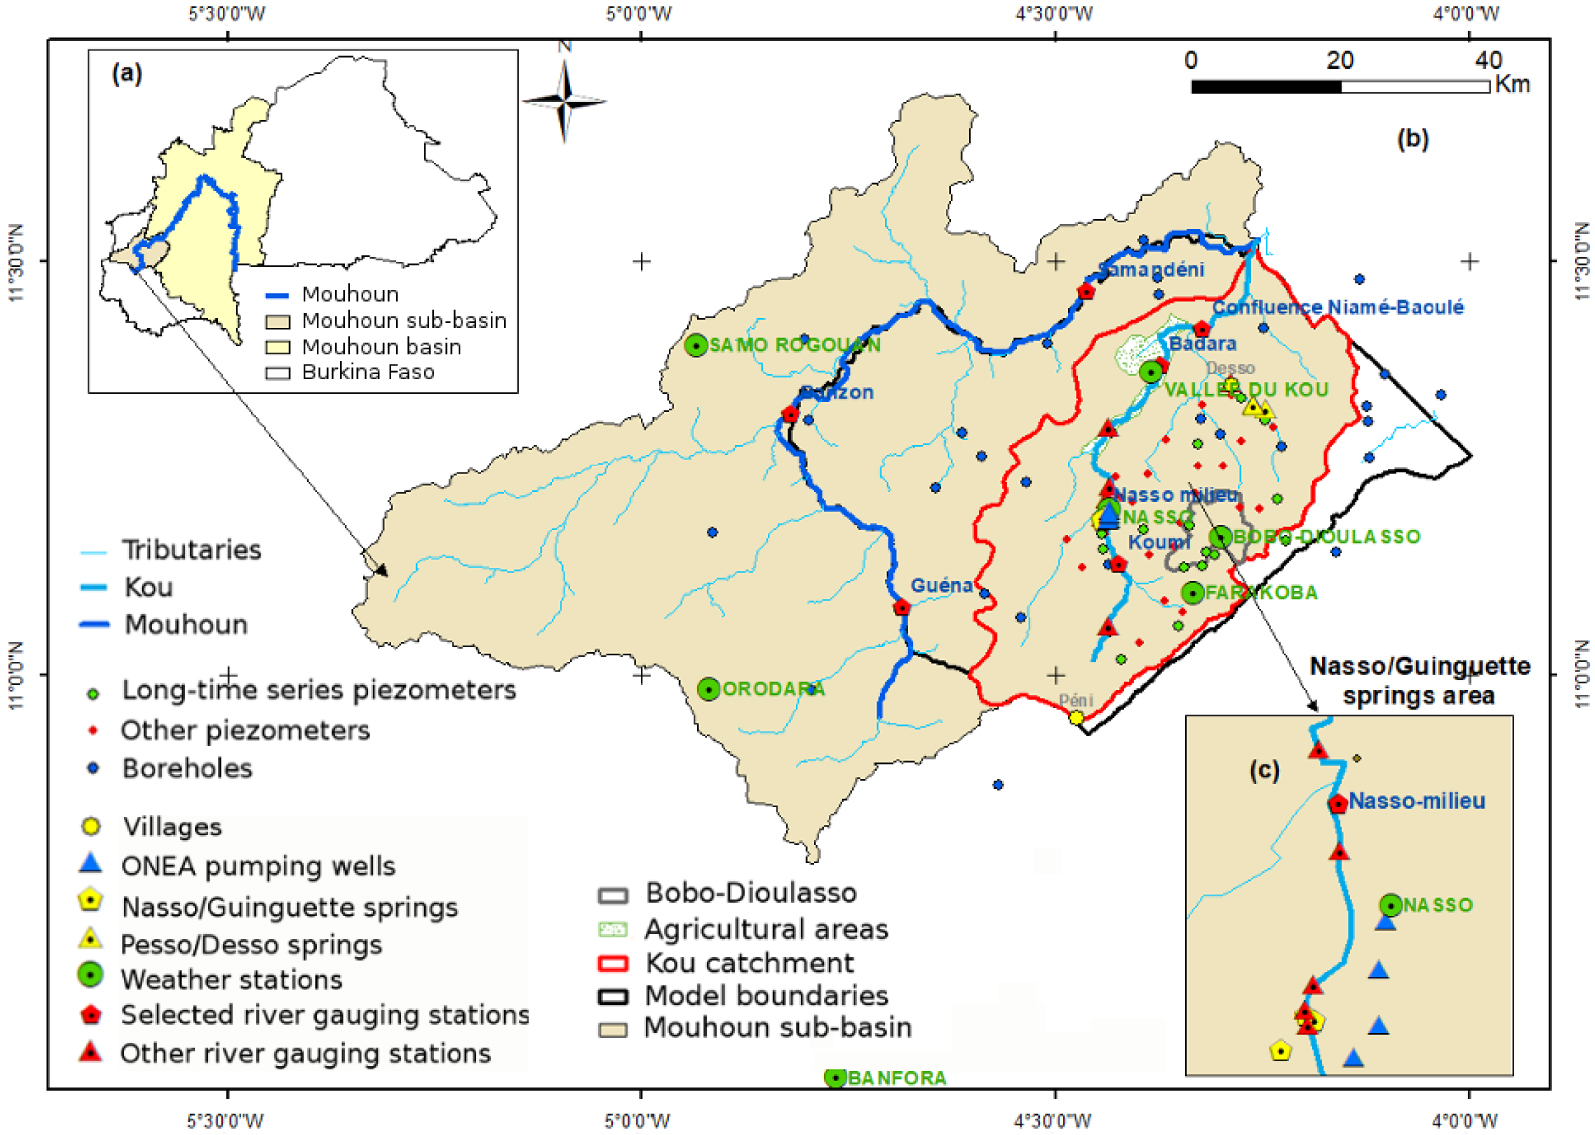
(a) Study area location in Burkina Faso; (b) study area description and measurement stations (river, meteorology, and piezometers); (c) Nasso/Guinguette springs area.
The Kou basin is home to an important groundwater resource that is the source of exceptional springs at the scale of the West African region. This resource is of primary socio-economic importance for Burkina Faso, in particular for the city of Bobo-Dioulasso and its surroundings. It is used for irrigation, industrial activities, and for drinking water supply. Water needs at the basin level are growing at the same rate as the population (growth rate of 3.1% per year) and as the development of irrigated agriculture (total irrigated area nearly 2000 ha in 2014). From about 2300 m3/day in 1960, the total amount of water withdrawn at the scale of the basin has increased to more than 75,000 m3/day in 2014 [Tirogo 2016].
2.2. Hydrology
The Kou basin contains the perennial Kou River, its tributaries, and the Nasso/Guinguette springs. The Kou River (ca. 70 km long) is the first major right-bank tributary of the Mouhoun River, formerly the Black Volta [Moniod et al. 1977]. The source of the river is in the locality of Péni at an altitude of approximately 500 masl. The Kou River is fed by several springs, the most important of which are the Nasso/Guinguette and Pesso/Desso springs (Figure 1). The springs constitute most of the base flow of the Kou River (about 2.1 m3/s of 2.5 m3/s between 1992 and 1997) and contribute to the downstream supply of important hydro-agricultural developments, notably the irrigated areas of the Kou Valley. The main tributaries of the Kou River are mostly temporary streams. At the confluence with the Kou River (286 masl altitude), the Mouhoun is approximately 147 km long and drains a watershed of 6647 km2. The average flow of the Kou (at the confluence of Niamé-Baoulé) and of the Mouhoun (at Samendéni) over a common period from 1985 to 1994 was 3.9 m3/s and 14.9 m3/s, respectively (Figure 2).
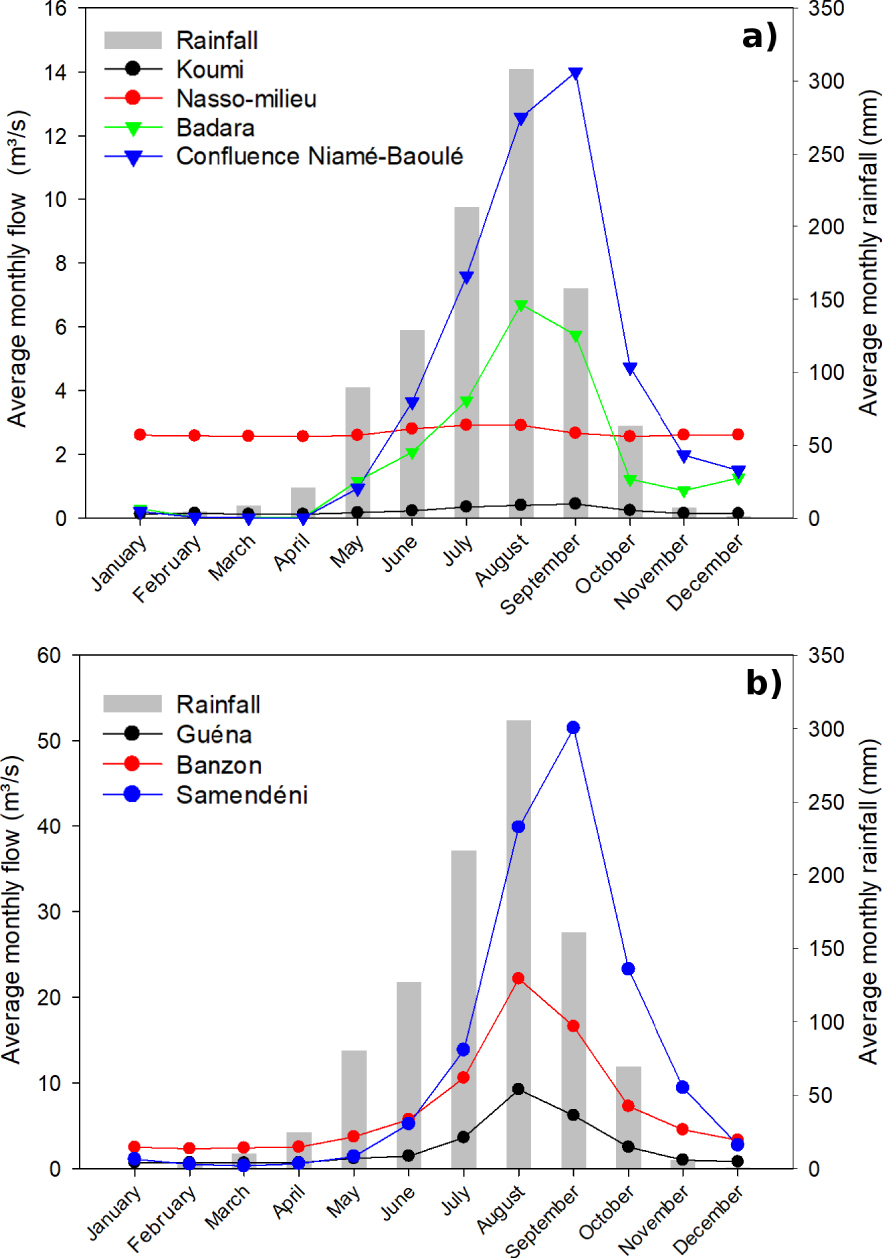
Average monthly flow of the Kou (a) and Mouhoun (b) rivers from 1985 to 1994 and average monthly rainfall of Kou and Mouhoun catchments during the same period.
2.3. Geology and hydrogeology
The study area is part of the southeastern edge of the Taoudeni sedimentary basin (Figure 3a) [Trompette 1973, Bronner et al. 1980]. This Burkinabe part of the Taoudeni basin (45,000 km2) consists of nine sandstone-dominated formations [Ouédraogo 1983, 2006] with a monoclinal structure and a slight dip of 2° to the NW (Figure 4). It is limited to the east by the contact with the basement rocks (Figure 3b). From a hydrogeological point of view, the limits of the Kou watershed do not correspond to those of its hydrological basin. Indeed, based on the potentiometric surface map of the whole area, lateral groundwater flows would come from upstream of the basin and continue downstream to the Gondo Depression [Dakouré 2003, Derouane 2008, ANTEA 2012].
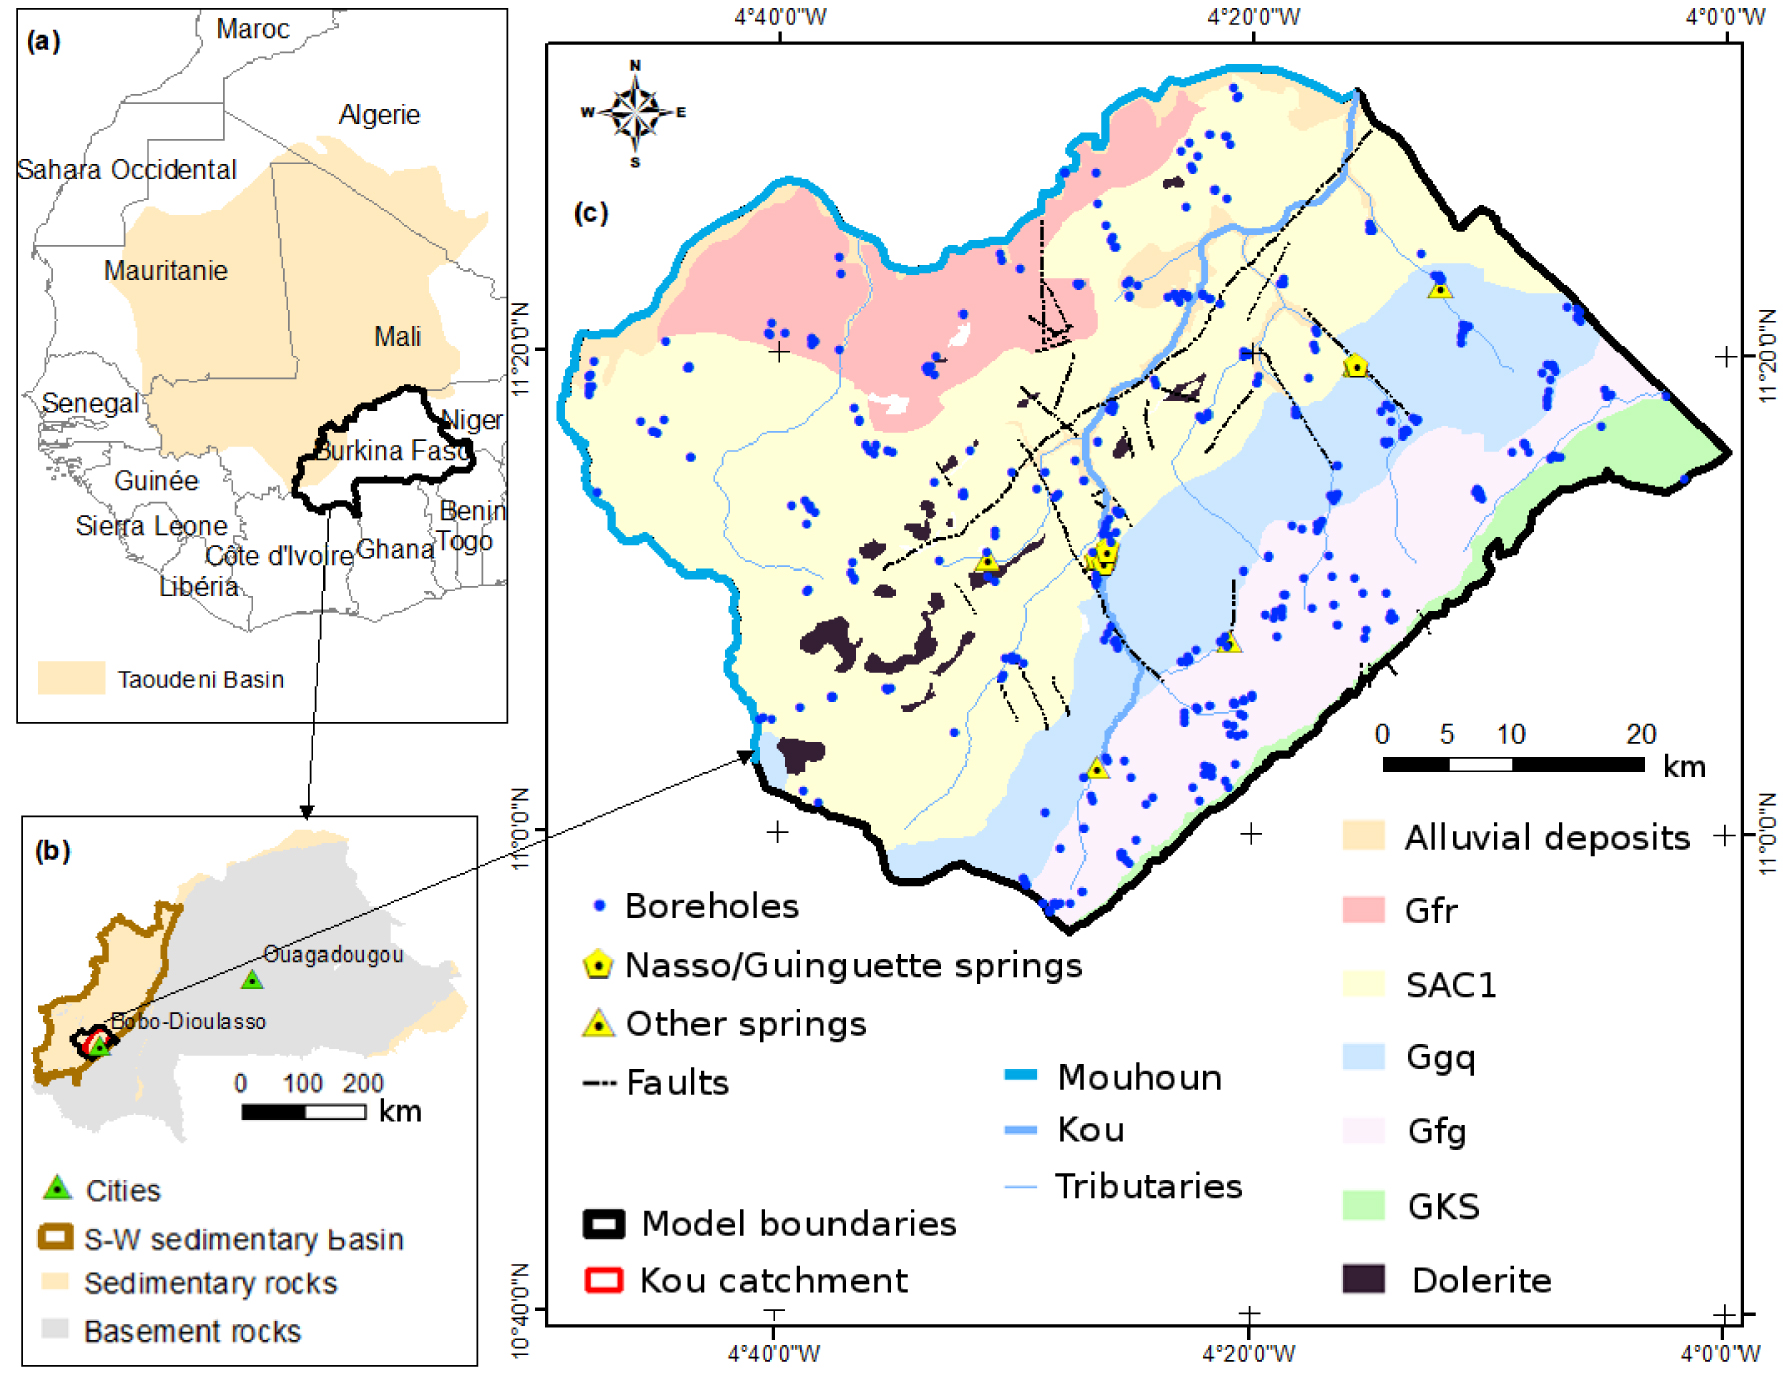
Study area description: (a) location of the Taoudeni basin, (b) boundaries of the Western Burkinabe sedimentary basin, (c) geology of the study area described in Section 2.3 (in particular with regard to the short names of the outcropping geological formations).
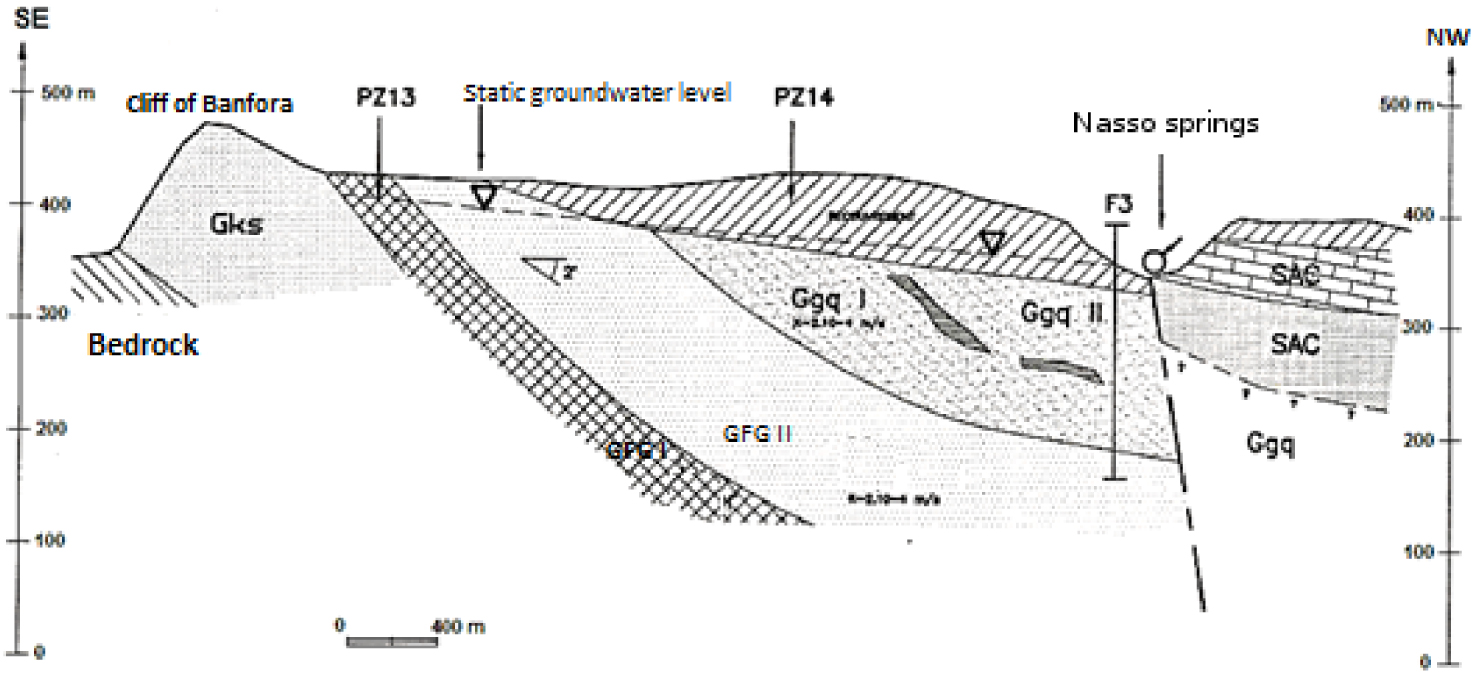
Synthetic geological section of the Bobo-Dioulasso area [from Sogreah Ingénierie 1994]. Hydrogeological units are referred to by their abbreviated names (see Section 2.3).
The Kou basin has five outcrop formations, predominantly sandstone of terminal Precambrian (Infracambrian), with a total thickness that could reach 2000 m deep in its western part. These formations constitute its main aquifers separated locally by discontinuous layers of mudstone that make them locally confined (Figure 3c). From the oldest to the most recent level, it is made up of: Kawara-Sindou sandstone aquifer (GKS), glauconitic fine sandstone aquifer (Gfg), quartz granular sandstone aquifer (Ggq), Guéna-Sourkoudinga silty clay and carbonate aquifer (SAC1), and pink fine sandstone aquifer (Gfr). The GKS multi-layered aquifer is made of sandstone. The upper part of the Gfg aquifer is very productive while the lower clayey part is not very permeable and more or less sandstone-like. The Ggq aquifer is made up of two confined aquifers (lower Ggq and upper Ggq) separated by a layer of fine, highly consolidated sandstone. The base of the SAC1 aquifer consists of sandstone and the top consists of dolomitic limestone and clay. The Gfr aquifer, less known than the first four aquifers, contains a thin and shallow water table [Sogreah Ingénierie 1994, Gombert 1998]. All along the Kou River, the aforementioned formations are covered by alluvial deposits whose lateral extension is estimated at 350–750 m on each side of the river. Consisting of clay, sandy-clay, and altered sandstone deposits, from a few metres to nearly 40 m thick, the alluvial plain functions as a capacitive reservoir [Sauret 2013].
Thus, from the basement to the base of the SAC1, sandstone layers overlap over approximately 1000 m [Gombert 1998], only separated by discontinuous layers of mudstone at the base of the Gfg in the eastern edge of the basin, which makes the GKS locally confined. Within the SAC1, the presence of thick layers of locally impermeable claystone suggests a compartmentalization of this aquifer. Also, dolerites outcrop abundantly at the western and northern ends of the Kou basin and occur as roughly concordant sills, dykes (veins), and necks [Sogreah Ingénierie 1994, Gombert 1998]. Their presence in the study area could also constitute real screens impermeable to groundwater flow. However, their vertical and even horizontal extension remains poorly known. At the scale of the study area, according to the current state of knowledge, the existing data are insufficient to define the extension of these heterogeneities as well as their role in the functioning of the aquifer system.
In general, the outcrop formations are fractured. There are several major faults, generally oriented SSE–NNW, which promote the circulation of water at depth and create important hydraulic connections between the different aquifers [Sogreah Ingénierie 1994]. These are also areas favourable to the recharge of the water table and to the ascent of deep and older waters [Huneau et al. 2011]. They are considered to be the main causes of resurgence of water from the Nasso/Guinguette springs [e.g., Talbaoui 2009, Figure 4].
2.4. Discharge of the aquifer system by springs
The aquifer system is drained by numerous springs. Apart from the Nasso/Guinguette springs already mentioned, there are about 30 other springs in the area with discharge varying between 1 m3/h and 500 m3/h according to a survey conducted in 1996. From this inventory to today, some of these springs have dried up and others have experienced a significant decrease in their discharge rates. Unfortunately, there is no recent inventory of all the springs with measurements of discharge. Only the Guinguette spring allows us to appreciate the evolution of the discharge over the long term thanks to sporadic measurements of the discharge rate realized between 1959 and 2011 [Sogreah Ingénierie 1994, Sauret 2013]. The discharge rate has decreased by approximately 1 m3/s in 50 years, from ca. 2.4 m3/s in 1959 to ca. 1.6 m3/s in 2011 (Figure 5), with low seasonal variation (less than 15% of the average annual flow in 1992). The two springs of Nasso, operated by the National Office of Water and Sanitation (ONEA), whose discharge was estimated at approximately 0.5 m3/s in 1993 [Sogreah Ingénierie 1994], could not supply more than 0.33 m3/s in 2012. Apart from the two Nasso springs, which are used to supply drinking water to the city of Bobo-Dioulasso, most of the other springs, including the Guinguette, discharge into the river system where the water is used for irrigation in the downstream part of the basin.
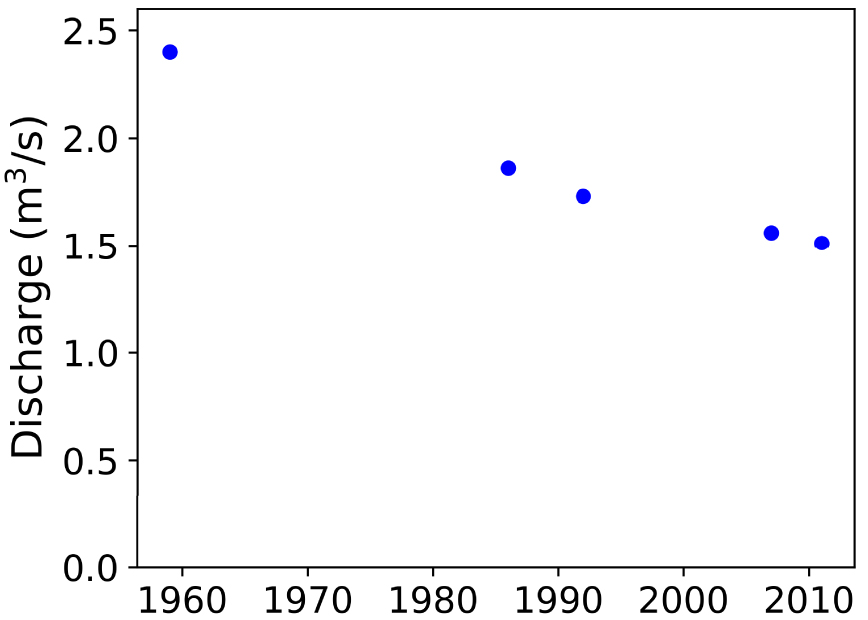
Evolution of the low-flow discharge rate of the Guinguette spring between 1959 and 2011.
2.5. Discharge of the aquifer system by withdrawals
The groundwater resources of the Kou watershed are exploited by many users (water supply, industry, agriculture). As stated in Section 2.1, water withdrawals have increased since the first drilling in the 1950s. Indeed, at that time, water abstractions were made only from springs and from a few traditional wells [Palausi 1957].
ONEA’s pumping system for supplying drinking water to urban areas including the city of Bobo-Dioulasso is the most important and best monitored. The quantities of water withdrawn by ONEA have evolved from ca. 2300 m3/day in 1956 [Palausi 1957] to ca. 40,000 m3/day in 2014 (Figure 6) [Tirogo 2016]. Between 2000 and 2014, ONEA’s set-up evolved with the construction of two boreholes of approximately 250 m3/h each in 2000, followed by two others of 250 m3/h in 2014, all located within a radius of less than 2 km. Their depths vary between 200 and 300 m. In rural areas, drinking water is drawn from shallower boreholes (generally between 40 and 80 m) with flow rates varying between 0.5 m3/h and 20 m3/h. Most of them are equipped with manual pumps. The number of boreholes has grown since the first one in 1976 to a total of 346 in 2014. The withdrawals in 2014 were evaluated at approximately 10,000 m3/day to the nearest 20%, based on well flow rates and estimated pumping hours per day [Tirogo 2016]. In addition, there are agricultural withdrawals, mainly located in the alluvial plain downstream of the Kou basin, estimated at approximately 22,900 m3/day in 2011 during the irrigation period (November–April) [Sauret 2013]. Groundwater is used by many industries located in the Bobo-Dioulasso area, whose withdrawals are ca. 2500 m3/day according to an estimate made in 2014 [Tirogo 2016].
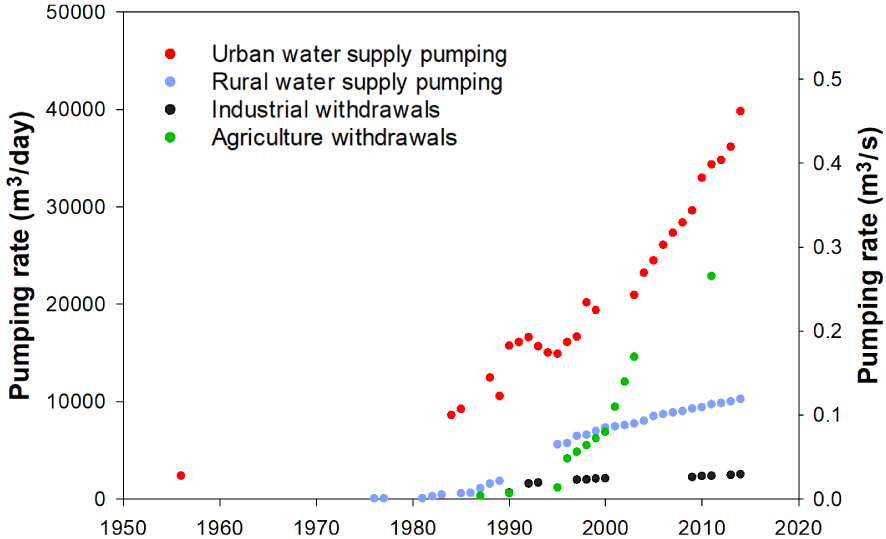
Evolution of total drinking water production for the city of Bobo-Dioulasso (from springs and boreholes), rural drinking water supply withdrawals, as well as industrial and agricultural withdrawals.
In 2014, total pumping by all users was approximately 75,000 m3/day on average. Taking into account seasonal variations, the total volume withdrawn for the year 2014 was estimated to be approximately 84,000 m3/day in the dry season (low-flow periods) and approximately 44,000 m3/day in the rainy season (high flow periods).
3. Materials and methods
3.1. Numerical code
The code chosen for the modelling is Modflow-2005 [Harbaugh 2005], with its Visual Modflow© interface. Modflow-2005 solves the groundwater flow equation using the finite difference method for both confined and unconfined aquifers.
3.2. Geological model and discretization
The geological model is built in three dimensions considering the five aquifers. The basement on which the GKS aquifer rests is considered as the lower impermeable boundary of the domain. The top of the aquifer system is the topographic surface, based on 30 m SRTM data. The geometry of the multi-layered aquifer system was developed using data from six geological sections [Ouédraogo 2006, Derouane 2008] and about 60 borehole logs, with depths not exceeding 300 m. Beyond this depth, the vertical position of contacts between deep horizons was extrapolated from the observed average dip. The total thickness of the modelled domain is 1050 m in its deepest part to the NW of the basin where it is distributed as follows: 350 m of GKS, 150 m of Gfg, 200 m of Ggq, 250 m of SAC1, and 100 m of Gfr (Figure 7b).
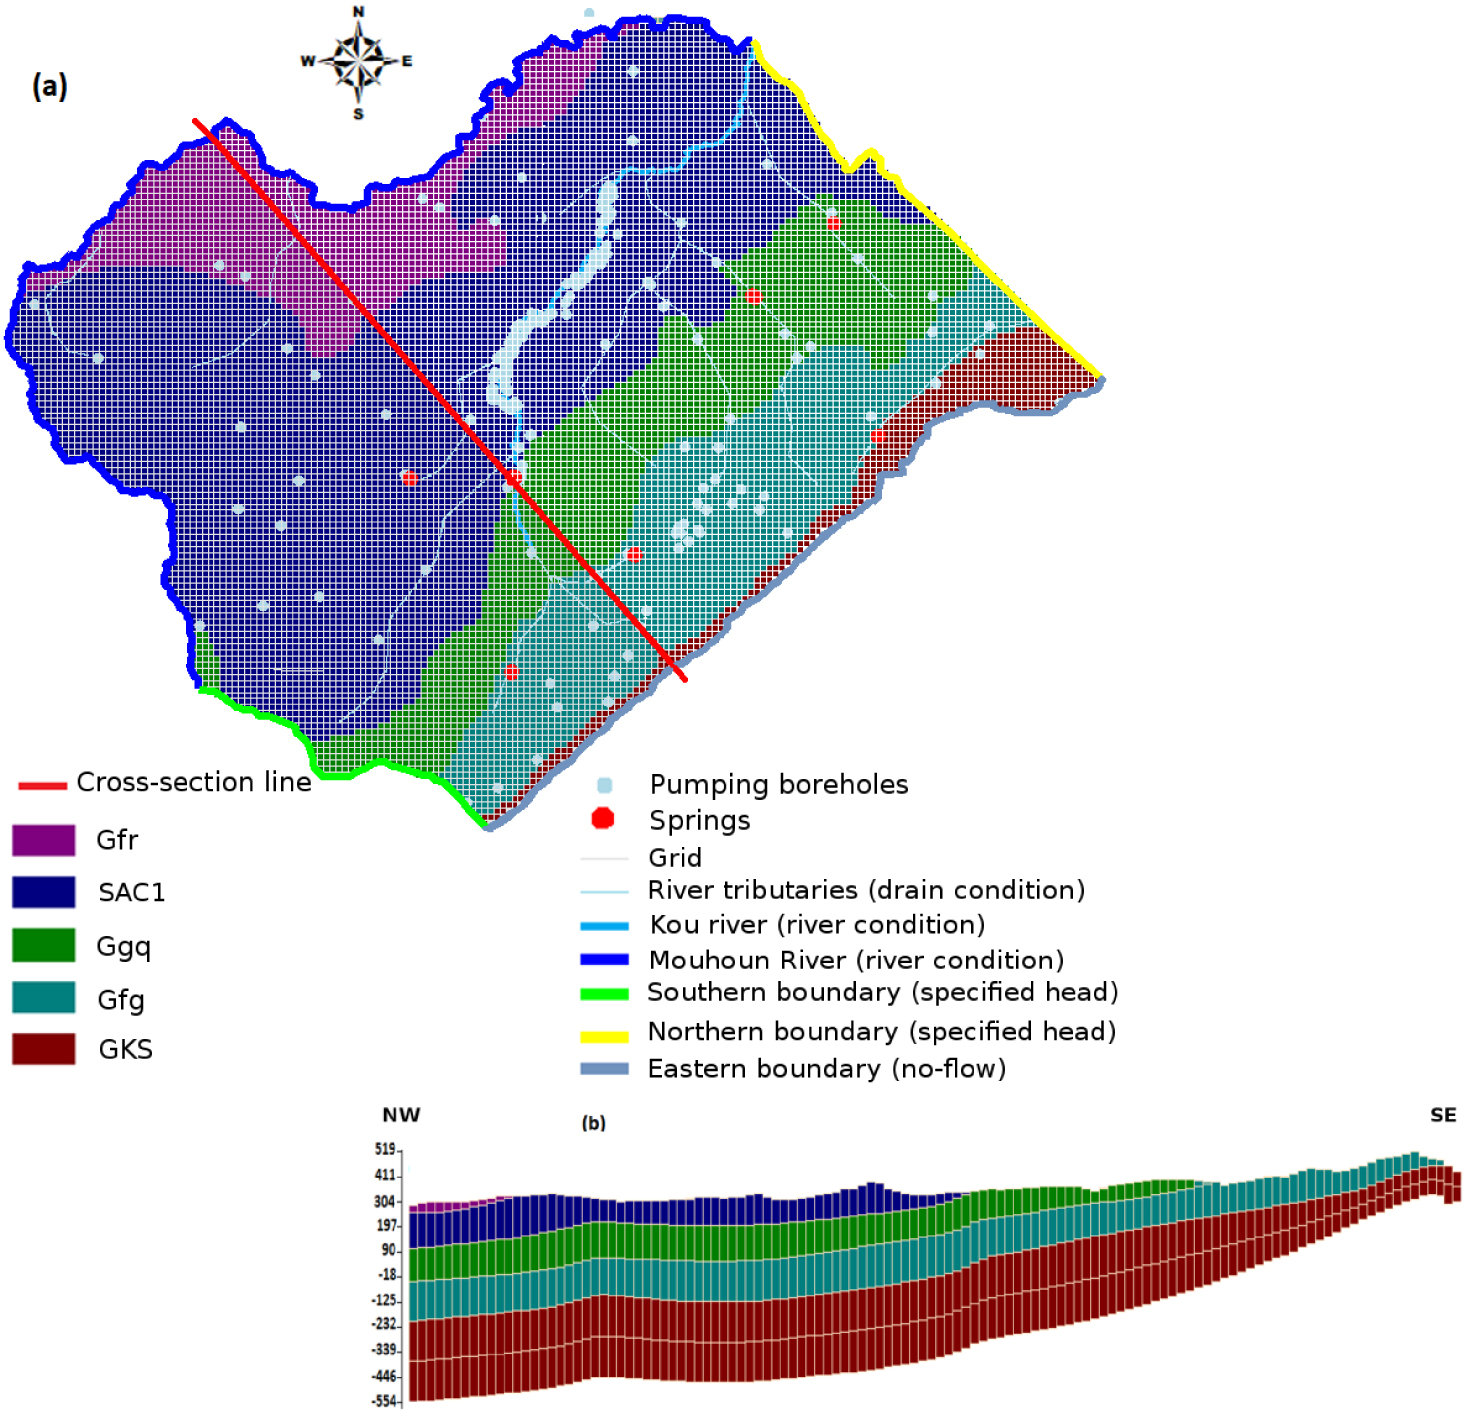
Numerical model: (a) geological map with main springs, pumping boreholes, rivers, and drains, south, north, and east boundaries; (b) SE–NW cross-section with altitude in metres above mean sea level. Hydrogeological units are referred to by their abbreviated names (see Section 2.3).
The study area was discretised into regular 500 m × 500 m grid cells according to the six layers generated from the 3D geological model, for a total of 78,732 active grid cells (Figure 7). The GKS formation was divided into two layers to represent the semi-permeable layer that separates the GKS unit from the Gfg unit, as its impact on groundwater flow was established in the southeast of the basin. Other vertical heterogeneities were not represented in the model because they are unknown at the scale of the area. They are indirectly accounted for in the five aquifer horizons of the model by an equivalent hydraulic conductivity value generally lower than the one estimated from pumping tests.
3.3. Hydrodynamic parameters
The modelled domain is represented as a continuous porous medium in which the heterogeneities are taken into account through the variations of the values of the hydrodynamic parameters. The a priori values of horizontal hydraulic conductivity are estimated from ca. 20 long-term pumping tests. We deduced an average value for each layer: 2.4 × 10⁻⁵ m/s for GKS, 9 × 10⁻⁶ m/s for Gfg, 2.1 × 10⁻⁴ m/s for Ggq, 3.6 × 10⁻⁵ m/s for SAC1, and for Gfr, 1.3 × 10⁻⁵ m/s. The hydraulic conductivity in the direction parallel to the layers (Kx = Ky) is assumed to be 10 times higher than the conductivity in the perpendicular direction (Kz) for all layers. The major faults are implicitly considered in the model using a horizontal anisotropy factor ranging from 1 to 2 orders of magnitude. The a priori values of the storage coefficient are based on five values, available for GKS (1.5 × 10⁻⁴; 3.8 × 10⁻³), Gfg (3.8 × 10⁻³), and Ggq (5.5 × 10⁻⁴; 2.3 × 10⁻³). The specific yield of the aquifers (outcrop parts) was initially considered to be between 2% and 5% according to their lithology.
3.4. Boundary conditions
Since the hydrological boundaries of the Kou watershed do not match those of the hydrogeological basin (Section 2.3), the model domain was chosen in such a way that boundary conditions could be more easily defined (Figure 7). They were extended mainly to the west and east of the basin in order to find natural boundaries, which are, respectively, the Mouhoun River and the limit of the sedimentary basin (Bobo-Dioulasso cliff).
The eastern boundary of the sedimentary basin is prescribed as a no-flow boundary condition, assuming very limited exchanges between the basement and the sedimentary basin. On the Mouhoun River, which is a perennial river, a specified head boundary condition is assigned based on river heights. Daily water level and discharge data, provided by the General Directorate of Water Resources, are available for stations on the Kou and Mouhoun rivers for various periods between 1961 and 2014, ranging from 9 to 54 years. The data selected according to a data quality criterion from four stations on the Kou (Koumi, Nasso-milieu, Badara, Confluence Niamé-Baoulé) and three stations on the Mouhoun (Guéna, Banzon, Samendéni) were used to define these boundary conditions (water levels) (Figure 1). On the northern and southern limits of the area, specified steady state head boundaries are defined from the observed groundwater levels and the values are extracted from the reference potentiometric map. Groundwater level data from 100 observation points (87 piezometers and boreholes intersecting the phreatic aquifer, and 13 springs) for the period 1995–1999 were used to draw this reference potentiometric map for the low-flow period of this time interval.
Streams in the Kou basin are represented using a Robin boundary condition, i.e. a head-dependent flux condition. In the sections of the Kou River assumed to be in equilibrium with the water table, the river hydraulic head is derived from hydrometric data. Its tributaries, mostly temporary, are represented with a drain boundary condition and the drain elevation is equal to the topographic level. According to the classic approach proposed in Modflow, the amount of flux exchanged is regulated by the value of the conductance C (L2⋅T−1) of the river bed, which is written as:
| (1) |
All the pumping boreholes listed in the area were taken into account in the model by considering their exact position, except for boreholes equipped with manual pumps. The latter have low pumping rates (ca. 0.7 m3/h), and were therefore grouped by village by summing the pumped rates, which reduced the number of wells from 346 to 91.
3.5. Natural groundwater recharge assessment
The recharge values introduced into the model are derived from the Thornthwaite balance [Thornthwaite 1948]:
| (2) |
| (3) |
| (4) |
3.6. Steady state and transient simulation configurations
A two-stage trial-and-error calibration procedure was used. The model was first calibrated in steady state using data from 1995 to 1999. It was then calibrated in transient state at a monthly time step during the period 1995–2014 and applied to estimate the different flows that transit in the domain. The choice of these periods for the history matching was driven by data availability [Tirogo et al. 2016]. Finally, the model was used over the period 1961–2014 in order to analyse the effect of climate variability on the water table and in particular the impact of the great drought of the 1970s and 1980s.
For the transient simulation over the period 1995–2014, the boundary conditions are of the same type as those defined in steady state (Section 3.4) but evolving with time, based on the observed water level in the rivers and on water table fluctuations in the piezometers near the boundaries. All other time-varying data (recharge, pumping) were also introduced into the model at a monthly time step. Initial conditions were obtained from the steady state solution for the period 1995–1999.
The 1961–2014 transient simulation was run at an annual time step. No groundwater-level time series was available for this period, preventing the use of specified head boundary conditions along the northern and southern limits. The evolution of the simulated inflow and outflow through the specified head boundaries in response to changes in recharge rate over the period 1995–2014 (decrease of ca. 20 mm between 1995–1999 and 2014) was analysed. It served as a basis for prescribing their temporal evolution as a Neumann specified-flux boundary condition, based on the estimated change in recharge from 1961 to 2014. With these boundary conditions, a steady state simulation was performed for the year 1961 and used as initial conditions for the 1961–2014 transient run.
3.7. Model calibration
Considering the availability of data, the steady state model is calibrated under low-flow conditions, using data from 68 observation points between 1995 and 1999. The discharge data of the main springs of the area and river flow were also used to calibrate the model. The input parameters for the steady state calibration were recharge, hydraulic conductivity, and river and drain conductances. The steady state calibration consisted in adjusting these parameters to reproduce the observed groundwater level and the flows of the Kou River, the drains (temporary tributaries), and the springs.
The a priori and uniform value of the recharge was adjusted following a sensitivity analysis, performed with a range of recharge values calculated using maximum available water contents between 100 and 200 mm and runoff coefficient values from 3% to 9%. These tests led to the definition of higher recharge values in the high-altitude areas of the domain than in the rest of the modelled area.
After setting the values of the recharge, the hydrodynamic parameters were calibrated, starting from a priori average hydraulic conductivity values from the pumping tests (Table 1). The single hydraulic conductivity value applied to each layer was subsequently modified, especially in the outcrop areas, to reproduce the observed groundwater levels. In the absence of measured hydraulic conductivity values and groundwater level data in the deep levels (more than 300 m), the initial K values were not modified outside the outcrop areas, except in the upper GKS layer in the eastern part of the domain. In this area, the reproduction of the observed groundwater levels within the GKS and Gfg layers required the inclusion of a semi-permeable level that plays an important role in the hydrodynamic functioning of the aquifer system. The faults also play an important role in simulating the observed water table and flow rates and were progressively introduced in the calibration procedure. Finally, the conductance values were adjusted to reproduce the flows of 10 springs and those of the Kou and Mouhoun rivers.
Under transient conditions, the model was calibrated using the 20-year groundwater level time series of 30 observation points from April 1995 to December 2014 at a monthly time step, based on their detailed analysis by Tirogo et al. [2016]. Only the storage coefficient and the specific yield values were adjusted in this second calibration step, starting from the a priori values presented in Section 3.3. Particular attention was paid to reproducing the heterogeneous behaviour of the aquifer system after 2005 between the upstream and downstream parts of the basin, as described by Tirogo et al. [2016]. Indeed, it has been shown that, despite a slight increase in recharge after 2005, the water table still decreases upstream of the Nasso/Guinguette springs while it increases downstream of the basin. This led to the delineation of new recharge zones upstream and downstream of the Nasso/Guinguette springs. This revised spatial distribution of recharge was then taken into account in the entire steady state calibration procedure and in the design of the resulting transient simulations.
4. Results
4.1. Observed groundwater level map (1995–1999)
From groundwater level data, a reference average potentiometric map was drawn for the 1995–1999 low-flow period (Figure 8). A single map can be drawn consistently over the entire study area, regardless of the outcrop aquifer. The assumption of a single water table was the basis for previous modelling works [Dakouré 2003, Derouane 2008, Sauret 2008], given the absence of data on deep levels (beyond 300 m) or data that would make it possible to distinguish differences in heads between aquifers. In general, the observation points capture the first aquifer encountered and the static levels are shallow. The depth of the measured static levels is generally less than 10 m, but in a few rare places, it can reach 40–60 m. The direction of groundwater flow generally follows the topography. The highest groundwater levels are found in the south and east of the basin, in the topographic heights. On the potentiometric map for the period 1995–1999, groundwater levels range from 499 masl in the south to 286 masl in the north with a gradient of 3‰.
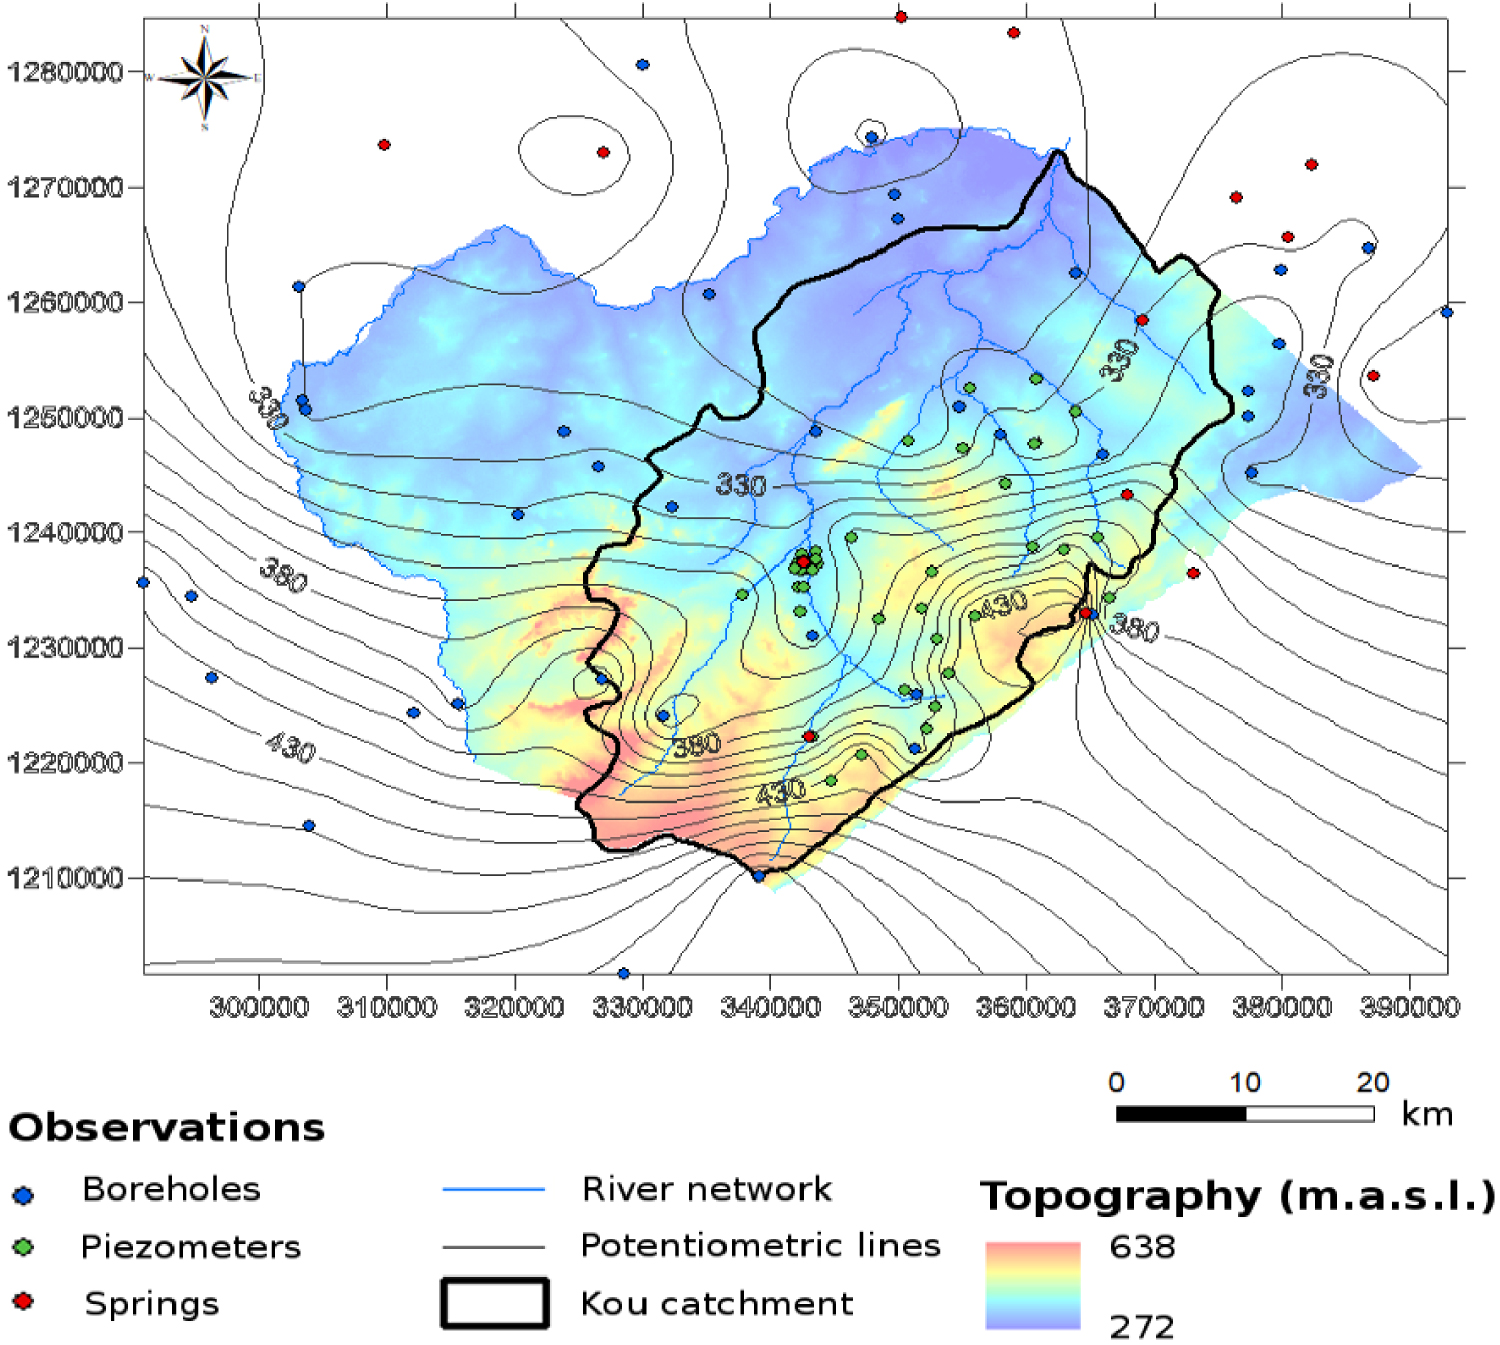
Topography level map (colour) and average groundwater level map (lines) (1995–1999) in metres above mean sea level.
4.2. Recharge of the aquifer system
The monthly recharge was calculated during the period 1961–2014 using the Thornthwaite balance. The results show that recharge is highly variable from year to year and represents on average 12% of the rainfall (Figure 9). Over this period, on an annual scale, the balance terms are distributed as follows:
- In mm, P (1010) = AET (812) + R (75) + I (123),
- In percent, P (100%) = AET (81%) + R (7%) + I (12%).
The proportion of rain that infiltrates, estimated by several authors [e.g., Gombert 1998, Dakouré 2003] at different periods between 1950 and 2000, is in the same order of magnitude (10–15%). The value of the annual recharge could thus reach 240 mm in the 1950s when rainfall was abundant [Sogreah Ingénierie 1994] whereas in the recent period, it is less than 120 mm/year [Dakouré 2003, Derouane 2008]. There is a decreasing trend in recharge from 1961, which was attributed not only to a decrease in rainfall but also to a slight increase in evapotranspiration [Tirogo et al. 2016]. This decline is also reflected in the presence of years without recharge after 1980. For the 1995–1999 steady state regime, the mean recharge value determined from these results is 95 mm/year but can vary between 60 mm/year and 150 mm/year. It is in this range of values that the sensitivity analysis of the model to recharge was performed.
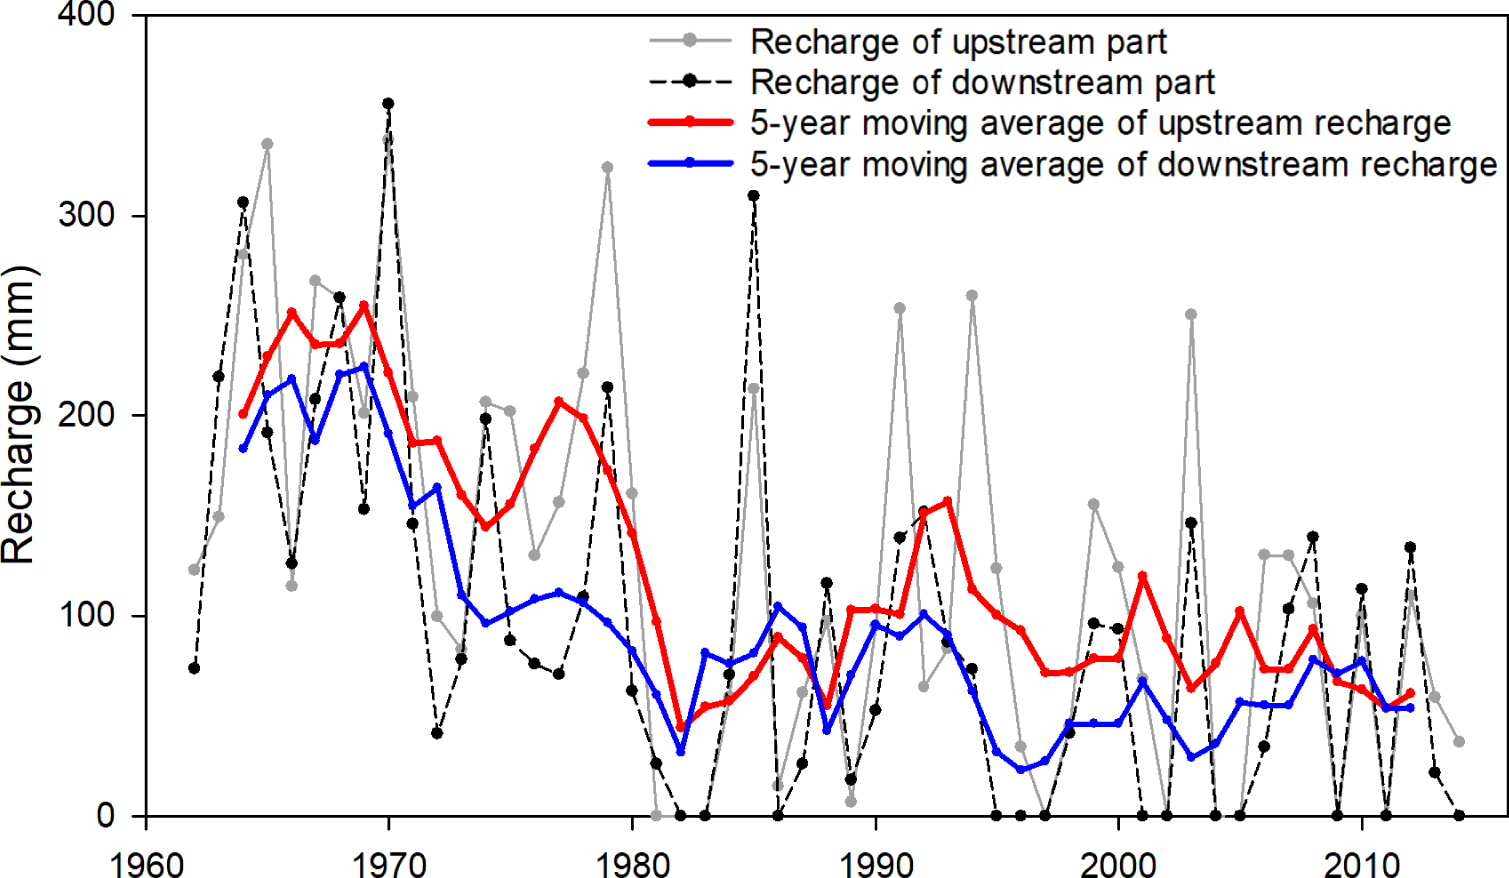
Variation in annual recharge between 1961 and 2014 for the upstream and downstream parts of the study area (with AWCmax = 130 mm, see Section 3.5).
4.3. Model results
4.3.1. Steady state calibration results
Following the sensitivity analysis, two preferential recharge zones were delineated around the high-altitude zones, to the south (around Péni) and to the east (Bobo-Dioulasso area), with recharge values of 115 mm/year compared to 95 mm/year in the other areas. This result is in agreement with the hypothesis put forward by Dakouré [2003] from isotopic analysis results, according to which the high-altitude zones are preferential recharge zones. The calibrated hydraulic conductivity values are summarized in Table 1. They are generally within the range of values obtained from the long-term pumping tests. In the outcrop areas, the calculated values generally vary within the same layer by 1–2 orders of magnitude. Lower values of hydraulic conductivity (<10−6 m/s) are predicted locally, reflecting the heterogeneous nature of the aquifer layers, which is also supported by observations from short-term pumping tests [Dakouré 2003, Tirogo 2016].
Hydraulic conductivity values from measurements and from steady state calibration
| Aquifer layer | Measured values (m/s) | Calibrated values (m/s) | ||
|---|---|---|---|---|
| Minimum | Maximum | Minimum | Maximum | |
| Gfr | 1.3 × 10⁻⁵ | 2.0 × 10⁻⁵ | ||
| SAC1 | 3.0 × 10⁻⁵ | 5.6 × 10⁻³ | 2.7 × 10⁻⁷ | 5.0 × 10⁻⁴ |
| Ggq | 9 × 10⁻⁵ | 5.2 × 10⁻⁴ | 2.0 × 10⁻⁵ | 4.0 × 10⁻⁴ |
| Gfg | 2.9 × 10⁻⁸ | 3.3 × 10⁻⁵ | 3.0 × 10⁻⁶ | 2.0 × 10⁻⁵ |
| Impermeable layer | 1.0 × 10⁻⁸ | 5.0 × 10⁻⁸ | ||
| GKS | 1.1 × 10⁻⁵ | 3.6 × 10⁻⁵ | 5.0 × 10⁻⁶ | 2.0 × 10⁻⁴ |
A total of 18 faults were introduced into the model. Their role in the reproduction of the observed groundwater levels proved important. As a result of the calibration, most of the faults were found to be conductive, especially those connected with the Nasso/Guinguette springs (K is on the order of 10−2 m/s). Overall, their calculated hydraulic conductivity values range from 10−4 to 10−2 m/s, generally 1–2 orders of magnitude higher than those of the aquifer. Only a low-conductivity fault, intersecting Gfg and GKS, was introduced (Figure 10). In these ancient sandstones separated in places by mudstones, some faults could indeed be clogged and then considered of low permeability.
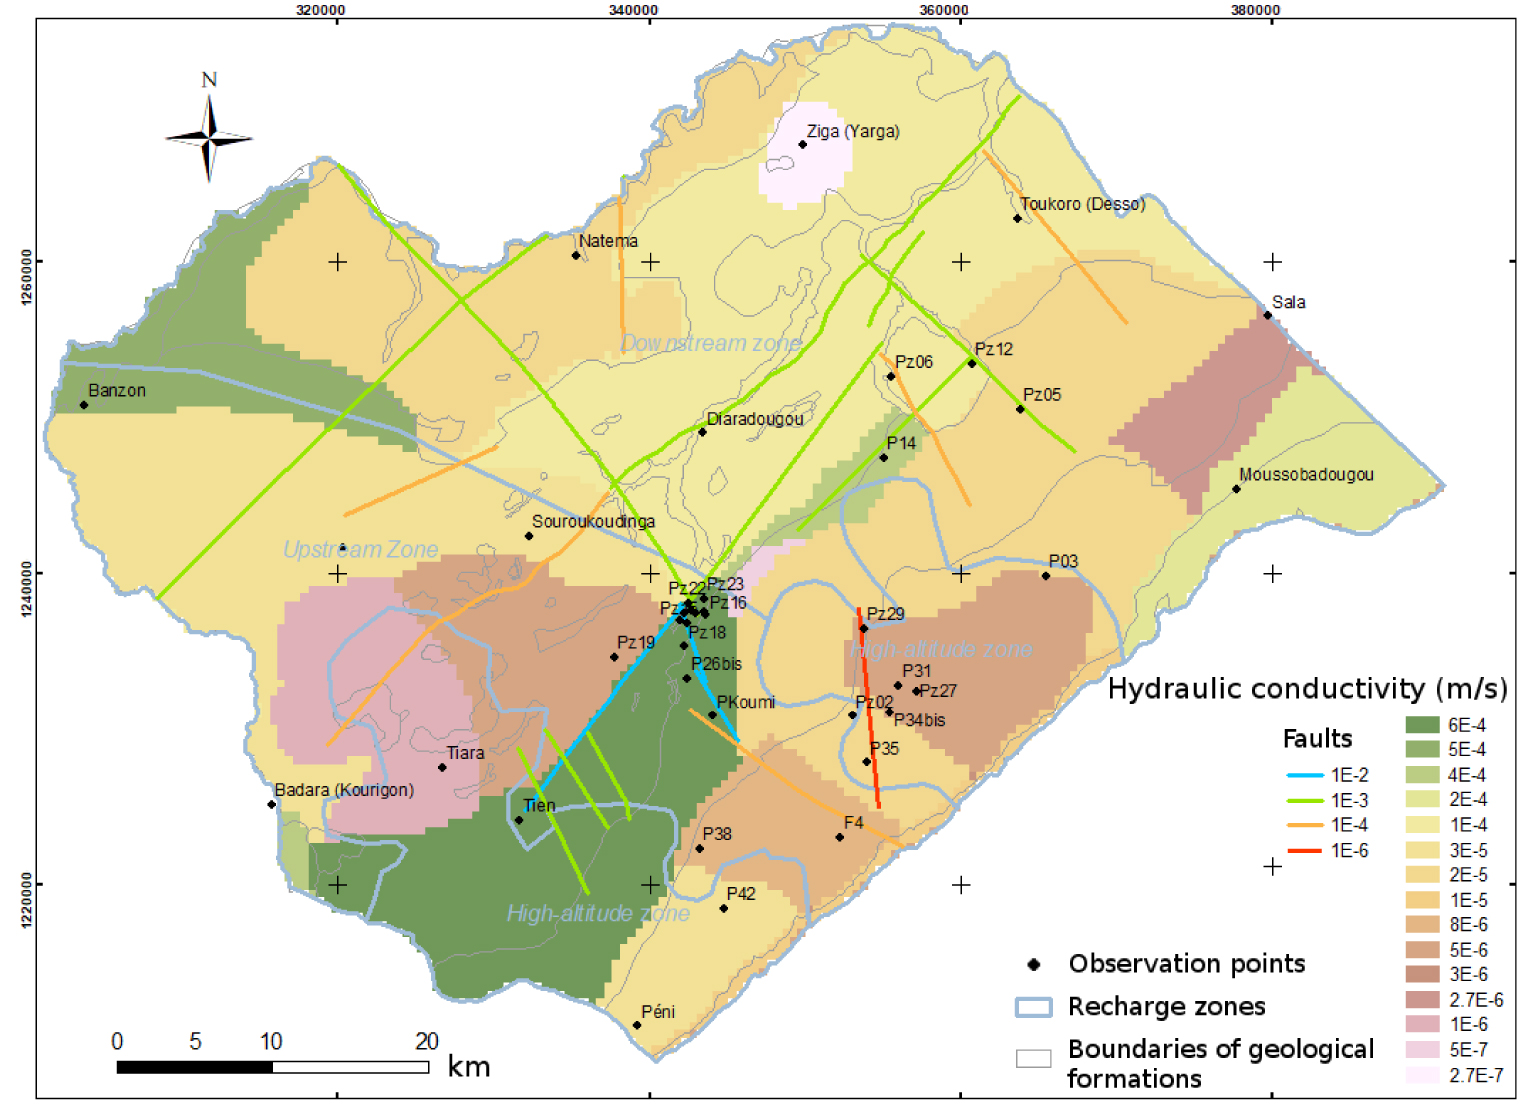
Hydraulic conductivity at outcrop from steady state calibration during 1995–1999.
The flow rates of the springs were adjusted using the drain conductance at the spring and the calculated values are of the order of 10−1 m2∕s. For the Kou River and the drains (river tributaries), these values are between 4 × 10⁻⁴ and 2 × 10⁻³ m2∕s.
The hydrodynamic parameters presented above allowed us to reproduce the observed groundwater levels in a satisfactory way. The mean absolute error is 1.91 m for groundwater levels ranging between 286 m and 499 m. In addition, the root mean square error (RMSE) of 2.35 m is lower than the uncertainty in the topographic data, which could be as high as 4 m in some locations [Tirogo 2016]. The general groundwater flow is reproduced for the period 1995–1999, with an overall direction of flow from south to north. The horizontal hydraulic gradient is higher upstream than downstream of the domain.
The global water balance of the model is presented in Table 2. The total flow in the domain is estimated at 19.65 m3/s. Recharge represents almost half of the water inflow to the aquifer (9.55 m3/s or 49%). The rest of the inflow comes from lateral flows and is estimated at 3.95 m3/s from the south (20%), 4.43 m3/s from the southwest via the Mouhoun (22%), and 1.77 m3/s from the north (9%). The inflow from the Kou River is low (0.05 m3/s or 0.4%). As mentioned earlier, the study area is not a hydrogeological basin and the Kou basin is fed upstream by groundwater flow (≈42% of total inflow). The main discharge point for groundwater is the Mouhoun (52%). Discharge to the northern boundary (downstream part of the domain) is only half of that into the Mouhoun (23%). Springs account for 13% of outflows, and the Kou River and its main tributaries account for 11%. Pumping accounts for only 2% of total outflows.
Groundwater balance at steady state during the period 1995–1999
| Inflow (m3/s) | Outflow (m3/s) | ||
|---|---|---|---|
| Specified hydraulic head | South boundary | 3.95 | 0.14 |
| North boundary | 1.77 | 4.43 | |
| Mouhoun | 4.33 | 10.16 | |
| Pumping | 0 | 0.35 | |
| Drains (tributaries) | 0 | 1.29 | |
| Springs | 2.56 | ||
| River (Kou) | 0.05 | 0.72 | |
| Recharge | 9.55 | 0 | |
| Total | 19.65 | 19.65 |
The inflows from the southern and western lateral boundaries would correspond to a recharge area of nearly 1100 km2, which extends therefore beyond the limits of the study area, in the Orodara area south of the study area, with a recharge assumed to be higher than in the Kou catchment (ca. 170 mm/year).
Regarding aquifer–river exchanges in the Kou basin, the model results indicate river losses upstream of Nasso, then mainly gaining from Nasso to Diaradougou (0.06 m3/s), in the order of magnitude of the flows calculated by Sauret [2013] on this section (0.09 m3/s). From Diaradougou to the confluence with the Mouhoun, exchanges are in one direction only, from the aquifer to the river. In the alluvial plain, downstream of the Kou basin, the water table is very close to the surface (0–5.3 m). Overall, the Kou River drains the aquifer. The net flow from the aquifer to the river is estimated at 0.67 m3/s, including 0.36 m3/s upstream of the Niamé-Baoulé confluence.
4.3.2. Transient calibration results
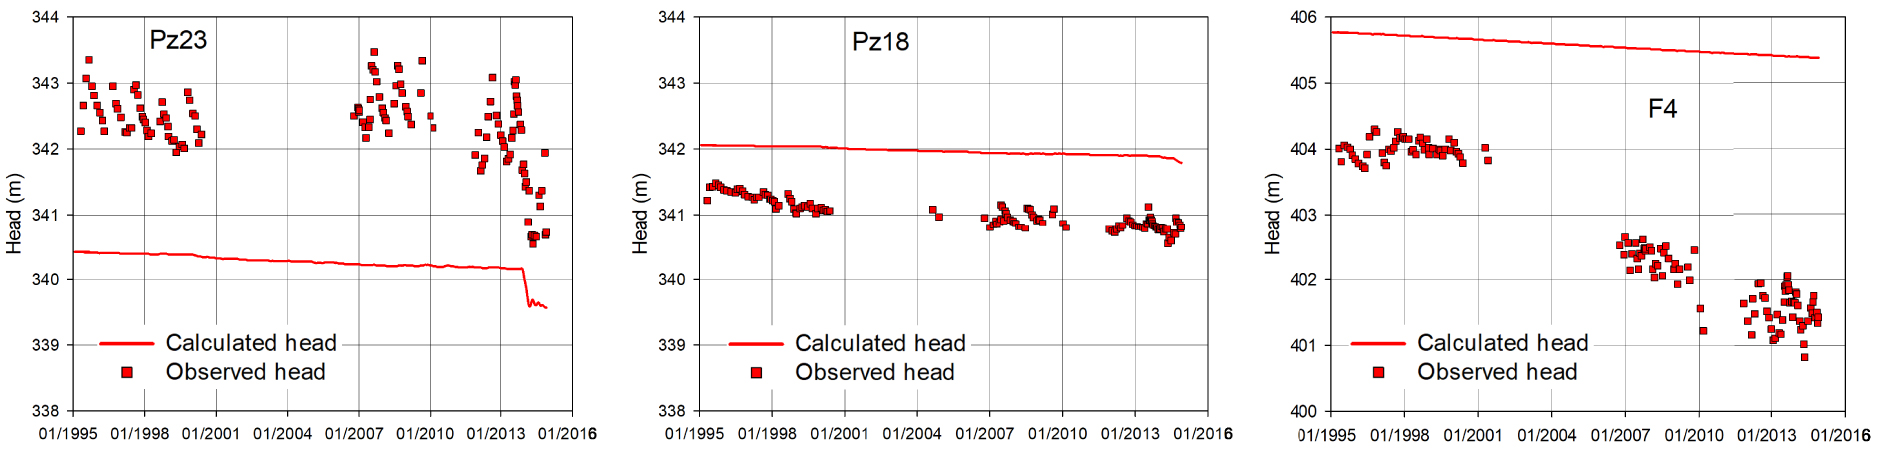
The calibrated distribution of specific storage (Ss) shows a high spatial variability, with values ranging from 5 × 10⁻⁵ to 5 × 10⁻³ m−1. The values of Ss can be considered reasonable when compared with Ss deduced from available field values (8 × 10⁻⁵ to 1 × 10⁻⁴ m−1). The specific yield (Sy) varies between 3 × 10⁻² and 5 × 10⁻². The differences between the aquifers (GKS, Gfg, Ggq, SAC1), however, are not very marked. Based on these values, the results of the comparison between observed and simulated groundwater level fluctuations are also considered satisfactory, although the dynamics of each piezometer could not always be reproduced (Figure 11), either because of the presence of several piezometers with different transient behaviour in the vicinity of each other (e.g., Pz23), or because of local specificities that could not be reproduced in the model (e.g., F4).
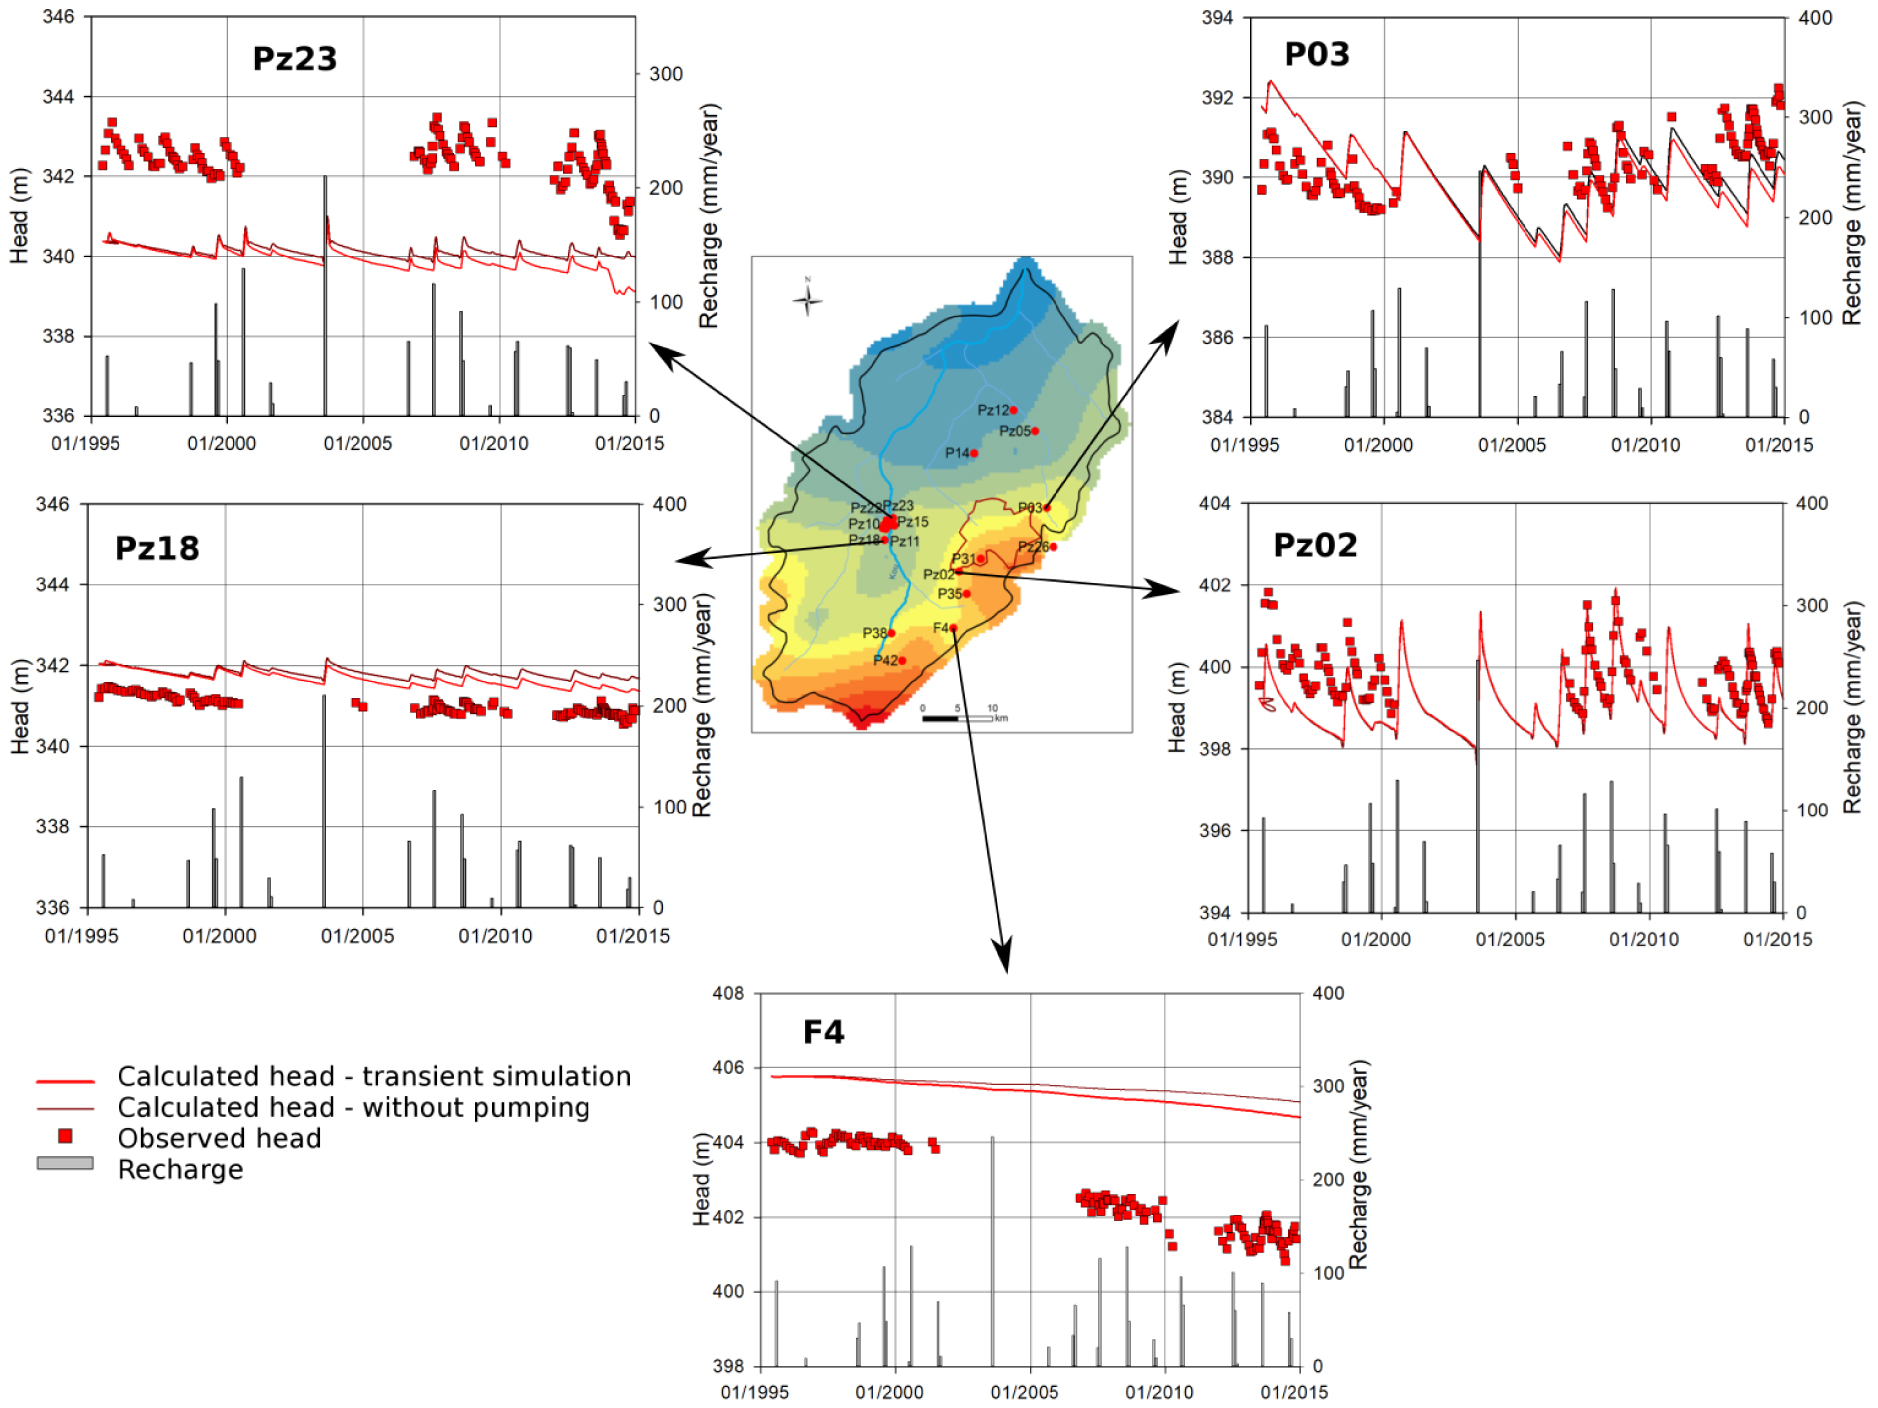
Selection of simulated vs. observed hydraulic heads (simulation with pumping and simulation without pumping). In the background map, the steady state water table contour lines, 20 m apart, from 300 to 480 m.
The components of the water balance are subject to seasonal and long-term variation related to variations in recharge. Inflows are dominated by those from the west with seasonal variations. In the downstream part of the study area, where the water table has been rising since 2006, the inflow from the Mouhoun River plays an important role in reproducing the evolution of the groundwater level. Therefore, there would be an additional filter between the rainfall signal and the water table response through the Mouhoun River, and subsequently an indirect recharge by this river.
The simulated discharge of the Guinguette spring decreases by approximately 0.31 m3/s, from 1.78 m3/s in 1995 to 1.47 m3/s in 2014 in the low-flow period (Figure 12). For the Nasso springs, the simulated discharge decreases by approximately 0.1 m3/s, from about 0.5 m3/s to 0.4 m3/s between 1995 and 2014. The simulated values are in the same order of magnitude as the observed data, both in terms of discharge decay (decrease by 0.36 m3/s for the Guinguette spring and 0.14 m3/s for the Nasso springs during the same period) and in absolute values where available.
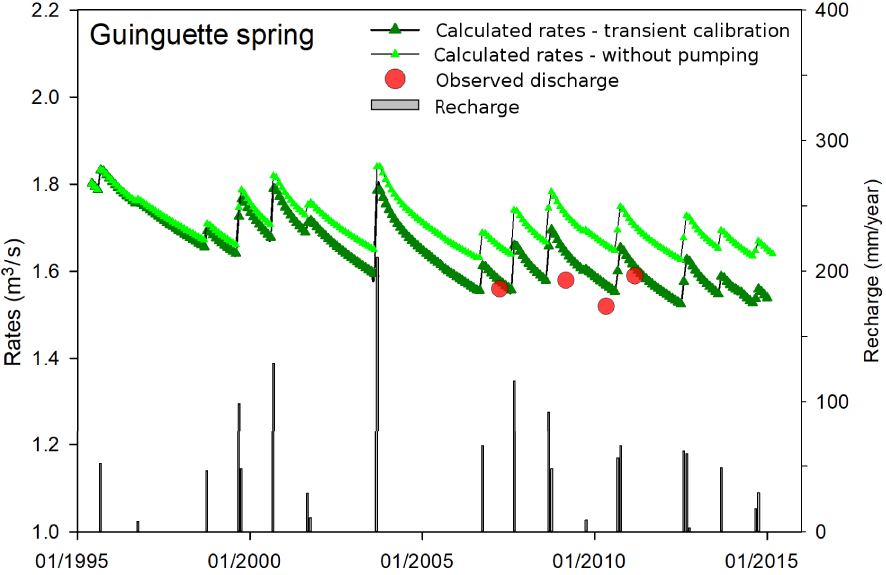
The Guinguette spring observed flow and simulated flow (simulation with pumping and simulation without pumping).
4.4. Response of the water table to pumping and recharge fluctuations
To test separately the influence of pumping and recharge variations on the water table, two simulations were performed, each including only one of these forcings. Thus, the influence of recharge was evaluated in a transient simulation without pumping, and then the impact of pumping was tested by removing the fluctuations of recharge and keeping the value that determines the initial conditions in 1995.
4.4.1. Response of the water table to recharge fluctuations
The response of the water table to the variation in recharge is spatially variable both in seasonal amplitude and in interannual variation (Figure 11). In general, the observed groundwater level decreases during the period 1995–1999 (period for which data are available). From the simulated groundwater level, we note that this decreasing trend continues until 2006. After the year 2006, the simulated groundwater level indicates a general trend toward stabilisation or a slight decrease in the upstream part of the basin (e.g., Pz02 and Pz18) while in the downstream part, there is an increase in the water table (e.g., P03). This evolution of the water table, both simulated and observed, follows the same trend as the recharge that drives it.
The simulated seasonal fluctuations vary between 0.2 and 2 m corresponding to the observed fluctuations. The highest seasonal amplitudes are recorded in the highest water level zone located in the Bobo-Dioulasso area (up to 2 m at Pz02 and P03). This reflects the reactivity of the water table in this zone, which is considered a preferential recharge zone. The groundwater response seems to depend on the depth to water table, which may reflect the variation of the transmissivity with the thickness of the saturated zone. Indeed, the seasonal fluctuations observed in the same zone (e.g., Pz02, P35, P31 with equal K) are more important where the water table is a few meters deep (5 m in Pz02) compared to where the water table is more than 10 m deep (P35 at 12 m, P31 at 20 m and more).
The simulations also illustrate how the discharge of springs responds to variations in recharge. These variations over the past 20 years would have resulted in a decrease in the low-flow discharge of the Guinguette and Nasso springs of about 0.16 m3/s and 0.05 m3/s, respectively. The most significant decreases are linked to the successions of dry years over at least 2 years (1995–1998, 2001–2002, 2004–2005) but it should also be noted that it only takes one wet year (e.g., 2003) to return to the discharge levels of 1995 (Figure 12). From 2006 onwards, the annual recharge, which has become more regular from year to year, would contribute to stabilising the discharge of the springs.
4.4.2. Response of the water table to pumping
The results of the model simulation without variation in recharge show that withdrawals, although relatively low (ca. 2% of total flows), influence the water table (Figure 13). Over the period 1995–2014, this influence is reflected in a moderate drop in the water table ranging over the entire area from a few centimetres to approximately 1 m, depending on the distance to pumping (e.g., Pz23 within 200 m of ONEA wells) and on the hydrodynamic parameters. In general, the northern and eastern parts of the basin are the most sensitive to pumping, related to their relatively low hydraulic conductivity values compared to the southern and western areas. For the same period (1995–2014), in the Bobo-Dioulasso area where there is a lot of industrial pumping and in Darsalamy (F4, Figure 13), the simulated drop in the water table is of the same order of magnitude (ca. 0.5 m) as that of the ONEA pumping area. Yet pumping in these areas (ca. 2500 m3/day in 2014) is significantly lower than in the ONEA pumping area (ca. 40,000 m3/day in 2014). Indeed, ONEA boreholes tap into the Ggq, which are a very good aquifer with a hydraulic conductivity 10 times higher than that of the Gfg in which the pumping in the Bobo-Dioulasso area is done.
Examples of simulated groundwater level variations under the influence of pumping.
These simulations also allowed us to analyse the flow variations between 1995 and 2014 in order to evaluate the influence of the withdrawals on the springs’ discharge. The same inflections observed on the water table are present on the simulated flow rate of the Nasso/Guinguette springs. The evolution of the springs’ flow is marked by three phases (1995–2000, 2000–2014, from 2014), characterised by an accelerated decrease in the discharge rate (Figure 14, Guinguette spring). In this simulation without recharge variation, the discharge of the Guinguette decreases by about 0.10 m3/s and that of Nasso by about 0.04 m3/s under the effect of pumping, i.e., a contribution of pumping to the total decrease in the discharge of the Guinguette and Nasso springs between 1995 and 2014 (see Section 4.3.2) estimated at around 30–40%.
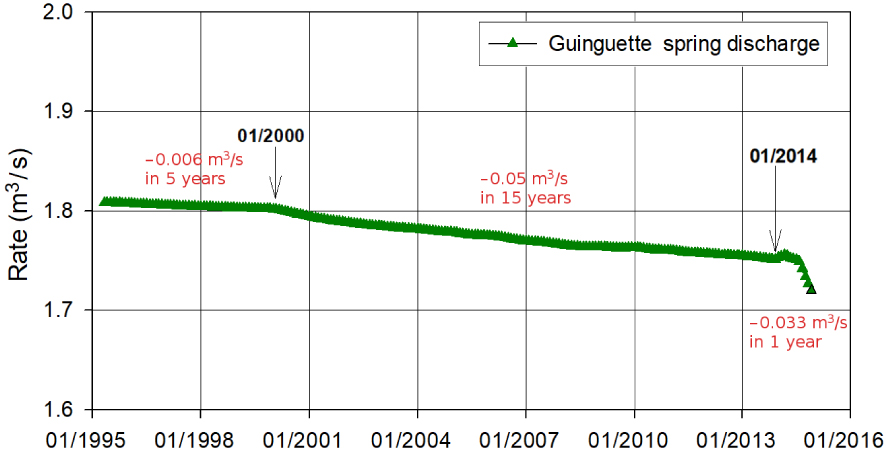
Simulated variation in the discharge of the Guinguette spring under the influence of pumping.
4.4.3. Impact of climate on the water table from 1961 to 2014
The simulation over the period 1961–2014 at annual time step allowed us to analyse the evolution of the water table and the discharge of springs related to the climate variability since the 1960s. The simulated groundwater levels are fairly well adjusted to the observed levels during the period 1995–2014 (Figure 15), and the simulated spring discharges are in agreement with the observed ones (Figure 16). The simulated results show that the water table is sensitive to interannual variations in recharge, which has been on a long-term downward trend since 1979.
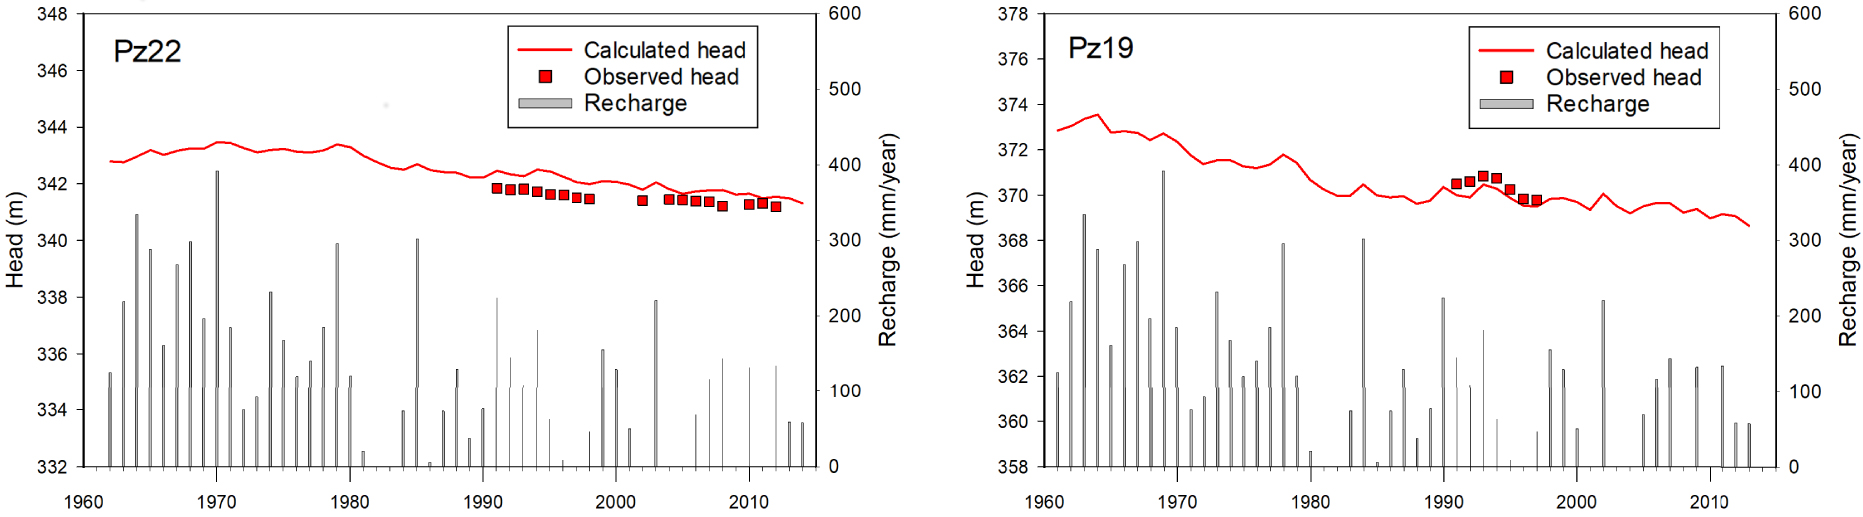
Overview of the evolution of hydraulic heads from 1961 to 2014.
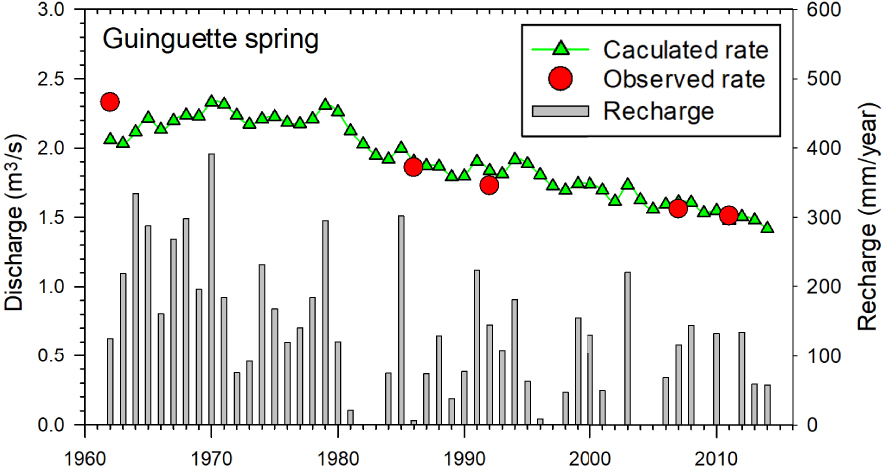
Simulated discharge of the Guinguette spring from 1961 to 2014.
The magnitude of the groundwater level drop, from 1 to 5 m between 1970 and 2014, is a function of hydrodynamic parameters. The drop in the water table has led to a decrease in the discharge of springs (Figure 16). Indeed, the simulated flows of the Guinguette and Nasso springs decrease, respectively, from 2.3 m3/s to 1.42 m3/s and from 0.6 m3/s to 0.37 m3/s between 1979 and 2014. The largest decreases occur during periods of zero or very little recharge (below 100 mm/year) over several consecutive years (−0.38 m3/s during 1980–1984, −0.20 m3/s during 1986–1990 for the Guinguette spring), and since 1979, the decrease in the discharge is continuous with occasional recoveries linked to relatively important recharge (over 100 mm/year).
As pumping was almost nil before the 1990s (Figure 6), the decrease in the springs’ discharge was controlled by the decrease in recharge since the 1960s. Indeed, periods of drought (rainfall deficit) are generally accompanied by prolonged periods without recharge or with a low recharge (below 100 mm/year), resulting in a significant drop in the water table. From the 2000s onward, the evolution of the water table and of the discharge rate of the springs is the result of the combined effect of pumping (in the vicinity of the boreholes) and of a lower recharge than in the 1960s. Therefore, it appears that the combined effects of climate and pumping are contributing to the observed deterioration in the groundwater level and the discharge of springs.
5. Discussion
The model run in steady state with Modflow was used to establish the water balance of the extended Kou catchment in the late 1990s. The simulation has shown that half of the inflows in the area come from the diffuse recharge of the aquifer and almost half from the upstream part of the basin through the Mouhoun and the upstream boundaries. The springs, the Kou River and its tributaries drain about a quarter of the flows, while pumping only accounts for approximately 2%.
This water balance highlights the importance of inflows from outside the study area. Imposed by the prescribed hydraulic head boundary conditions, themselves derived from the observed groundwater levels, these inputs are indeed consistent with the observed and simulated regional potentiometric map of the south-eastern margin of the Taoudeni sedimentary basin, according to which the Mouhoun, in equilibrium with the main aquifer, is identified as a general drainage axis oriented SW–NE [Dakouré 2003, Derouane 2008]. At the upstream end of the Kou watershed, the sedimentary structures extend south to the outcrop limits of the Taoudeni basin in Burkina Faso. Derouane [2008] places the groundwater divide on the topographical ridges, in line with the surface Mouhoun catchment, between 500 and 600 masl, upstream of Orodara and about 25 km from the boundary of the study area. This is where the excellent Ggq aquifer outcrops. The highlands of the Orodara region have been clearly identified as the main recharge area of the regional aquifer by previous geochemical studies in relation to their young age [Dakouré 2003, Kouanda 2019], which is also consistent with the regional water table pattern. In addition, these topographical heights are wetter than the Kou watershed (1140 mm/year at the Orodara weather station versus 1025 mm/year at the Bobo-Dioulasso station on average since the 1960s), with a clearer improvement in rainfall conditions after 1990 [Tirogo et al. 2016]. With the rainfall recorded at the Orodara station, higher recharge values of around 150 mm/year are calculated for the study period (compared to 95 mm/year in the Kou catchment), all other conditions being equal. However, these more favourable current recharge conditions are still not sufficient to justify the inflow values upstream of the study area, given the surface area involved (approximately 1100 km2). They underline the high uncertainties associated with each term of the water balance calculated with the model (Table 2).
Indeed, the results of the model are highly dependent on the assumptions made. Missing information leads to non-unique solutions to the inverse groundwater flow problem, where different recharge and hydraulic conductivity patterns are possible to reproduce the observations. This is evidenced, for example, by the differences with the water balance from the numerical groundwater flow model of Sauret [2008], which calculates 75% higher flows over an area similar to the one considered here, 2/3 of which come from the Mouhoun and Kou rivers, even though the estimated direct recharge is divided by 3. The possibility that the Mouhoun recharges the water table upstream of the study area during the rainy season, when floods are often severe [Kouanda 2019], remains to be confirmed, as there are no observations of the exchange between the water table and the river in the vicinity and the data series from the Guéni hydrometric station are incomplete and sometimes questionable (see Figure 1). As for the Kou, the direction of groundwater-river exchanges seems to vary spatially from one section to another, according to Sauret [2013], who studied them in the alluvial plain downstream of the Nasso/Guinguette springs.
Modern recharge estimates using various methods (Thornthwaite balance, hydrological or hydrogeological modelling) have not yet allowed a narrower range of values to be proposed (from 26 to 170 mm/year) and show some disparity, both in magnitude and in spatial distribution [Dakouré 2003, Derouane 2008, Sauret 2008, 2013, Kouanda 2019]. In particular, recharge estimates are highly dependent on the soil maximum available water capacity used in the Thornthwaite method or the calculation time step. It is therefore difficult to limit the adjustment of the model parameters to hydrodynamic parameters only. A special case are the relief areas coinciding with the presence of groundwater mounds. The relatively shallow depths to water table in these areas were here explained by higher recharge following the sensitivity analysis, given the range of possible recharge values and the observed response of the water table to temporal variations in recharge, rather than by lower hydraulic conductivities. However, to the east of the study area, it was necessary to introduce a low conductivity layer in order to maintain sufficiently high groundwater levels while maintaining hydraulic conductivities appropriate for a surface aquifer and consistent with the results of pumping tests. The presence of such low-permeability layers locally dividing the multilayer reservoir is recognised, particularly at the interface between the GKS and the Gfg [e.g., Derouane 2008].
A modern automatic parameter estimation method, rather than the two-stage trial-and-error calibration procedure used in this study, would also help to quantify the degree of uncertainty associated with a given prediction of the calibrated model. It would provide valuable feedback on the strengths and weaknesses of the input datasets, allowing future data collection to be optimised. The lessons learnt from this modelling study will also be relevant to the selection of an adequate level of complexity for future models to be developed in the study area [e.g. Lecca 2005].
In this respect, although our model provides a quantification of flows that is not possible from groundwater level observations alone, but is consistent with them, it is subject to strong assumptions about the boundary conditions upstream of the domain that intersect with the flow lines. The mismatch between the hydrological and hydrogeological catchments of the Kou has already led us to extend the study area westwards, but it would also benefit from being extended southwards to the boundaries of the Mouhoun catchment, on the aforementioned Orodara heights. Another solution would be to include it in a regional model, such as those previously constructed, which cover the south-eastern edge of the Taoudeni sedimentary basin. This would make it possible to better represent the organisation of groundwater flows, particularly at depth, and to use the model to study scenarios relating to the origin of the water, particularly in the Nasso/Guinguette springs area, and to question the results obtained here concerning the relative influence of climatic variability and abstraction.
Indeed, this exceptional site for the sub-region is also recognised as being particularly vulnerable. It is influenced by the four nearby 250 m3/h ONEA wells, which in 2014 tapped the Ggq aquifer for about a third of the study area’s water withdrawals. This is evidenced by the significant decline in spring discharge compared to the moderate drop in groundwater levels. In the absence of direct annual recharge, the model also predicts a continuous decline in their discharge, the preservation of which would therefore be partly contingent upon the annual recharge. However, the catchment area of the springs also extends beyond the Kou to the Orodara heights [Dakouré 2003]. The springs are located along major faults that bring the Ggq aquifer into contact with the SAC1, as indicated by geophysical prospection, and are believed to be fed by upward circulation [Talbaoui 2009]. Analyses of water and carbon isotopes also confirm the resurgence of a predominantly old water (between 300 and 500 years old) [Dakouré 2003], which is all the more fragile because of its low renewal rate [Dakouré 2003, Huneau et al. 2011]. Considering the size of the reservoir (more than 1000 m thick), the renewable water resources of the sedimentary aquifer in SW Burkina are in fact only about 1% [Gombert 1998]. The decline in spring discharge could therefore also be due to the depletion of a resource isolated from modern recharge and palaeo-recharged during wetter periods, located in the deepest and most confined areas of the south-eastern margin of the Taoudeni sedimentary basin [Huneau et al. 2011]. However, it is difficult to describe the organisation of the deep groundwater flow, which may be separated from the surface in places, as evidenced by the existence of numerous artesian wells in the basin. Following Derouane [2008], Tirogo [2016] or Kouanda [2019], we can propose a nested flow system according to the scheme of Tóth [1963], with a combination of recent superficial groundwater drained locally in the valleys and ancient water following regional flow paths that ensure the connection at the scale of the sedimentary system between the recharge zones of Orodara and its distant outlet in the Gondo depression [Derouane 2008], some of which rise locally thanks to the large fault networks. Groundwater flow in this context is then similar to that of large systems with a wide range of water residence times [Maxwell et al. 2016]. This hypothesis, which departs from the single multilayer reservoir model, needs to be confirmed by a better understanding of the basin’s deep circulations and the properties of the aquifers that host them, which have not yet been identified by drilling. The development of local versus regional flow systems is sensitive to the exponential decay rate of hydraulic conductivity [Jianget al. 2009], a sensitivity that could be tested in our study case with the multi-layer model extended to the southern recharge areas. By extending it also in time, back to the colder recharge periods mentioned by geochemists [Dakouré 2003], one could also test the hypothesis of depletion of a palaeo-recharged resource and a system still in equilibrium with past boundary conditions. However, this is not the case for permeable surperficial sandstones and carbonates, for which short response times can be estimated, as well as short-term variability in groundwater levels, significant intra-annual variability, but limited changes on decadal scales [Ascott et al. 2020]. An average transmissivity of 5 × 10⁻⁴ m2/s and a storage coefficient of 10−4 for 30 km length gives a response time of about 5 years. A slower response, associated with lower hydraulic diffusivity over longer distances, is possible at depth but needs to be demonstrated. By drilling deep boreholes through the sedimentary cover to the basement, it would be possible not only to confirm the thickness of the sedimentary cover, but also, by jointly estimating the storage coefficient, to determine the actual volumes of water contained in the sedimentary reservoir and thus its renewal rate, thereby improving the conceptual model of groundwater flow in the study area in the context of global change and increasing anthropogenic pressures.
6. Conclusion
Hydrogeological modelling has facilitated the analysis of the hydrodynamic functioning of the aquifer system of the Kou catchment using three factors that may influence it, namely, climate variability, anthropogenic withdrawals, and the spatial variation of the hydrodynamic parameters of the aquifer system. The response of the aquifer system to climatic and anthropogenic forcing is indeed quite heterogeneous all over the basin due to several factors, including the hydrodynamic parameters of the aquifers, the depth to the water table, or the exchanges with the drainage network, particularly the Mouhoun River.
Over the last 20 years, the variations observed in the water table, particularly through the decrease in the discharge of springs, are a combined effect of pumping and recharge evolution. Indeed, pumping increased significantly since the 2000s and the recharge of the last 20 years has often been marked by a succession of deficit years. Simulation performed since the 1960s indicates that these deficit years, more frequent after 1979, caused a drop in the water table, accompanied by a significant drop in the discharge of springs. The wet years, which remained isolated despite a slight increase in rainfall after the 1990s, were not sufficient to raise the water table, which is marked by a long-term downward trend. The aquifer system is sensitive to the variability of recharge, particularly to the cumulative deficit over several years. Pumping has also an impact on the water table and on the discharge of springs, even if the quantities of water withdrawn appear negligible in view of their small contribution to the water balance of the catchment. In particular, the concentration of boreholes with high flow rates in the same area significantly impacts the water table and could in the long term cause a considerable decrease or even a drying up of some springs. Pumping is estimated to be responsible for up to 40% of the decline in low flows in springs during the period 1995–2014. Given the high contribution of the springs to the base flow of the Kou River (80%), pumping would thus affect their contribution to surface waters and could accelerate the depletion of the water resource in general [Sapriza-Azuri et al. 2015], especially considering that these waters are ancient and deep [Huneau et al. 2011].
In this context in which pumping is constantly increasing due to population growth, its impact on groundwater levels, although moderate so far, could be more important in the future if measures are not taken now to ameliorate groundwater declines. Also, although climate model projections of precipitation for the West African region in the 21st century indicate relatively small changes in the upstream part of the Mouhoun basin [e.g., Biasutti 2013, Monerie et al. 2020], regionally heterogeneous changes in water availability are expected [Sylla et al. 2018] and there are large uncertainties in predicting the impact of climate change on runoff [Roudier et al. 2014], let alone groundwater recharge. Indeed, the trend towards higher rainfall intensities accompanied by lower frequency of rainfall events is likely to result in more intense runoff and flooding events [Panthou et al. 2018], which could deteriorate the recharge of the aquifer system [Kouanda 2019]. Given its sensitivity to the high variability in recharge, as shown in this study, further assessment of groundwater level evolution in the context of climate change is also required.
Therefore, appropriate measures will have to be taken for adequate quantitative management of the water resource of the Kou River catchment to ensure its long-term sustainability. It will be necessary to turn to a more efficient use of the resource (Sustainable Development Goals – SDG 6.4) and to integrated management (SDG 6.5). A key part of the water resource management system is the collection, storage and analysis of the relevant groundwater data, including water levels and abstraction data, which must be continued over the long term and at the catchment scale. Given the high variability of the water table behaviour at the scale of the watershed, it is important to develop and maintain a network of well-distributed monitoring wells coupled with the present model. In addition, as this study is based on data from shallow boreholes (less than 300 m), it would be appropriate to carry out further investigations over the entire sedimentary basin to gain a better understanding of the different aquifer levels at depth, their properties, and water potential. This could be used to improve the model to better fulfil its role as a resource management tool, and to identify areas of high productivity with modern groundwater where future high-flow-rate pumping could take place. Based on the results of the model, it appears indeed necessary to diversify the areas of withdrawals in the future to ensure the sustainability of the water resource, and to seek out the most productive and least vulnerable areas where pumping could be operated at optimal rates with the least impact, as far as the infrastructure allows. In this respect, the distance between production and demand must also be considered, depending on the different uses of the water resource. It is particularly important to preserve the area of springs on which the downstream flow of the Kou River depends, as well as the irrigated agriculture in its alluvial plain [Traoré 2012, Wellens et al. 2013]. Although the extent of managed aquifer recharge practice is relatively limited in Africa, and almost non-existent in West Africa [Ebrahim et al. 2020], the potential for artificial recharge could be explored for its possible benefits in stabilising storage decline and mitigating the effects of inter-annual variability in water availability. However, the sandstone aquifer system is vulnerable to anthropogenic activity, particularly in highly-populated peri-urban areas, where subsurface contaminant loads may not meet the quality requirements for water used for recharge [Huneau et al. 2011, Sako et al. 2020].
The efforts already made in the field of integrated water resources management, such as the irrigation schemes in the Kou Valley [Wellens et al. 2013], should be continued and extended to the entire catchment area. The modelling tool developed in this study could be used appropriately as a management tool to test scenarios for maintaining the coexistence of different water uses and defining allocation rules. It can also be used to predict the evolution of the water table under climate change and increased water abstraction. The current modelling, combined with alert thresholds for aquifer drawdown triggered by a remote monitoring network, can help to stabilise groundwater levels before they reach critical levels, including when assessing new water project proposals. Volumetric quotas can be proposed and adjusted according to the state of resources at the beginning of the dry season [e.g., Verley 2020]. The use of the model as an operational decision support tool to address issues raised by stakeholders involved in groundwater development and resource management will require further support and investment in applied problem-oriented research at the sub-regional level. Key to the success of this approach is the training of local operators in the use of the modelling tool, under the supervision of an expert hydrogeologist and in closer association with the academic sector.
Conflicts of interest
The authors declare no competing financial interest.
Acknowledgements
This work was carried out with the financial support of Institut de Recherche pour le Développement (IRD) through the Programme Doctoral International “Modélisation des Systèmes Complexes” (PDI/MSC), of Office National de l’Eau et de l’Assainissement (ONEA) and SIREA France. The realization of this work was possible thanks to the numerous data made available by the National Meteorological Agency (ANAM), Direction Générale des Ressources en Eau (DGRE) in Burkina Faso, ONEA, and the Regional Directorate in charge of water in “Hauts Bassins”. We would also like to thank the three reviewers for their insightful comments, which have helped us to improve the quality of this article.