

1 Introduction
On November 29, 2007, at 3:00 pm local time (19:00 TU), a 7.4 earthquake occurred about 30 km north of the island of Martinique (Fig. 1), and was widely felt throughout the Caribbean, from Jamaica to French Guyana (Douglas and Mohais, 2009; Schlupp et al., 2008). Piezometric-level changes such as some abrupt rises or decreases apparently correlated with the earthquake were recorded by the groundwater monitoring network of Martinique. Such reactions have already been observed notably in Japan (Hartmann and Levy, 2006; Oki and Hiraga, 1988), in the USA (Brodsky et al., 2003; Roeloffs et al., 2003) and in Armenia (Leonardi et al., 1997, 1998). Variations of spring discharge or piezometric-level changes induced by earthquakes have been widely described (Kissin and Grinevsky, 1990; Liu et al., 1989; Merifield and Lamar, 1981; Muir-Wood and King, 1993; Wakita, 1984), and synthesized (Manga and Wang, 2007; Roeloffs, 1996). Most of them occur after the earthquake, but some precursors have also been described (Kümpel, 1991; Leonardi et al., 1997; Roeloffs, 1988).
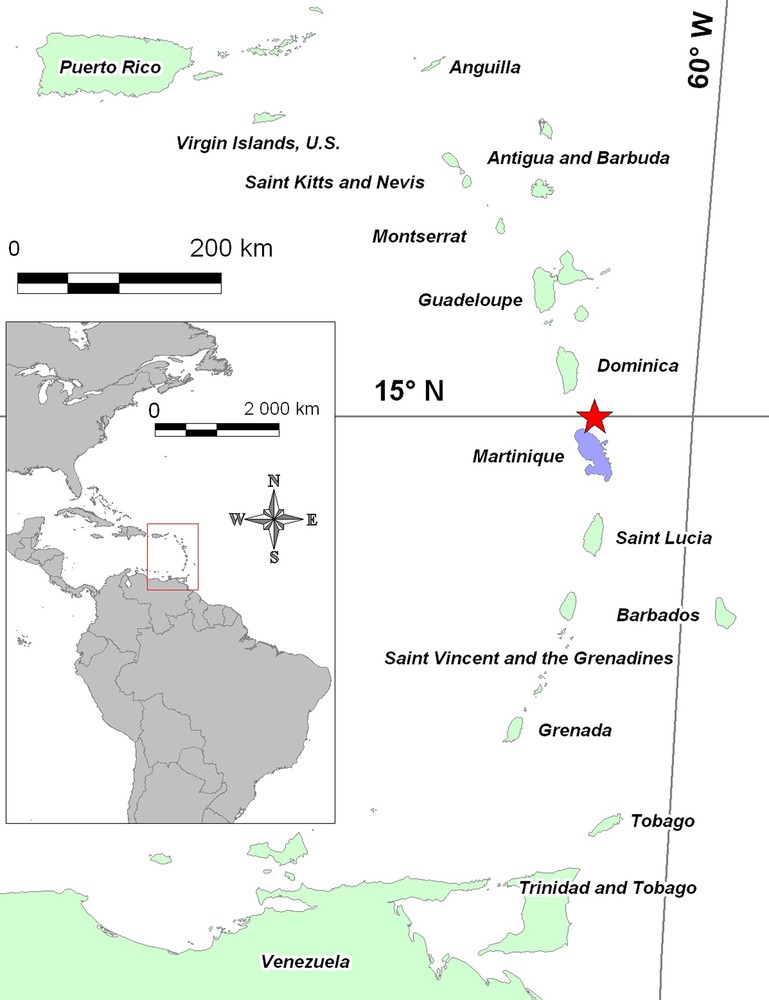
Location of Martinique and the Lesser Antilles arc, and of the November 29, 2007 earthquake epicenter (red star).
Localisation de la Martinique, de l’arc des Petites Antilles et de l’épicentre du séisme du 29 novembre 2007 (étoile rouge).
The present earthquake and its effects on piezometric levels are of great interest as the piezometric network is dense and the levels are not affected by external noise. It is worth mentioning that the earthquake occurred after a period of dry weather, and that the local seismic activity was very low prior to the quake. Moreover, to our knowledge, it is the first time that hydrologic responses to an earthquake are reported and described in the Caribbean. The main objectives of this study are to interpret the piezometric-level changes observed in Martinique and attributed to this earthquake, some of them as precursors, and to better understand the structure and functioning of aquifers in Martinique.
2 Geology and hydrogeology of Martinique
Martinique, a tropical volcanic island bordered by the Atlantic Ocean and the Caribbean Sea, is one of the French overseas territories (Fig. 1). Its surface area is about 1080 km2 (60 km long; 30 km wide, Figs. 1 and 2). The northern part of the island is mountainous (maximum elevation 1397 m) and thus mainly rainy (annual precipitation from 2000 to 5000 mm) in contrast to the southern part, lower in elevation (maximum elevation 504 m) and dryer (annual precipitation from 1000 to 1500 mm) (Fig. 2).
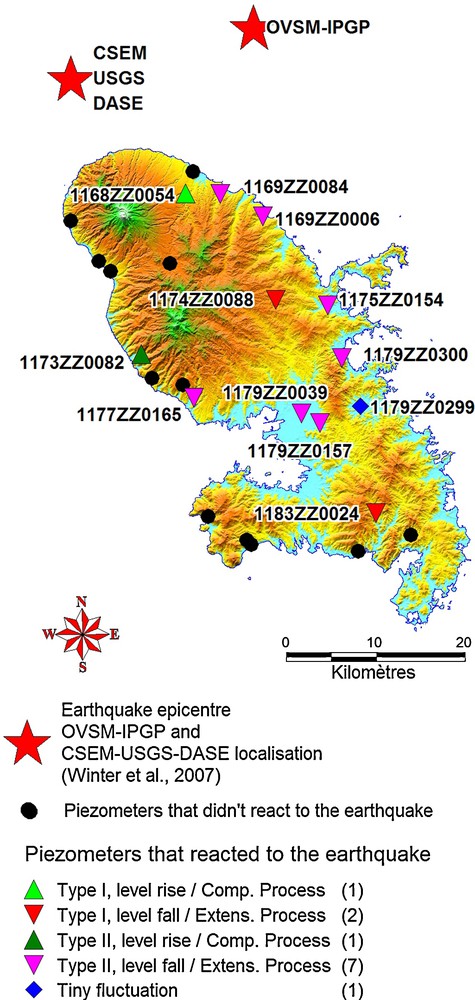
Location of the 24 piezometers operational during the quake and their main reaction – Background: Digital Elevation Model of Martinique (see main elevations in the text). OVSM-IPGP: Observatoire Volcanologique et Sismologique de la Martinique – Institut de Physique du Globe de Paris), CSEM-USGS-DASE: Centre Sismologique Euro-Méditerranéen – United States Geological Survey – Département Analyse Surveillance Environnement).
Localisation des 24 piézomètres opérationnels pendant le séisme et de leurs réactions associées. Fond cartographique : modèle numérique de terrain (se référer au texte pour les principales altitudes).
The island is exclusively volcanic, with a few interstratified sedimentary levels (limestone) (Westercamp et al., 1989). It results from more than 20 million years of geological construction typical of insular arc volcanism characterised by submarine activity (hyaloclastites), aerial volcanism with a shield volcano (basaltic and andesitic lavas), several stratovolcanoes (andesitic lava flows, dacite and andesite domes, pyroclatites, etc.), along with their erosion products (conglomerates, lahars, etc.). Weathering products are very common as a consequence of hydrothermalism, as well as the age of the island, and its humid tropical climate.
The hydrogeological context is also typical of the volcanism of andesitic tropical islands (Charlier et al., 2011; Lachassagne, 2006; Lachassagne et al., 2006). Most of the aquifers are small in size, a few km2 at most, and show very heterogeneous hydrodynamic properties. A few of them, the most permeable ones, are a priori of a porous type, mostly in recent unweathered pyroclastic formations. Most of the others, in lavas and hyaloclastites, have a fissure and/or a fracture porosity/hydraulic conductivity.
3 The November 29, 2007 earthquake
Seismicity is mainly related to faulting (see e.g. Poirier et al., 2009, for other processes) with mechanisms depending on the local geodynamic context (Bilal, 2009; Lassaad et al., 2010). In the Lesser Antilles arc, global tectonics is governed by the subduction of the Atlantic oceanic plate below the Caribbean one at an average velocity of about 2 cm/y (Feuillet et al., 2001). The 7.4 magnitude of this earthquake is the result of a rupture that occurred in the Atlantic dipping plate at great depth, approximately 150 km (Douglas and Mohais, 2009; Schlupp et al., 2008). The epicentre was located 30 km north of Martinique in the Dominica channel (Figs. 1 and 2). This is the most powerful recorded earthquake in the Lesser Antilles arc since the 1974 Antigua quake of magnitude 7.5. As a result of its great depth, the surface intensities were moderate (VII - EMS-98 scale - at most; Douglas and Mohais, 2009; Schlupp et al., 2008) and the damage and casualties were minor for an earthquake of relatively great magnitude.
A first modelling of the waves recorded on seismographs was conducted by Winter et al. (2007). The characteristics of the fault plane are quite well defined (azimuth 165°, dip: 88° west, slip angle: 101°). According to these authors, a break in this plane involves an extension within the diving Atlantic plate along a line parallel to the plate. A preliminary study of the source extent (Winter et al., 2007) shows that the source point was located at a depth of 160 km and a distance of 25 to 60 km from the hypocenter; the break followed a southward slide upward; the maximum shift was about 3 m and the rupture was quite abrupt and lasted around 20 s.
4 The recorded piezometric level fluctuations
The Martinique geological survey (BRGM) is in charge of its groundwater monitoring network which has progressively been equipped since 2005 with digital data loggers. By the end of 2007 it consisted of 29 boreholes with GSM teletransmitted data loggers configured with a one-hour measurement time step. Due to various technical and logistical constraints, in particular the damage caused by the hurricane DEAN a few months earlier, only 24 stations were operational during the earthquake (Fig. 2). The spatial density of the data (1 for 45 km2) remains nevertheless quite high. These piezometric data (only the mean daily piezometry) are uploaded into the French national database (http://www.ades.eaufrance.fr/).
Twelve out of the 24 operational piezometers monitored a signal (Figs. 2 and 3, Tables 1 and 2) that can be attributed to the earthquake. As the time step of the data loggers is 1 hour at each full hour and as the absolute precision of their clocks was a few minutes, the first piezometric measurements available were acquired at least 59 min after the shock.
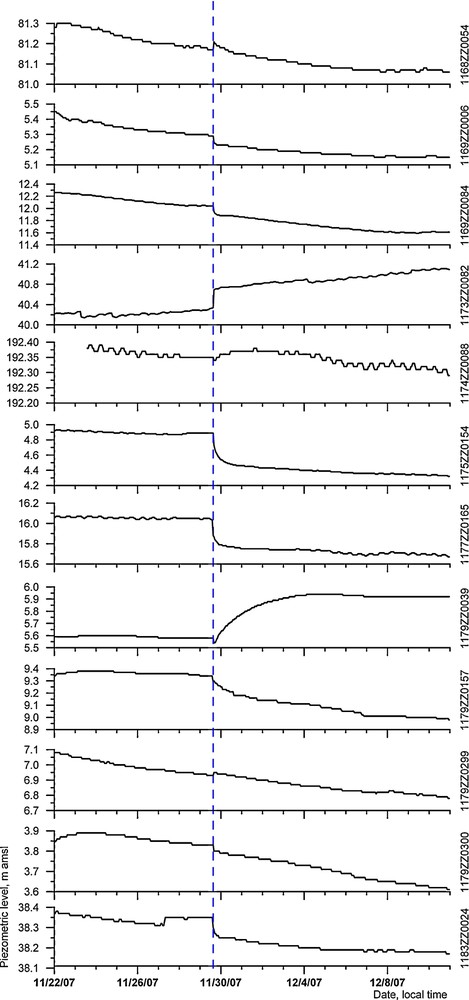
Piezometric records at the boreholes (local time) where a significant reaction was monitored (name of wells at the right side of the graphs; see location of the piezometers in Fig. 2; the vertical dashed line shows the time at which the earthquake occurred). No correction was applied to the piezometric data (for tidal effects for instance).
Niveaux piézométriques enregistrés dans les piézomètres où une réaction significative a été détectée (les noms des piézomètres sont indiqués sur la droite de chaque graphique, leurs emplacements sont indiqués sur la Fig. 2 ; le trait vertical en pointillés présente le moment où le séisme s’est produit). Les chroniques piézométriques n’ont fait l’objet d’aucune correction (des effets de marée par exemple).
Principales caractéristiques des piézomètres ayant réagi au séisme et de leurs aquifères associés.
| National number | Piezom. depth (m) | Ø dri. (mm) | Ø cas. (mm) | Screen depth (m) | Aquifer | ||
| Lith. | Por. | Type | |||||
| 1168ZZ0054 | 29 | 220 | 125 | 8–29 | Na. | P | U |
| 1169ZZ0006 | 27 | 116 | 115 | 9–27 | Hy. | F | C |
| 1169ZZ0084 | 23 | 204 | 125 | 7–23 | Hy. | F | C |
| 1173ZZ0082 | 47 | 152 | 125 | 11–31 | Lh. | P | U |
| 1174ZZ0088 | 42 | 220 | 125 | 21–42 | Hy. | F | C |
| 1175ZZ0154 | 50 | 152 | 125 | 18–50 | Lav. | F | C |
| 1177ZZ0165 | 47 | 255 | 152 | 15–46 | Lav. | F | C |
| 1179ZZ0039 | 55 | 500 | 300 | 42–55 | Lav. | F | C |
| 1179ZZ0157 | 50 | 116 | 110 | 15–50 | Lav. | F | C |
| 1179ZZ0299 | 39 | 204 | 125 | 27–39 | Hy. | F | C |
| 1179ZZ0300 | 51 | 152 | 125 | 19–42 | Hy. | F | C |
| 1183ZZ0024 | 34 | 165 | 125 | 6–20 | Lav. | F | C |
Principales caractéristiques des piézomètres qui n’ont pas réagi au séisme et des aquifères associés.
| National number | Piezom. depth (m) | Ø dri (mm) | Ø cas (mm) | Screen depth (m) | Aquifer | ||
| Lith. | Por. | Type | |||||
| 1166ZZ0026 | 29 | 152 | 125 | 10–26 | Na. | P | U |
| 1167ZZ0023 | 60 | 140 | 110 | 27–57 | Na. | P | U |
| 1167ZZ0024 | 50 | 102 | No | No | Na. | P | U |
| 1167ZZ0045 | 39 | 204 | 125 | 26–38 | Na. | P | U |
| 1168ZZ0037 | 41 | 204 | 125 | 4–41 | Pc. | P | C |
| 1177ZZ0161 | 46 | 220 | 160 | 20–44 | Lav. | F | C |
| 1177ZZ0173 | 21 | 220 | 125 | 11–21 | Pc. | P | U |
| 1181ZZ0131 | 25 | 130 | 90 | 5–25 | Lav. | F | U |
| 1184ZZ0001 | 45 | 116 | 115 | 25–30 | Pc. | P | C |
| 1184ZZ0028 | 8 | 1000 | 1000 | 2–8 | Pc. | P | U |
| 1185ZZ0120 | 50 | 150 | 90 | 12–50 | Hy. | P/F | U |
| 1186ZZ0118 | 63 | 500 | 300 | 6–63 | Hy. | P/F | U |
There is no ambiguity about the origin of the observed piezometric anomalies because of their simultaneity (Fig. 3), but also in particular because of the absence of any pumped well in the neighbourhood, and of significant rainfall during the period (see Section 6 below and the electronic supplement). These fluctuations range between 0.02 and 0.4 m (Table 3). Other piezometers may also have reacted, but, due to the time step and the 1–2 cm sensitivity of the loggers, no such possible piezometric signal was recorded.
Variations piézométriques induites par le séisme.
| National number | Aq. Type (from signal processing) | Fluct. Type | Rise(+) Fall (−) | SPC (m) | MAA (m) | % (SPC/MAA) | Precursor | |
| (Y/N) | Time before the quake (h) | |||||||
| 1168ZZ0054 | U. | I | + | +0.04 | 0.45 | 9 | N | - |
| 1169ZZ0006 | U. | II | – | –0.06 | 0.60 | 10 | N | - |
| 1169ZZ0084 | H. C. | II | – | –0.16 | 2.10 | 8 | Y | 28 |
| 1173ZZ0082 | U. | II | + | +0.41 | 4.10 | 10 | N | - |
| 1174ZZ0088 | C. | I | – | –0.04 | 1.45 | 3 | N | - |
| 1175ZZ0154 | C. | II | – | –0.43 | 0.90 | 48 | Y | 35 |
| 1177ZZ0165 | H. C | II | – | –0.30 | 1.00 | 30 | Y | 42 |
| 1179ZZ0039 | Interm. | II | – | –0.04 | 1.00 | 4 | N | - |
| 1179ZZ0157 | Interm. | II | – | –0.33 | 0.90 | 37 | N | - |
| 1179ZZ0299 | C. | I | + | +0.02 | 0.85 | 2 | N | - |
| 1179ZZ0300 | H. C. | II | – | –0.03 | 1.30 | 2 | N | - |
| 1183ZZ0024 | C. | I | – | –0.10 | 0.60 | 17 | Y | 56 |
The 12 piezometers that did not react to the quake (Table 2) turn out to be preferentially located on the west coast of Martinique (Fig. 2). Nevertheless, this is probably fortuitous as no relationship between the amplitude of the observed signal and the location of the piezometers was found (see below). For instance, two of the piezometers – 1173ZZ0082 and 1177ZZ0165 – that exhibit the greatest piezometric changes are located on the west coast). Nevertheless, even if a strong signal was observed during the earthquake at piezometer 1173ZZ0082 (Fig. 4), its data were not considered as fully reliable. Indeed, over the period extending from its drilling (2006) to December 16, 2007, the piezometric level has apparently not been steady (∼5 m piezometric increase) and has shown several unexplained fluctuations.
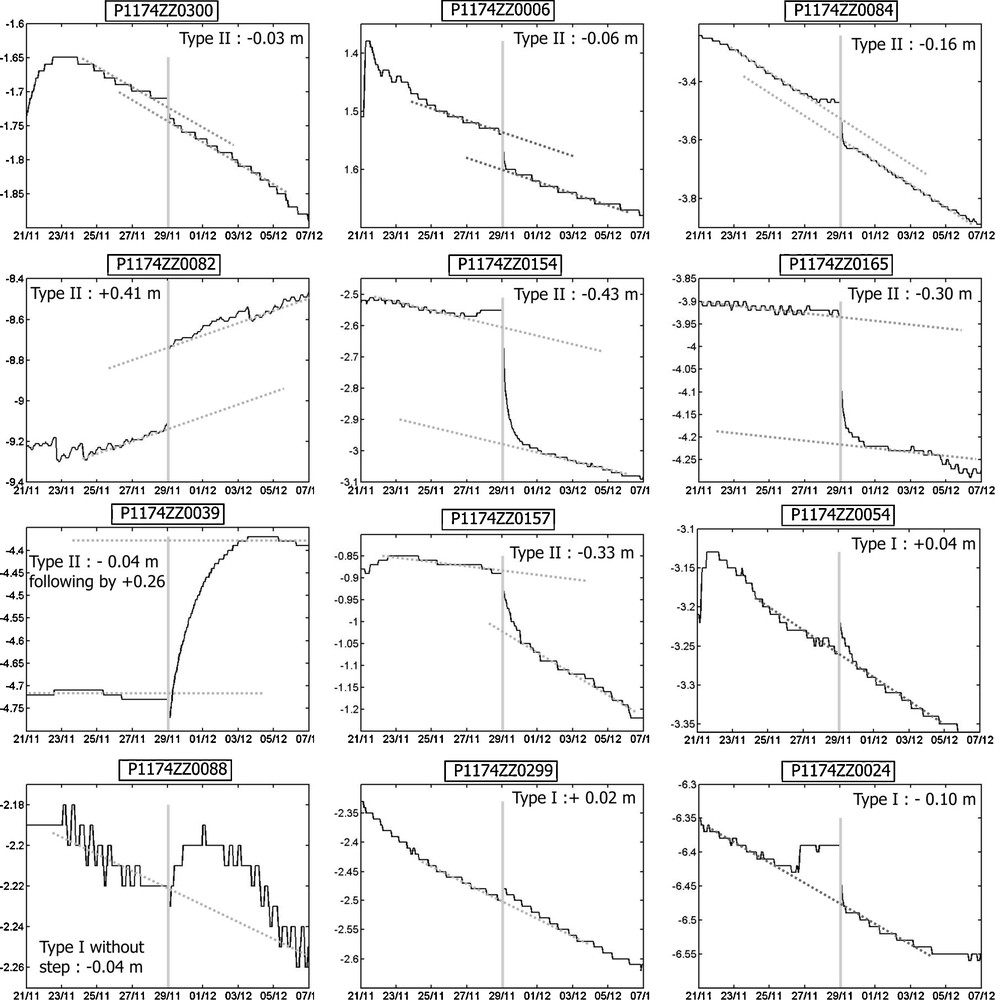
Detailed piezometric records at the boreholes where a significant reaction was monitored (see location of the piezometers in Fig. 2).
Détail des enregistrements piézométriques des piézomètres pour lesquels une variation significative a été mesurée (voir Fig. 2 pour leurs emplacements).
Piezometers that reacted to the earthquake (Table 1) are located in various geological contexts, and exclusively in shallow aquifers which are the only ones monitored in Martinique (Tables 1 and 2). Note that the permeable formations tapped by the piezometers are referred to as “aquifers” in this article even if several of them could probably not be exploited for water supply because of their low hydraulic conductivity or limited water resource. Lachassagne (2006) has reviewed the type of porosity/permeability of these aquifers, e.g. porous, fissure and/or fracture, based on the observations during drilling (Tables 1 and 2) and on piezometric signal processing (Table 3 – spectral analysis of the 5 tidal components of the water level fluctuations; Hsieh et al., 1988; Leonardi and Gavrilenko, 2004; Roeloffs, 1996); this allowed hypotheses to be made concerning the confined/unconfined nature of the aquifers. The inferred behaviour is consistent for almost all the piezometers except for piezometer 1169ZZ0006 for which the result from signal processing is considered more accurate.
5 Characterisation of the earthquake-related piezometric level fluctuations
Earthquake-related piezometric fluctuations are of three types (Leonardi et al., 1997; Manga and Wang, 2007; Montgomery and Manga, 2003; Roeloffs, 1988). Type I is characterized by a short duration change (rise or fall) of the piezometric level, followed by a return to the initial level or by a rebound in the opposite direction before returning to the initial level. Type II is characterized by a long-duration water level change. The piezograph is shifted (permanent rise or fall) but its slope remains the same. The level change may be preceded either by a fall or by a rise followed by a rebound in the opposite direction. It may also present only a sudden change of the curve slope. Type III is less common (due to the fact that it requires data with a very short time-step) and is characterized by frequency-dependent oscillations that form a hydroseismograph (an example is provided by Brodsky et al., 2003; see also http://va.water.usgs.gov/earthquakes/index.-htm). Such anomalies appear after, before, or at the time of the quake and in both near- and far-fields.
Most of the piezometric fluctuations recorded during the November 29, 2007 earthquake in Martinique (67%: 8 out of 12 records) are of Type II (Fig. 4 and Table 3). The other piezometers exhibit either Type I fluctuations or possibly Type II, but with a very small durable piezometric level change. Type III hydroseismographs, if any, were not recordable as a consequence of the 1 h time-step measurements.
Some of the four observed type-I anomalies (Fig. 4) are classical (piezometers 1168ZZ0054 and 1179ZZ0299). On the contrary, the two others are not typical: the anomaly at piezometer 1183ZZ0024 must be due to a precursor (see below), whereas at 1174ZZ0088, a specific process such as that described below (Section 7) is involved. These “classical” type-I anomalies are exclusively of low amplitude (less than 0.04 m; Fig. 4 and Table 3). They do not show any specific spatial distribution (Fig. 2). These temporary effects are generally associated with zones of low deformation, or unconfined aquifers, and/or areas of high transmissivity and high storage where the seismic hydrological signal dissipates rapidly (Leonardi et al., 1997; Roeloffs, 1996). Piezometer 1168ZZ0054 effectively taps an unconfined, porous pyroclastic aquifer (“nuées ardentes”) considered as having rather high porosity and hydraulic conductivity. As for piezometer 1168ZZ0299, it must belong to the same kind of aquifer, as the transmissivity and storativity of hyaloclastites are classically considered relatively low. Thus it is probably located in an area of weak deformation.
Logically, the largest type-II co-seismic piezometric amplitudes are observed in confined or even highly confined aquifers (Table 3). Only piezometer 1173ZZ0082 shows a high co-seismic piezometric variation (0.41 m) although it taps an unconfined aquifer. Great amplitudes can be related to a locally strong deformation and/or to a low-diffusivity aquifer subjected to irreversible type-II deformation. In fact, the amplitudes do not reveal any coherent spatial structure at the scale of the island, with the available density of piezometers.
On the contrary all the piezometers tapping unconfined relatively high-porosity pyroclastites (“nuées ardentes”), for instance in the towns of Saint Pierre (north-west) and Diamant (south-west), as well as most of those in the unconfined aquifers (10 out of 12, Table 2) did not react significantly to the quake, as opposed to most of the supposedly confined aquifers (10 out of 12) which did react significantly to the earthquake (Table 1).
These type-II piezometric anomalies always include a co-seismic step, i.e. a quasi-instantaneous change of the piezometric level (Leonardi et al., 1997; Roeloffs, 1996). It is induced by a non-elastic (irreversible) change of the properties of the aquifer (hydraulic conductivity, effective porosity) due to the earthquake. The amplitude of such a step is generally related: (i) to the intensity of the deformation in the vicinity of the well; and (ii) to the elasticity of the aquifer. It is quasi instantaneous as the deformation affects the whole reservoir; then the piezometric level asymptotically tends towards a new hydraulic equilibrium, in continuity with the co-seismic step. The duration of this asymptote is a function of the aquifer diffusivity. An irreversible piezometric decrease reveals distension (increase of the hydraulic conductivity and/or effective porosity at the scale of the aquifer) whereas an increase reveals compression (decrease of the hydraulic conductivity and/or effective porosity). A type-II irreversible piezometric decrease can be related to increased aquifer permeability as a consequence of seismic waves (see e.g. Elkhoury et al., 2006, and a synthesis by Lachassagne et al., 2011). In that case, the dynamic rather than static stress is the likely cause of the increase in permeability, due, for instance, to de-clogging of soft mineral phases precipitated in fractures.
In both types-I and -II, most of the piezometers (75%: 9 out of 12) show the effect of distension processes (initial fall of the piezometric level) and only three show an initial rise, that can be interpreted as related to compression (Fig. 2 and Table 3). However, as a consequence of the monitoring time step (1 h), some of the short duration co-seismic steps may not have been recorded.
6 Precursors
Four piezometers (of both types-I and -II) show probable precursors (Fig. 4 and Table 3).
To assess such a claim of precursors, the 15 criteria defined by Roeloffs (1988) were documented (Table 4 and the electronic supplementary material available online in which a detailed analysis of each criterion is proposed). To these criteria, an additional one related to the servicing of the piezometers was added, as “similar” precursors had been identified before the 1999 Chi-Chi earthquake (see fig 9.4 in Wang and Manga, 2010a) and had turned out to be caused by readjustment of the monitoring system.
Validation de la qualité des précurseurs sismiques selon les critères de Roeloffs (1998).
| Piezometer National Number | Criterion No | 1 | 2 | 3 | 4 | 5 | 6 | 7 | 8 | 12 | 13 | 14 | 16 | |
| Depth | Rain fall | Barom. pressure | Pumped wells | Longest avail. rec. | Measur. technique | Sampl. interval | Earth tides | Fore-shocks | Dist. from epicenter | Raw water level graph | Last servicing | |||
| Precursor | (m) | (-) | (-) | (-) | (-) | (-) | (hour) | (-) | (km) | (-) | (-) | |||
| (Y/N) | Time before the quake (h) | |||||||||||||
| 1169ZZ0084 | Y | 28 | 23 | Y | Y | N | 6/29/2006 | Float | 1 | Y | - | 18.6 | Y | 11/19/2007 |
| 1175ZZ0154 | Y | 35 | 50 | Y | Y | N | 12/2/2005 | Float | 1 | Y | - | 31.6 | Y | 9/28/2007 |
| 1177ZZ0165 | Y | 42 | 47 | Y | Y | N | 11/30/1989* | Float | 1 | Y | - | 40.9 | Y | 2/8/2007 |
| 1183ZZ0024 | Y | 56 | 34 | Y | Y | N | 11/28/2005 | Float | 1 | Y | - | 55.8 | Y | 8/24/2007 |
Three of these precursors are hardly disputable (1169ZZ0084, 1175ZZ0154, and 1183ZZ0024). All the precursors show a similar shape. They consist in a stabilization of the piezometric level (1177ZZ0165 1169ZZ0084, 1175ZZ0154) or in a significant increase of the piezometric level (1183ZZ0024, about +0.04 m) and, for most of them (except probably for 1169ZZ0084) no further discernable terrestrial tide effects. They begin approximately 30 to 75 h before the earthquake (Table 3) each at a different date. They all reveal a compression (a probable increase of the stresses) before the quake; the piezometers with this precursor then systematically show a co-seismic distension (no precursor is observed for piezometers with a co-seismic inferred compression). Piezometer 1183ZZ0024 shows a sudden 4 cm rise that initiates the precursor. This rise remains inexplicable as it does not coincide with any reported seismic event. A hypothesis may be a-seismic activity, a slow fault movement which provokes a deformation without seismic waves (Roeloffs, 2006).
Scrupulous checking of all the identified precursors (Table 4 and the electronic supplement, Part 1) (see file Supp_Material_part1.doc) allows us to consider them as reliable precursors.
7 Numerical modelling of long duration piezometric changes
Among the various piezometric reactions to the quake, some piezometers show quite a long piezometric response (at least several days) following the distensive co-seismic step (Fig. 4 and Table 3). This phenomenon is particularly obvious for piezometers 1179ZZ0039 and 1179ZZ0157 but may also be invoked for piezometers 1174ZZ0088, and probably 1175ZZ0154, 1177ZZ0165 as well as for 1168ZZ0299 (their low amplitude preventing confirmation).
The two obvious signals (1179ZZ0039 and 1179ZZ0157, Fig. 4 and Table 3) both show: a distensive co-seismic step (around −0.04 m), followed either by a regular logarithmic in shape increase (1179ZZ0039: +0.26 m) or decrease (1179ZZ00157: −0.33 m) of the piezometric level. This transient reaction is significantly longer (4 to 5 days at least) than the one following classical co-seismic steps (a few hours only, Fig. 4). Moreover, the initial co-seismic step has a low amplitude compared to the following piezometric reaction.
This signal is interpreted as purely hydraulic and reflecting a new flow, or a change in the intensity of a pre-existing flow in the aquifer as a consequence of the physical changes induced in the aquifer by the earthquake. Flow changes in or from aquifers have already been shown either directly, with piezometric drops in shallow aquifers, and/or indirectly from spring or stream discharge increase, these two phenomena being correlated or not (Rojstaczer et al., 1995; Sato et al., 1995; Tokunaga, 1999; Wang et al., 2010). Nevertheless, although the spatial distribution of groundwater-level changes in aquifers after an earthquake is documented (see e.g. the synthesis by Wang and Manga (2010b)), mostly coseismic changes were studied (Wang et al., 2010), and quantitative interpretations are required. Consequently, we propose a numerical modelling study of what happens within the concerned aquifers using the transient piezometric data.
As piezometers 1179ZZ0039 and 1179ZZ0157 are quite close to each other (2350 m), it is tempting to consider the piezometric decrease near 1179ZZ0157 and the piezometric increase near 1179ZZ0039 as part of the same process, for instance an increase in hydraulic conductivity (Section 5). Even if piezometers 1179ZZ0039 and 1179ZZ0157 cannot be considered to be situated along the same flow line, they belong to the same aquifer. Within this aquifer, piezometer 1179ZZ0157 is located upstream, only about 250 m from a potential recharge area, a hilly area where the aquifer rock outcrops, and piezometer 1179ZZ0039 downstream, about 300 m from a river, with respective piezometric levels of around 9 and 5 m amsl (Vittecoq and Dewandel, 2009; Vittecoq et al., 2008).
Consequently, in order to interpret the piezometric data, a simple numerical model representing a 1000-m long flow line, with realistic field parameters from the aquifer (Vittecoq and Dewandel, 2009; Vittecoq et al., 2010), was built with MARTHE, a 2-D finite difference code for steady and transient state aquifer modelling (Thiéry, 2010a, 2010b; Weinthalt et al., 2005). This flow line is bounded at one extremity by a prescribed head boundary (first mesh, Xcenter = 25 m, h = 100 m) and at the other extremity by a prescribed discharge boundary (last mesh). The model is presented in detail in the electronic supplement (see file Supp_Material_part2.doc).
The modelling of the piezometric signal observed at piezometer 1179ZZ0157 (Fig. 4) was done as follows: (i) Step 1: steady-state computation with the initial hydraulic conductivity/transmissivity of the aquifer; (ii) Step 2: instant increase of the hydraulic conductivity/transmissivity in the whole aquifer, with all the other parameters, including the prescribed discharge at the boundary, remaining constant; and (iii) Step 3: transient simulation until a new steady state is reached (Step 4). The result is a progressive decrease of the piezometric head from the initial steady-state constant hydraulic gradient to the lower, still constant final one (Fig. 5). As a consequence of the release of water from the aquifer, the change in the hydraulic head and gradient begins upstream and then propagates downstream (Fig. 5). Consequently, the beginning of the piezometric decrease observed at a piezometer makes it possible to estimate the location of the piezometer along the flow line. The signal observed at piezometer 1179ZZ0157 can only be fitted assuming it is located upstream in the aquifer (best fit with X = 850 to 900 m, i.e. 85 to 90% of the length of the aquifer – Fig. 6). This result is consistent with the real location of the piezometer. Then, the observed total piezometric decrease, before and after the earthquake, and its shape (piezometric decrease vs time) enables us to estimate the hydraulic conductivity increase due to the quake. This result can be obtained for any location of the piezometer, the decrease in hydraulic head within the aquifer being related to the location of the piezometer along the flow line, logically higher upstream than downstream, and nil at the prescribed head boundary. Taking into account the raw piezometric data leads us to assess the hydraulic conductivity increase as about 9% during the earthquake, with the assumption that the storage coefficient remains constant (Fig. 6). Alternatively, using roughly corrected piezometric data assuming a linear hydrologic recession curve (Fig. 6), the hydraulic conductivity increase would be of 6%. In the case of piezometer 1179ZZ0157, this increase in hydraulic conductivity is not defined accurately as the piezometric data are noisier as time increases. Consequently, the change in hydraulic conductivity of the aquifer may be lower (down to half the 9 or 6%). The computations also show that the transient piezometric response is quite long (about 10 to 30 days) and, as stated earlier, partly masked by the natural recession of the aquifer because the earthquake occurred at the end of the rainy season. This long-duration piezometric response is consistent with the diffusivity of the aquifer and with observed changes in stream discharge in other parts of the world (Manga and Wang, 2007; Rojstaczer et al., 1995; Wang et al., 2010).
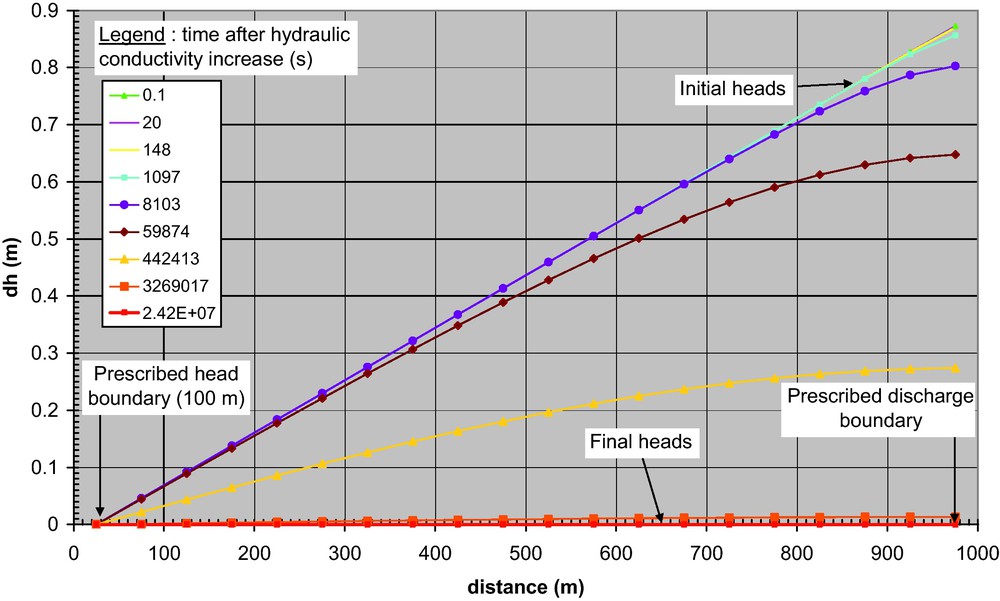
Computed hydraulic heads along the modelled flow line during the transient period after the hydraulic conductivity increase due to the earthquake (x axis: distance along the flow line; y axis: computed hydraulic head at time t minus that when a new steady state is reached).
Charges hydrauliques calculées le long de la ligne de courant simulée, pendant la période transitoire, après l’augmentation de la perméabilité due au séisme (abscisses : distance le long de la ligne de courant ; ordonnée : charges hydrauliques calculées au temps t, moins celles lorsqu’un nouveau régime permanent est atteint).
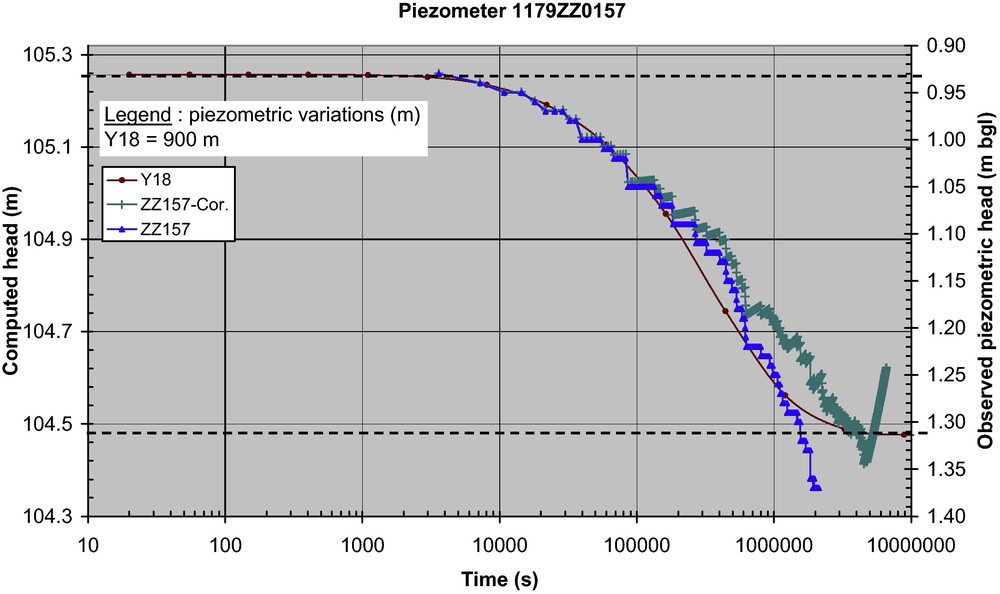
Piezometric decrease computed after the hydraulic conductivity increase due to the earthquake at the 900 m abscissa along the flow line (computed data, left y axis) and observed at piezometer 1179ZZ0157 (raw data and data corrected with a linear natural recession).
Baisse du niveau piézométrique, calculée après l’augmentation de la perméabilité due au séisme, à l’abscisse 900 m de la ligne de courant (données calculées, ordonnée gauche) et observée au piézomètre 1179ZZ0157 (données brutes et données corrigées par une récession supposée linéaire).
Such modelling never enables us to obtain a piezometric evolution with the shape such as the one observed at piezometer 1179ZZ0039 (an increase of the piezometric level probably followed by a decrease) even in the downstream part of the aquifer (Fig. 5). Decreasing the storage coefficient with all parameters remaining the same slows the piezometric decrease, as more water has to be drained from the aquifer after the earthquake. However, a piezometric level higher than the initial one is never induced in the aquifer because the increase in hydraulic conductivity during the earthquake allows an efficient draining of the excess water within the aquifer. Although inconsistent with the results obtained at piezometer 1179ZZ0039 (instant increase of the hydraulic conductivity during the earthquake), the computing of an instant hydraulic conductivity decrease during the earthquake results in a piezometric increase, but (i) much slower than the field observation, for the inferred hydrodynamic parameters of the aquifer the steady state is reached in about 2 years in the model as it is reached in only a few decades in the field, and (ii) above all without the following decrease of the piezometric level.
Consequently, another type of computation was made (Figs. 7 and 9): the same model as that presented above was used, but the instant increase in hydraulic conductivity was implemented only in the 15 upstream meshes of the model (from Xcenter = 275 m to Xcenter = 975 m), the hydraulic conductivity in the five downstream ones remaining unchanged. In this configuration, the absence of hydraulic conductivity increase downstream along the flow line creates a “dam effect” that entails a temporary piezometric level increase (Figs. 7–9). Logically, the increase of the piezometric level is maximum just upstream of the “dam” (X = 275 m); nevertheless, it also propagates beyond this limit up to X = 600 m; it decreases downstream towards the prescribed head boundary. With this modelling, a reasonably good fit of the observed data (Fig. 8) is obtained for a downstream location of the piezometer along the flow line (X = 275 to 375 m, i.e. 25 to 40% of the length of the aquifer), which is consistent not only with the location of piezometer 1179ZZ0039 in the field but also with the fact that the co-seismic step is observed at this piezometer, which is in the part of the aquifer where the hydraulic conductivity is increased. The fitting is not very sensitive to the location of the piezometer, nevertheless the piezometric rise occurs upstream later than it does downstream (Fig. 8). A better fit of the curve shape could have been obtained by acting on the hydraulic conductivity and/or the storage coefficient, but that was not the purpose here. Unfortunately, the natural recession of the piezometric level after the rainy season, and also a gap in the available data mask the last part of the piezometric response. In fact, with the date and the height of the highest piezometric level, which are available, the knowledge of the steady variation of the piezometric level would have been of great added value to precisely parametrize the observed process.

Maximum piezometric increase computed after the hydraulic conductivity increase due to the earthquake along the simulated flow line.
Augmentation maximale du niveau piézométrique, calculée après l’augmentation de la perméabilité due au séisme, le long de la ligne de courant simulée.
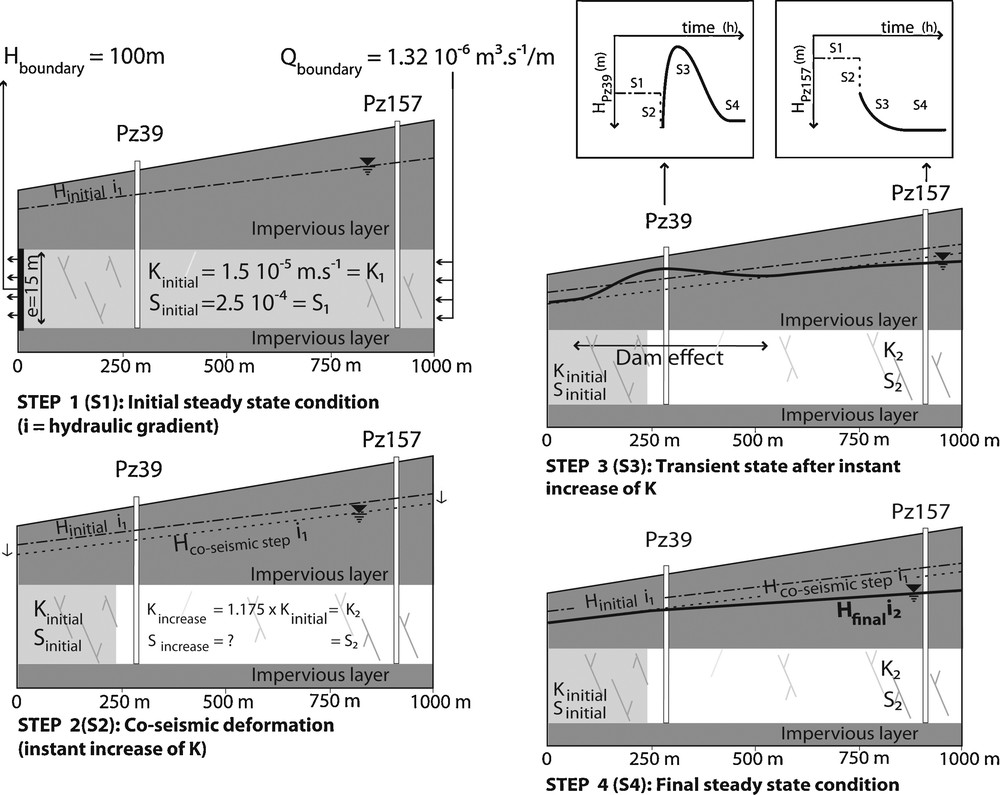
Modelling and interpretation of the long-duration piezometric changes observed at piezometers 1179ZZ0039 and 157.
Modélisation et interprétation des fluctuations piézométriques de longue durée, observées aux piézomètres 1179ZZ0039 et 157.
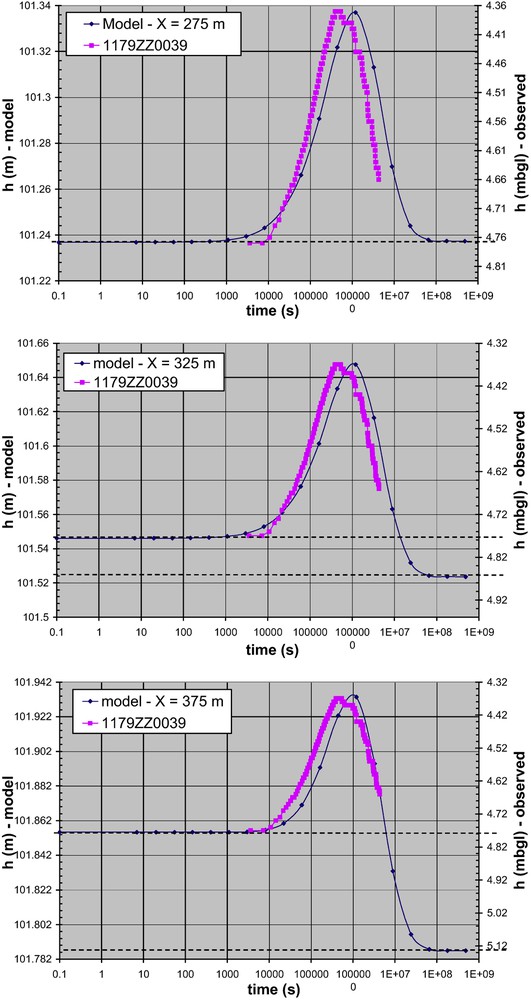
Simulated piezometric changes observed at piezometer 1179ZZ0039 and computed for three different locations of the piezometer along a flow line (Xcenter = 275 to 375 m). Note that the piezometric peak occurs later upstream than downstream, and that the increase of the irreversible piezometric level also changes from downstream to upstream.
Variations du niveau piézométrique, observées au piézomètre 1179ZZ0039 et simulées pour trois localisations différentes du piézomètre le long d’une ligne de courant (Xcentre = 275 to 375 m). Il est remarquable que l’augmentation du niveau piézométrique se produise plus tardivement en amont qu’en aval et aussi que le changement du niveau piézométrique irréversible dû au séisme augmente également de l’aval vers l’amont.
As a conclusion, it can be said that the proposed interpretation turns out to be quite sound since the same process (increase in hydraulic conductivity at the scale of a large part of the aquifer) with the same parameterization of the model explains the behaviour of the two piezometers. It appears that transitory effects may last longer than previously thought, but are masked here by the seasonal recession of the piezometric level. Moreover, such an interpretation (increase of hydraulic conductivity) is consistent with previous studies (Elkhoury et al., 2006; Rojstaczer et al., 1995).
8 Discussion
8.1 Precursors
Even if some authors (Roeloffs, 1988) regard piezometric level fluctuations as the best precursors, earthquake prevision based on sharp piezometric variations is still a matter of debate (Bernard, 1995, 2001; Hoang-Trong and Yin, 1995; Leonardi et al., 1997; Mikumo et al., 1992). Generally speaking, such predictions prove to have a low reliability, all the more so as an aquifer may react to a remote earthquake but not necessarily to a local one, or the other way round, or to one quite close but not to another equally close, according to the characteristics of both the quake and the aquifer. If predictions of earthquakes based on the piezometric network in Martinique were to be possible in the future, they should rely on several observations of piezometric precursors associated with several earthquakes. Sixty-three earthquakes of a magnitude between 4 and 5.3 occurred in Martinique between January 2005 and October 2008, and yet no reaction (apart from the 2007 quake) was observed on piezometric levels. Thus, only earthquakes of quite a large magnitude may be used to pursue such an objective.
However it is essential to carry on monitoring piezometric levels, with a minimum time step of one hour, and analysing them after each earthquake to bring new information entitling us to decide whether or not to use this type of tool as a warning system.
8.2 Aquifer hydraulic conductivity change
A plausible interpretation with a simple aquifer numerical model of fairly long-duration piezometric anomalies observed at two neighbouring piezometers (1179ZZ0157 and 0039) has been given. The proposed physical mechanism is realistic (an increase of about 5 to 10% of the hydraulic conductivity at the scale of a large part of the aquifer), and is consistent with previous studies. The inversion of such piezometric data will allow us to compute either the aquifer hydraulic conductivity increase during the earthquake or its hydrodynamic parameters (diffusivity) and its functioning (relative location of the piezometer along a flow line). It shows, in particular, that the amplitude of the piezometric change during and after the earthquake is not directly related to the earthquake intensity, but rather to the structure and hydrodynamic properties of the aquifer and also to the location of the piezometer in the aquifer along the flow line. It also shows that a piezometric increase following an earthquake cannot straightforwardly be related to a decrease in the hydraulic conductivity.
The transient piezometric changes appear to last longer (about 10 to 20 days for 1179ZZ0157; about 30 to 40 days for 1179ZZ0039) than previously thought as shown by a simple overview of the piezometric curves (a few days – Fig. 4). A transient modelling of such anomalies monitored in areas with less hydrologic noise (i.e. without a recession or with a finely modelled and corrected one, with no effective rainfall) and their comparison with stream discharge increases where available (unfortunately such data were not available in Martinique), should lead to very interesting complementary results.
The observed change in hydraulic conductivity during this earthquake is similar to those observed in other earthquakes at locations quite remote from the earthquake epicentre (from 15 to 50 km, Muir-Wood and King, 1993; Rojstaczer et al., 1995; Wang et al., 2010, who describe rather shallow earthquakes, at depth of a few tens of kilometres). This behaviour appears logical when one considers the depth of the Martinique earthquake hypocenter, and consequently the real distance between the studied aquifer and the hypocenter (about 160 km).
8.3 Structure and functioning of volcanic aquifers in Martinique
The main information concerning the aquifer structures in Martinique drawn from the interpretation of the piezometric level fluctuations caused by the earthquake is consistent with the available data: a majority of the piezometers that reacted belong to confined aquifers, whereas most of the unconfined aquifers with high transmissivity and porosity do not show seismic piezometric fluctuations.
Even if other features such as the lithology (primary porosity for instance for pyroclastites), cooling fissures (for instance in lavas) and weathering (permeability clogging) are surely the main drivers in aquifer hydraulic conductivity, this study points out that tectonics-induced processes must also be taken into account in an active geodynamical context. Processes observed during this earthquake clearly induce an increase in the hydraulic conductivity in large parts of aquifers, and trigger transient flows within them and piezometric changes. According to previous authors (see the synthesis by Lachassagne et al., 2011), the increase in hydraulic conductivity observed at piezometers 1179ZZ0157 and 0039 is quite likely the consequence of the de-clogging of soft mineral phases previously precipitated into fissures/fractures, due to the faster flow caused by the seismic waves. Nevertheless, previous studies have shown that the hydraulic conductivity returns to its initial value quite fast as a consequence of healing processes (often in a few years, see e.g. Claesson et al., 2007; Elkhoury et al., 2006; Kitagawa et al., 2002, and the review by Ingebritsen and Manning, 2010).
8.4 Consequences on the monitoring
Piezometric data acquired since 2005 are made available in a “periodic situation bulletin” with computed statistics in order to compare the actual piezometric levels with monthly and yearly averages. Considering the variations due to the earthquake at some piezometers, it will be necessary to adapt the statistical treatment in order to efficiently compare data before and after the earthquake. Aquifers for which a change in hydrodynamic parameters is suspected should thus be given special attention. Moreover, the storing of the piezometric data with a shorter time step (ideally 15 to 20 min, to allow high-frequency basic data processing) than the present one (1 day) is highly recommended. In addition to continuous monitoring, a triggered well where the sampling frequency increases to one measurement per second when an earthquake occurs would be helpful. Spring and stream flow monitoring would also be helpful, even if discharge monitoring is not as accurate as piezometric-level monitoring.
9 Conclusion
The observed piezometric-level fluctuations associated with the November 29, 2007 magnitude 7.4 earthquake in Martinique can clearly be attributed to this event. A methodology was developed for the interpretation of long-duration piezometric anomalies. It makes it possible to demonstrate that the increase of the hydraulic conductivity for the whole aquifer occurred as a consequence of the earthquake. The interpretation of these anomalies allows an in-depth study of the relationships between the earthquake mechanism and hydraulic conductivity and piezometric changes, and a better understanding of the structure and functioning of aquifers in Martinique. Even if other parameters such as lithology, cooling fissures and weathering are the main driving forces of aquifers hydraulic conductivity, this study shows that tectonics-induced processes must also be taken into account in an active geological context. Piezometric precursors of the earthquake were observed, but the practical use of such signals is yet not obvious.
Acknowledgements
The authors express their thanks to the French Ministry of Ecology (MEEDDM), the ONEMA (French national office for water and aquatic environment) and the BRGM who funded the monitoring network. D. Bertil and A. Lemoine, seismologists at BRGM, are warmly acknowledged for their critical advice on a first version of this manuscript, and A. Brugeron and S. Ollagnier (BRGM) for collecting data in the field. The constructive and detailed comments of the Associate Editor, G. de Marsily, and of the three anonymous reviewers greatly helped to improve the quality of this paper. Jacques Lachassagne and Gunilla de Marsily are particularly thanked for helping us to improve the English.