


 CC-BY 4.0
1. General introduction
Tunisia uses 80% of its national blue water resource for irrigation, which has almost reached its maximum water allocation. As for rain-fed agriculture, the green water, it plays an essential role in national food security: 65% of the national agricultural production and 80% of agricultural exports. However, blue and green water resources are still insufficient to meet the population’s food needs, and Tunisia must import foodstuffs, that contain virtual water [Allan 1998; Renault and Wallender 2000; Hoekstra 2003; Oki et al. 2003]. Previous works on water prospects in Tunisia have shown [Chahed et al. 2008; Besbes et al. 2014, 2019a] that it is necessary to evolve the water paradigm towards a holistic vision that expands water resources to include green and virtual water; and consequently redefine the issue of Water Security in climate change context.
Global Climate Models (GCMs) or Global general circulation models are currently the best tools to anticipate the future impacts of climate change. Models with biophysical and biogeochemical processes, called Earth System Models (ESMs), include land and ocean carbon cycle, atmospheric chemistry, and other biogeochemical cycles [Watanabe et al. 2011; Collins et al. 2011]. Climate Change effects [Collins et al. 2011; IPCC 2021] are fairly well predicted as far as temperature is concerned. But GCMs have some difficulty in accurately estimating precipitation, a highly heterogeneous, non-smooth, and spatially discontinuous field [Hughes and Guttorp 1994; Mandal et al. 2016]. However, to be accurate, hydrological models, which transform precipitation into runoff, need unbiased precipitation data [Mandal et al. 2016; Maraun and Widmann 2018; Bruyère et al. 2014].
Much work has recently been devoted to producing aggregated predictions obtained by applying weightings to the results of a given ensemble of GCMs [McSweeney et al. 2015; Knutti et al. 2017; Herger et al. 2018; Laurent et al. 2021; Zhang et al. 2022]. Ensembles improve the results by smoothing out the uncertainties and biases of single models’ predictions [Wang et al. 2021]. The other way to improve climate models’ predictions is sought by increasing GCMs resolution or downscaling to build Regional Climate Models (RCMs). Nevertheless, Somot et al. [2018] argue that the reference datasets used for the evaluation of GCMs are often not suitable for RCMs, and some are run using specific higher-resolution data [Fathalli et al. 2019; Somot et al. 2018; Zhang et al. 2022]. Kim et al. [2020] and Cos et al. [2022] indicate that climate model errors propagate through the RCMs to become a fundamental source of uncertainty. The issue of climate models’ uncertainties is especially concerning for impact studies at the watershed scale, for which unbiased precipitation is needed at small grids, requiring the implementation of RCMs. Many bias reduction methods have been applied in order to make climate models’ outputs suitable for impact studies [Foughali et al. 2015; Dakhlaoui et al. 2022; Switanek et al. 2022].
Studies of climate change impacts with RCMs have been developed on medium-scale catchments in the Mediterranean basin [Deidda et al. 2013; Terink et al. 2013]. Some studies use RCMs outputs to run hydrological models and simulate observed runoff. In studies on Northern Tunisia, Ensemble RCMs provide inputs of hydrological models (temperature and precipitation): four RCMs from the European program ENSEMBLES [Foughali et al. 2015] and eleven RCMs from the Euro-Cordex Project [Dakhlaoui et al. 2022]. Otherwise, GCMs outputs are also used directly in predicting environmental impacts, in particular on large areas or basins, [Ramirez-Villegas et al. 2013; Farsaniet al. 2019; Wang et al. 2021; Shokouhifar et al. 2022; Hamed et al. 2022; Li et al. 2022].
Despite uncertainties, Climate Models reveal significant impacts on the Mediterranean basin which would be among the most vulnerable regions in the world, with on average a sharp decline in rainfall and higher evapotranspiration due to the temperature increase. Countries on the southern and eastern shores are likely to be the most severely affected, resulting in an increase in food dependence [Besbeset al. 2010; de Marsily & Abarca-del-Rio 2016; de Marsily 2020]. Data analysis for Tunisia shows an increase in mean temperature of 1.2 °C over the past century; while for the same period, no significant change in mean rainfall is detected even though an increase in variability (highest standard deviation) is observed for the latest period [King et al. 2007]. With growing concerns about impacts on the future of water resources in Tunisia, more specific climate change modeling and predictions are intended, to prepare adaptation and remediation measures [AFD-MA 2021].
In the present research, we analyze the long-term effects of climate change using the predictions from CMIP6 on Northern Tunisia’s water resources, including blue and green water. The region represents the essential source of surface water, which gives it the qualifier “water tower” of Tunisia. It is also the cereal region of the country, mainly cultivated in rain-fed: it is its “attic”. Based on hydrological modeling, the analysis aims at determining the foreseeable climate change effect on the overall water resources of the northern region of Tunisia. The hydrologic model, a lumped rainfall-runoff model, is first calibrated and validated based on historical simulations, extensively confronted with field data. The simulations carried out by 30 GCMs that participated in the CMIP6 exercise provide annual chronological mean temperature and precipitation series for each sub-region (governorate). Among the various combinations of radiative forcing defined in the CMIP6 experiences, we consider the medium IPCC emission scenario SSP2-4-5, designed to prolong current trends. The analysis of these simulations on the hydrological model and comparison of their outputs to observed runoff data will lead to selecting the GCMs, the results of which fit best with observations. The couple “selected GCM-hydrologic model” is then applied in a prospective projection (2015–2100), where GCM outputs (temperature, precipitation) serve as inputs for the hydrologic Model, the outputs of which are surface runoff, aquifer recharge, and actual evapotranspiration.
GCM-hydrologic model coupling is not extensively used in the literature, considering that the bias induced by large dimensions of GCMs meshes is likely to introduce unacceptable uncertainties at the catchment areas scale. However, the downscaling alternative to GCMs usually comes with bias correction, the implementation of which is long and not devoid of uncertainty. Our objective is to explore to what extent, the direct GCM-hydrologic models’ coupling, more consistent and more accessible to interpretation, can be relevant for hydrological studies. It is to answer the following question: is it possible to predict Water Resources only with GCMs, without downscaling, and what would be the resulting uncertainties?
2. Northern Tunisia and its climate
2.1. Setting up the context: Tunisia
Tunisia has a surface area of 165,000 km2 and a population of 12 M (2020). 5 M ha are cultivated area, 11% of which can be irrigated; 4.5 M ha are rangeland and grassland; 1.6 M ha are forests and steppes; 4.7 M ha are unproductive lands (wetlands, deserts, urban areas …). Agricultural needs are covered by domestic production at 70%; the country is a net importer of food products. Due to random climatic conditions, the level of cereal self-sufficiency ranges from 15 to 60% depending on annual precipitation. Tunisia has average rainfall estimated at 37 km3/y. According to Besbes et al. [2019a], the total hydraulic resources (blue water) are 4.8 km3/y: 2.7 km3/y are surface runoff, of which 85% runs off the northern Tunisia basin. In 2010, groundwater withdrawals were estimated at 2 km3, representing an average operating rate of 95% of renewable groundwater resources estimated at 2.1 km3/y, and many aquifer systems are severely overexploited. The water resource of rain-fed agriculture (green water), available for evaporation and consumption by plants, related to arable land (5 million ha), is estimated on average at 13 km3/y, which increases to 19 km3/y when incorporating rangelands. The total blue water withdrawals were estimated at 3.0 km3 in 2015, of which 21% by municipalities, 76% by irrigation, and 3% by industries [Besbes et al. 2019a].
Extending over seven degrees of latitude, Tunisia offers a succession of hydro-climatic types: (a) humid and sub-humid in the North, (b) semi-arid and arid in central Tunisia, and (c) hyper-arid or Saharan for the entire South. These climatic types are articulated with the three major hydrological provinces (Figure 1): In the North, the reliefs, oriented SW–NE, frame the country’s most fertile plains and make this area the wettest in the country. The main river, Oued Medjerda, fully controlled by a series of large storage dams, crosses the region from west to east to unclog the North of the Tunis Gulf.
Tunisia, the three major hydrological regions, with the Northern Tunisia study area limit [from Besbes et al. 2019a].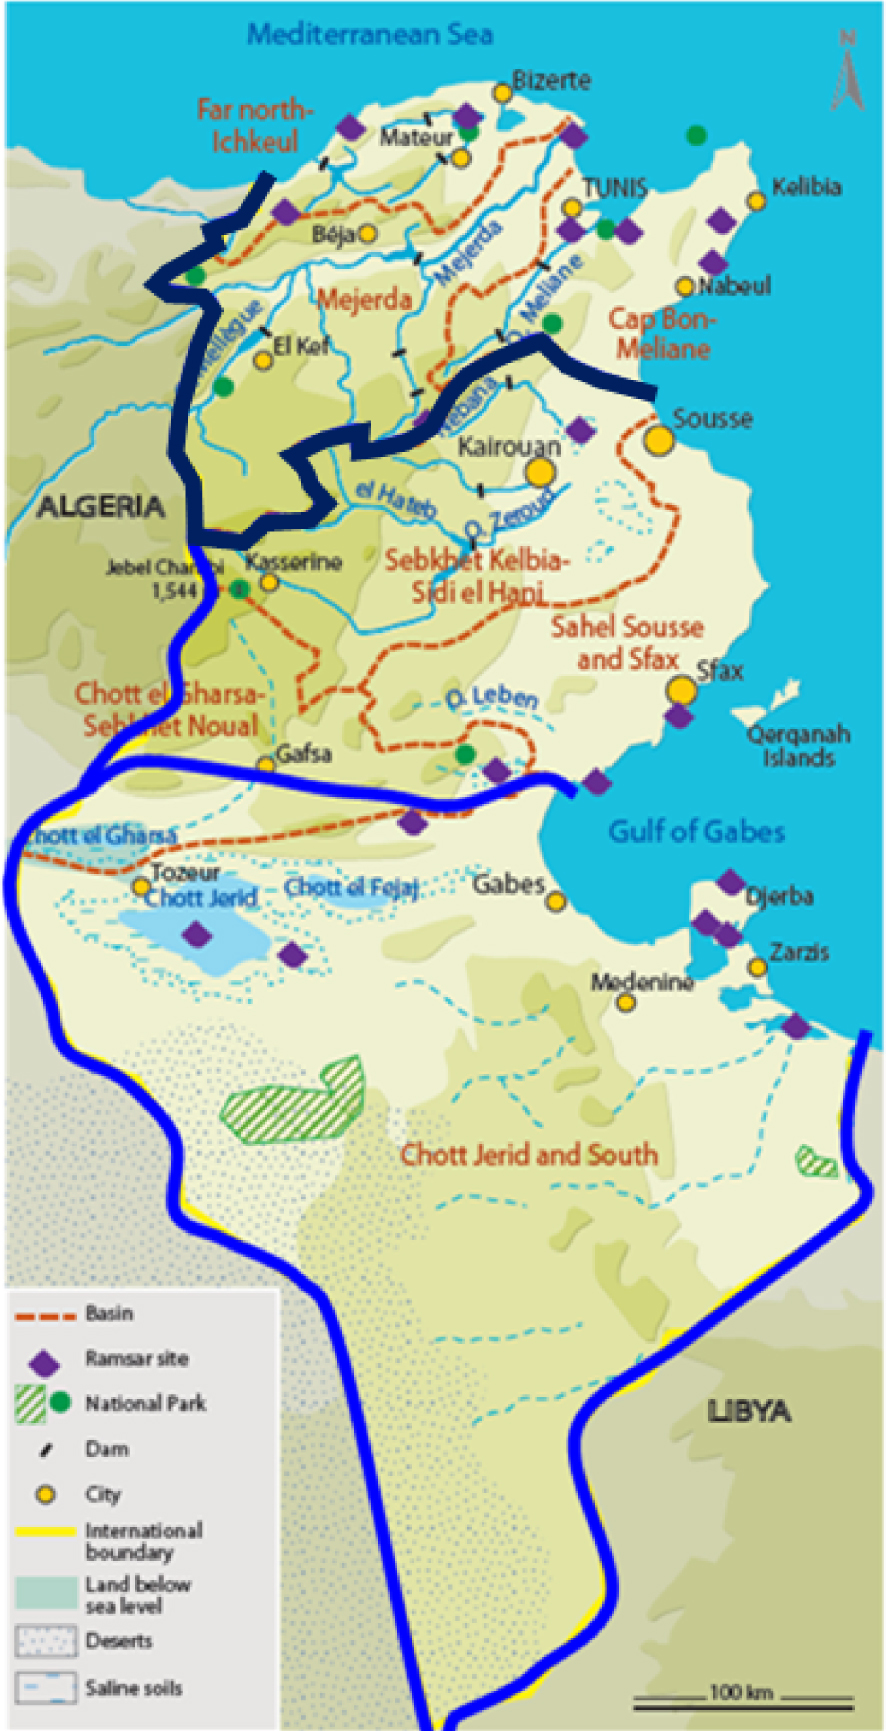
From North to South, this variety results in a range of rainfall regimes from more than 1000 mm/y in the North, up to 50 mm/y at the southern tip of the country, with an overall average of 250 mm/y. The annual average temperature for the country is 19.5 °C, which varies by region and season between 12 °C in winter and 32 °C in summer.
2.2. The study area: hydro-meteorological series and data sources
The study area, Northern Tunisia, forms an ensemble of three large hydrologic basins: Medjerda, Far North—Ichkeul and Cap Bon—Miliane (Figure 1), extending over 29,000 km2 that is 18% of the area of Tunisia. With an average rainfall estimated at 510 mm/y, Northern Tunisia receives 40% of the national average rainfall, provides more than 80% of surface water, 40% of groundwater resources, and a large part of green water, used in particular to grow cereals. The region covers 11 governorates among the 24 in the country, namely those of Tunis, Ariana, BenArous, Manouba, Bizerte, Nabeul, Beja, Jendouba, Le Kef, Siliana, Zaghouan (Figure 2).
The governorates map of Tunisia.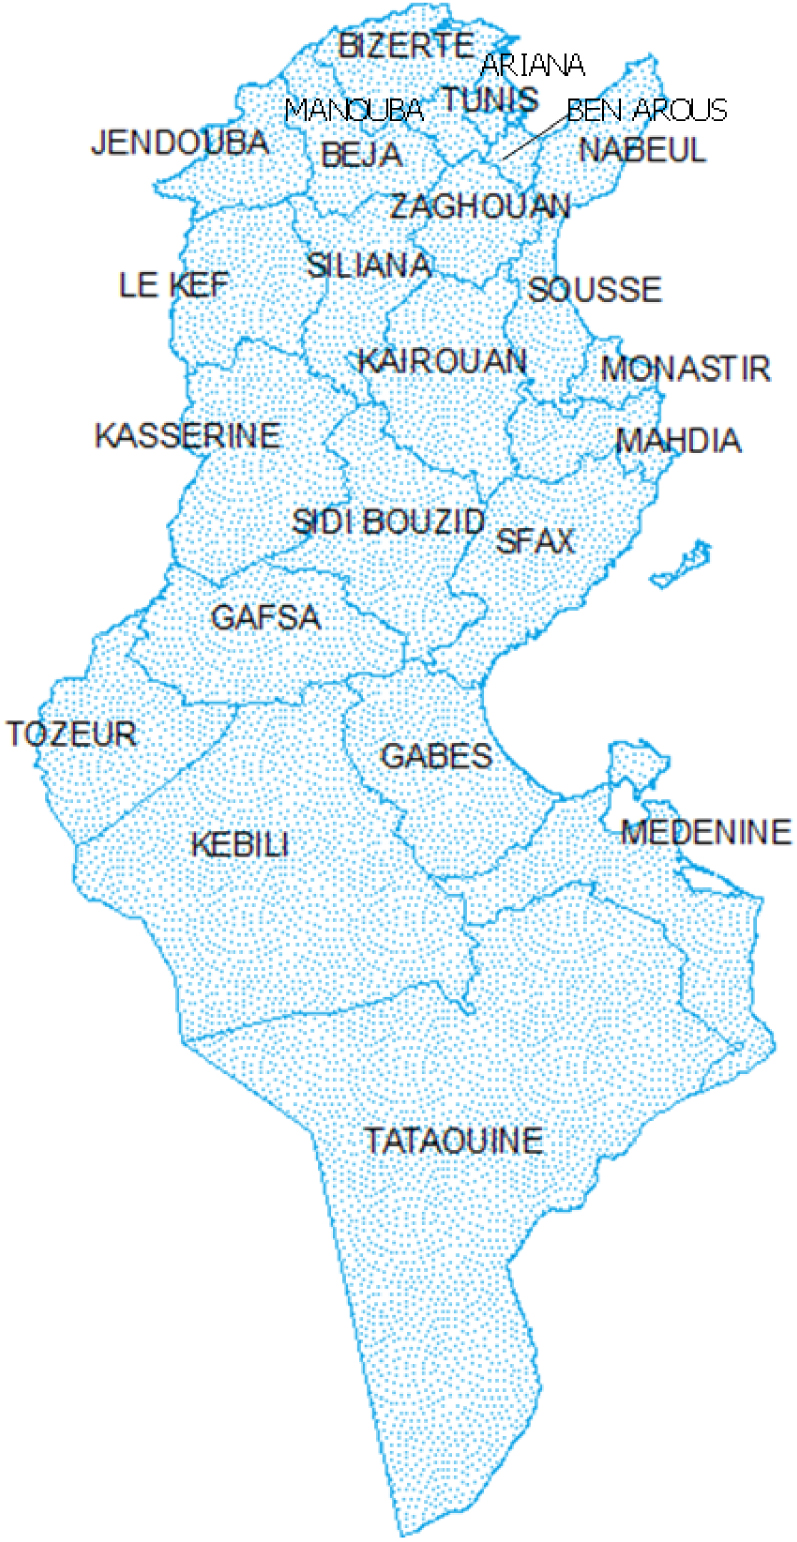
Monthly precipitation and temperature data at the national level for the 24 Tunisian governorates covering the period 1901–2020 can be downloaded from the Climate Change Knowledge Portal (CCKP) developed by the World Bank Group [WBG 2022], which data source is the Climatic Research Unit (CRU) gridded time series, presented on a 0.5° grid. These monthly time series are developed by interpolation of values derived from observational data on temperature and rainfall in thousands of reference weather stations worldwide [Harris et al. 2020]. For Tunisia in particular, the original series of monthly rainfall depth are developed, criticized, and analyzed by the Tunisian National Institute of Meteorology [INM 2022]. These data have been reanalyzed and integrated into the global networks respectively of NOAA in its global inventory [NOAA 2022], and WMO [WMO 2022]. All these databases are available to the public. Among the 7500 reference climate stations the rainfall data of which are published by the WMO, NOAA, and CRU, with historical series of more than 100 years, Tunisia has 15 rainfall reference stations, 8 of which cover (directly or in the immediate vicinity) the Northern Tunisia basin over periods exceeding one hundred years with monthly rainfall series.
Moreover, the European Centre of Medium-Range Weather Forecasts (ECMRWF) provides the last analysis ERA5 of climate variables, covering the Earth on a 30 km grid. ERA5, which combines global historical observations into estimates by improved modeling and data processing systems [Jiao et al. 2021], has been shown to be among the best-performing reanalysis products [Hersbach et al. 2020; Tarek et al. 2020; Jiang et al. 2021]. For all governorates of Northern Tunisia, the CCKP provides also historical series of precipitation 1970–2020 labeled ERA5 [WBG 2022].
Finally, the official Tunisian institution for water resources management, the General Directorate of Water Resources (DGRE, Ministry of Agriculture) has, among other missions, to maintain and develop national hydro-meteorological networks for Precipitation, Runoff, and Groundwater. The produced time series are regularly reviewed and updated. The latest update constitutes the main reference source for our case study [DGRE and Prointec-Comete 2019] and will be considered as the historical reference observations series. However, these observations show some missing values. In order to complete missing data over 1970–2020, we use the global series CRU and ERA5. Table 1 presents the statistical parameters of these series in comparison with DGRE, which indicate a better similarity between ERA5 and DGRE reference observations, so that missing observations could be filled from ERA5 series.
Statistical parameters of CRU and ERA5 vs. DGRE precipitation series for the study area
| Source of precipitation series (1970–2020) | CRU | ERA5 | DGRE |
|---|---|---|---|
| Mean value mm/y | 686 | 504 | 512 |
| Standard deviation mm/y | 136 | 108 | 107 |
| Correlation coefficient | 0.43 | 0.44 | 1 |
| Root mean square error RMSE mm/y | 217 | 110 | |
| Average relative bias | 24.9% | −1.4% |
3. Historical trends and possible future scenarios
3.1. Observed series and current trends
Northern Tunisia was subject to a significant increase in temperature over the past 50 years, with average increases of 0.5 °C per decade, a total increase of 2.5 °C since 1970, including over the northern regions (Figure 3). Annual rainfall in northern Tunisia is variable but its long-term trend has been stable since 1970 (Figure 3).
Mean annual temperature (°C) and precipitation (mm/y) in Northern Tunisia (Average values of Northern Tunisia obtained by weighting the governorates values according to their areas); data sources are: DGRE and Prointec-Comete [2019] and WBG [2022].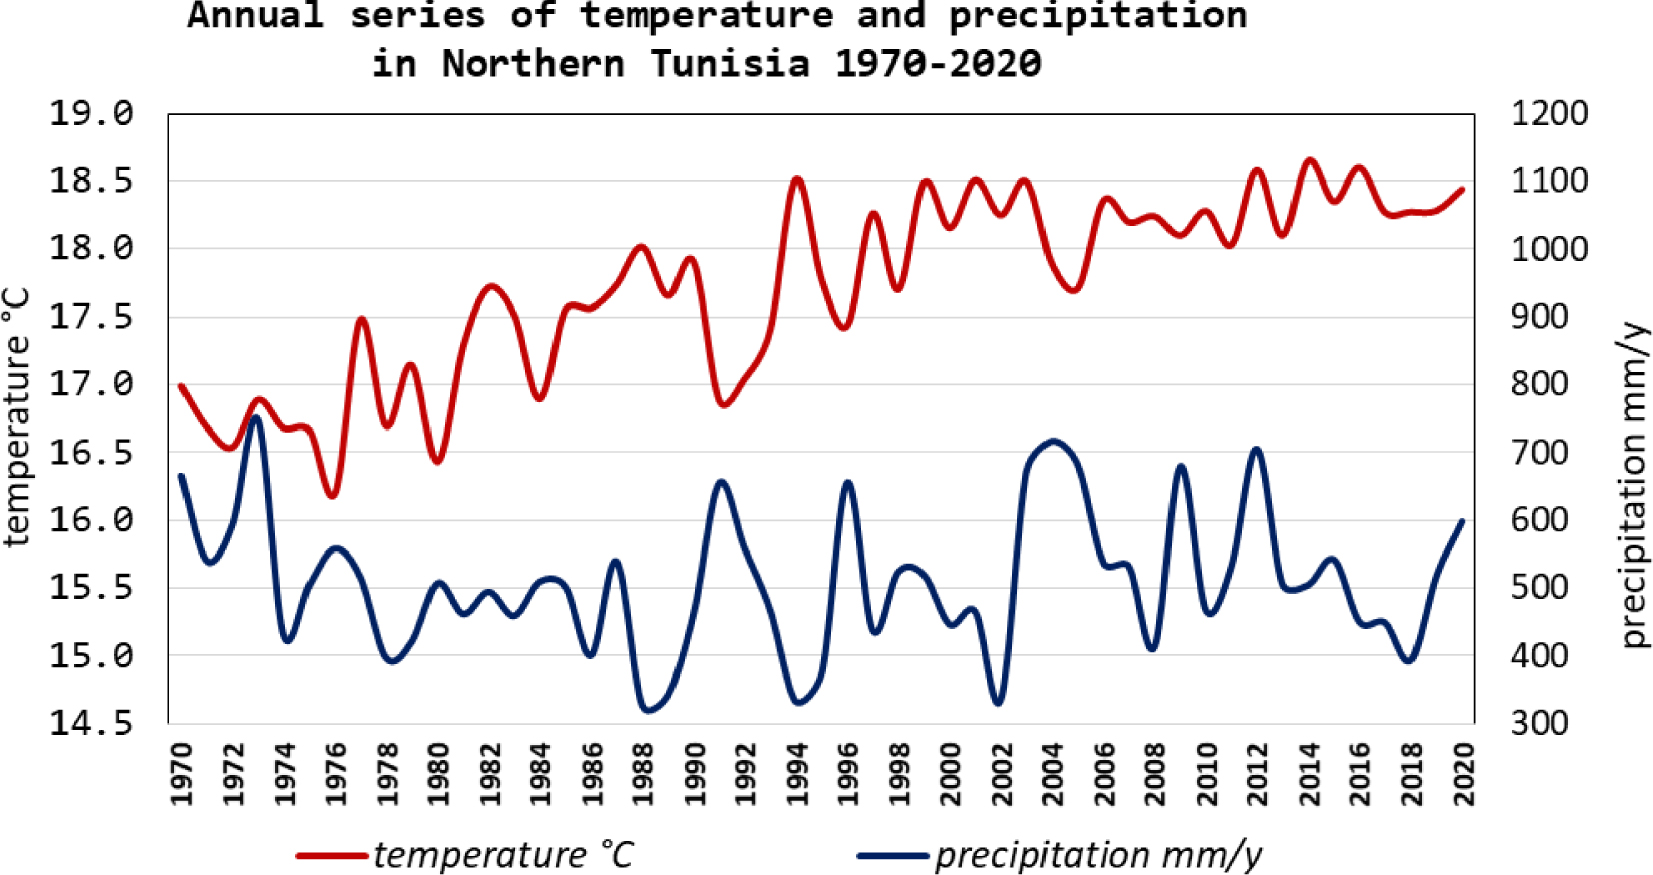
3.2. Possible climate future scenarios
The climate change community has established a scenarios framework to facilitate integrated inter-comparisons of GCMs projections. The new framework adopted in CMIP6 combines the Representative Concentration Pathways (RCPs) defined within the CMIP5 with Shared Socioeconomic Pathways (SSPs) in a Scenario Matrix Architecture [O’Neill et al. 2016; Riahi et al. 2017].
In Figure 4, each cell of the matrix indicates a combination of socioeconomic development pathway (i.e., an SSP) and climate outcome based on a particular forcing pathway. Dark blue cells indicate scenarios that will serve as the basis for climate model projections in Tier 1 of Scenario MIP; light blue cells indicate scenarios in Tier 2 (additional scenarios). For example, the trend scenario SSP2 is compatible with the forcing scenario RCP4.5 (4.5 W/m2). Scenario SSP2-4.5 represents the medium part of the range of future forcing pathways and combines intermediate societal vulnerability with an intermediate forcing level as its land use and aerosol pathways are not extreme relative to other SSPs.
SSP-RCP scenario matrix illustrating MIP (Model Intercomparison Project) simulations [adapted from O’Neill et al. 2016].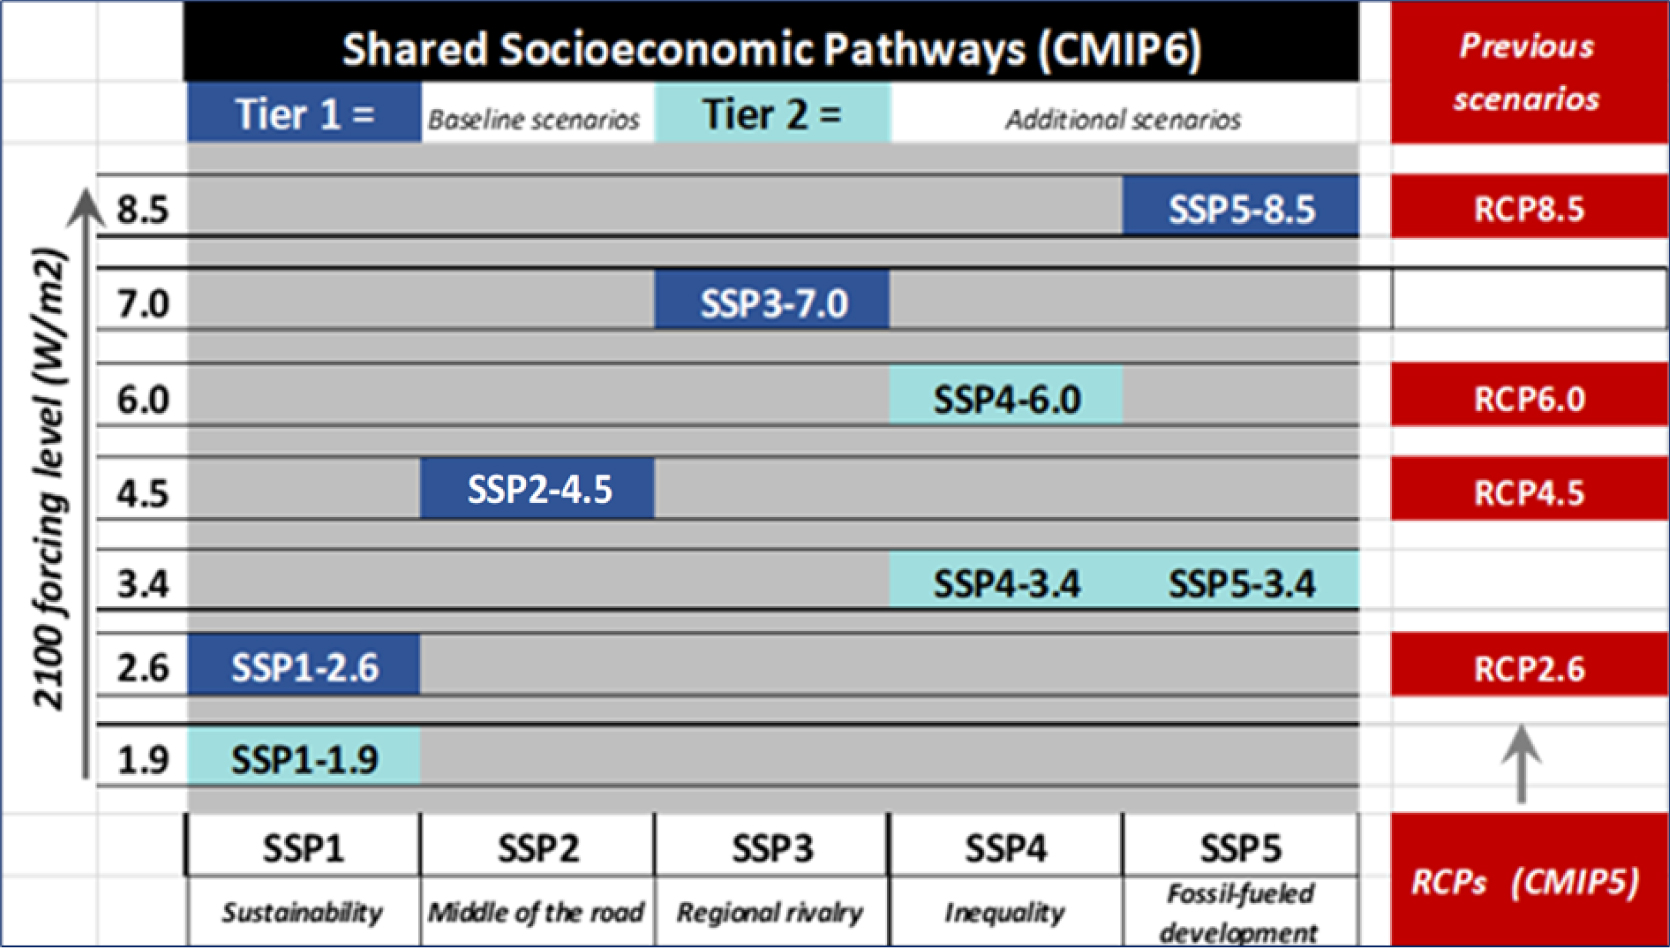
The present research aims to explore the predictability of water resources using climate outputs derived from CMIP6 ESMs’ simulations related to scenario SSP2-4.5. Within this scenario, social, economic, and technological trends do not shift markedly from historical patterns, which makes it a dynamics-as-usual scenario. Projections assume a slowdown in economic growth with average growth rates in the second half of the century [Riahi et al. 2017]. We will further investigate this scenario. In doing so, we explore a reference case that should allow an evaluation of the approach and open the way to comparative explorations of various scenarios [Fricko et al. 2017].
3.3. Climate change, climate models and projections
According to global projections, the temperature will continue to increase in Tunisia throughout the end of the century. A significant reduction in annual precipitation, with a trend of increase in the intensity of heavy rainfall events, is expected under high emissions scenarios. This will affect the water resources of the country, with the majority of projections indicating a progressive decrease in runoff and groundwater recharge [Bargaoui et al. 2014; Döll 2009; Oueslati et al. 2012; Nasr et al. 2008; Schewe et al. 2014; Slama et al. 2020].
The study carried out by AFD-MA [2021] analyzes the effects of RCP4.5 and RCP8.5 climate scenarios on Tunisia’s water resources and food security. Projections on the 2050 and 2100 horizons indicate a rise of the arid and semi-arid climatic stages towards the North and a quasi-disappearance of the humid stage by 2100. They indicate also a rise in winter temperatures, which affects crop development stages and yields, and increases water stress with a national cereal production decrease between 16% and 38% depending on the scenarios and horizons [AFD-MA 2021].
The 2021 IPCC Report [IPCC 2021] assesses results from climate models participating in the CMIP6, which include new and better representations of physical, chemical, and biological processes, as well as higher resolution. Observed warming is within the very likely range of the CMIP6 ensemble. However, some differences from observations remain, for example in regional precipitation patterns. Analysis of models’ outputs includes both historical period and future projections, as well as predictability of the climate system on various temporal and spatial scales.
The models used in CCKP-CMIP6 compilation are the following: ACCESS-CM2; ACCESS-ESM1-5; AWI-CM-1-1-MR; BCC-CSM2-MR; CAMS-CSM1-0; CANESM5; CESM2; CMCC_CM2-SR5; CMCC-ESM2; CNRM-CM6-1; CNRM-ESM2-1; EC-EARTH3; EC-EARTH3-VEG; FGOALS-G3; GFDL_ESM4; HADGEM3-GC31-II; INM-CM4-8; INM-CM5-0; IPSL_CM6A_LR; KACE-1-0-g; KIOST-ESM; MIROC-ES2I; MIROC6; MPI_ESM1-2-HR; MPI-ESM1-2-LR; MRI-ESM2; NESM3; NORESM2-LM; NORESM2-MM; TAIESM1; UKESM1-0-II.
Specific projections of Temperatures and Precipitations for Northern Tunisia: CMIP6 historical simulations are performed over different periods from 1850 to 2014. Figures 5 and 6 present the hydro-climatic outputs respectively temperatures and precipitation, resulting from the simulations relating to the ssp2.45 scenario. These are driven from the 26 models whose outputs on Northern Tunisia are exploitable and include retrospective simulations over the historical reference period (1995–2014) and prospective projections up to the end of the century (2015–2100). The figures also show data on the reference period (1970–2020): the observed temperatures (mostly reanalyzed ERA5 values) and the observed precipitations (from DGRE database). We can see that many models provide series with negative bias vis-a-vis historical temperature and precipitation series, which is well attested by the Ensemble distribution (aggregated prediction obtained by applying weightings to the results of the 26 GCMs) and in particular its median series (P50).
Observed and predicted annual Temperatures on Northern Tunisia for the CMIP6 active Models, Scenario ssp2.45, period 1970–2100 [Data from WBG 2022].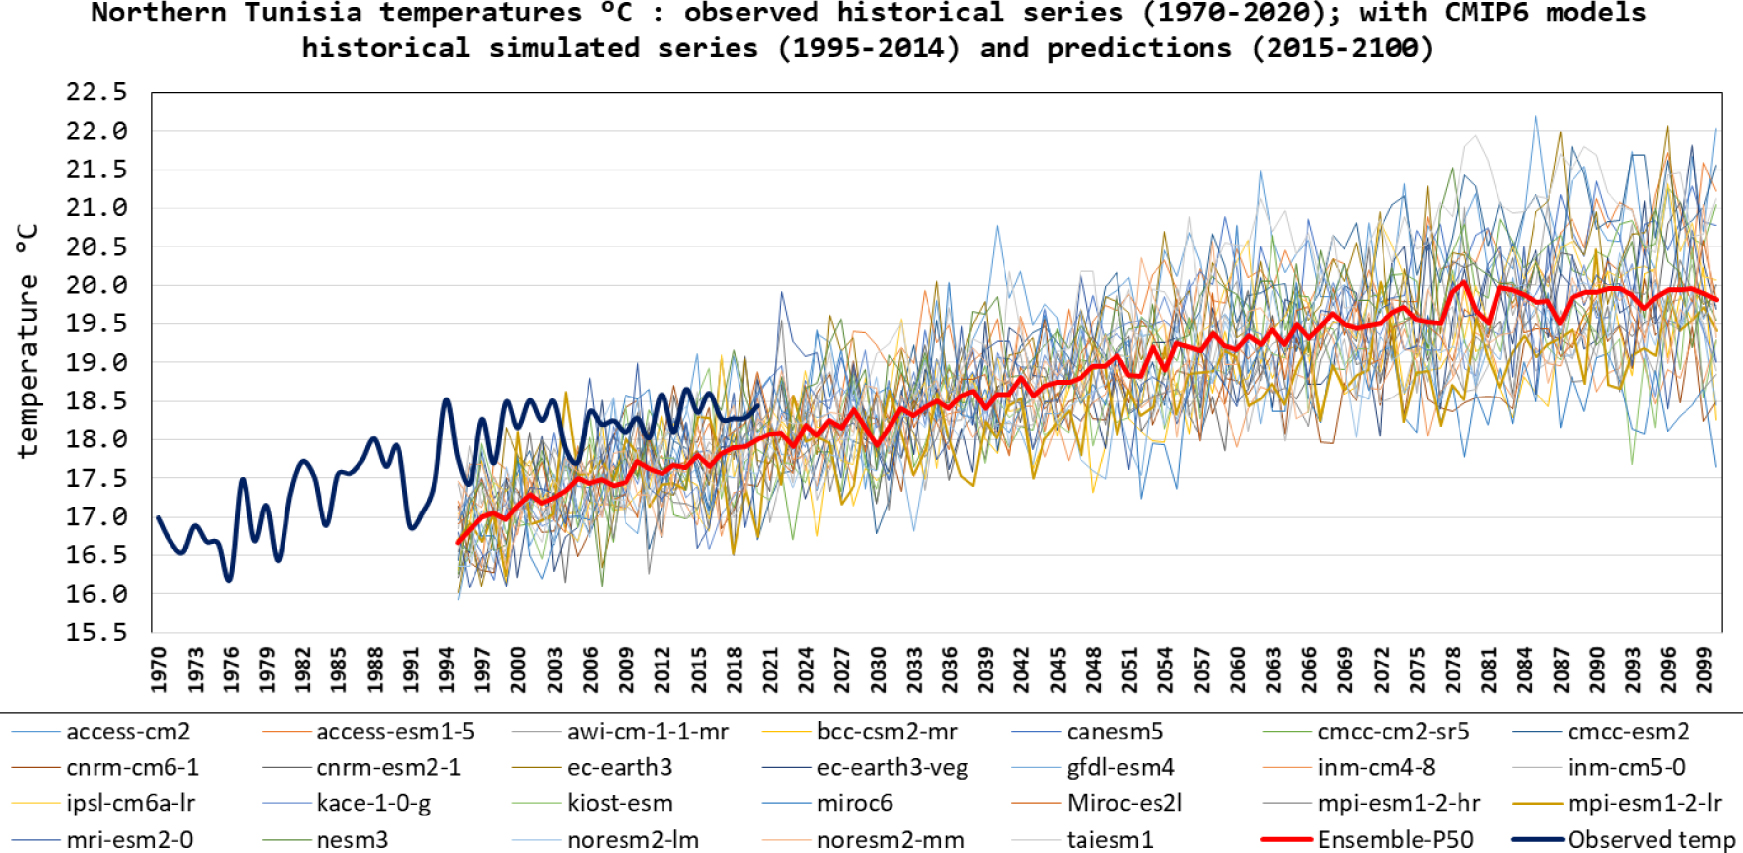
Observed and predicted annual Precipitation on Northern Tunisia for the CMIP6 active Models, Scenario ssp2.45, period 1970–2100 [Data from WBG 2022; DGRE and Prointec-Comete 2019].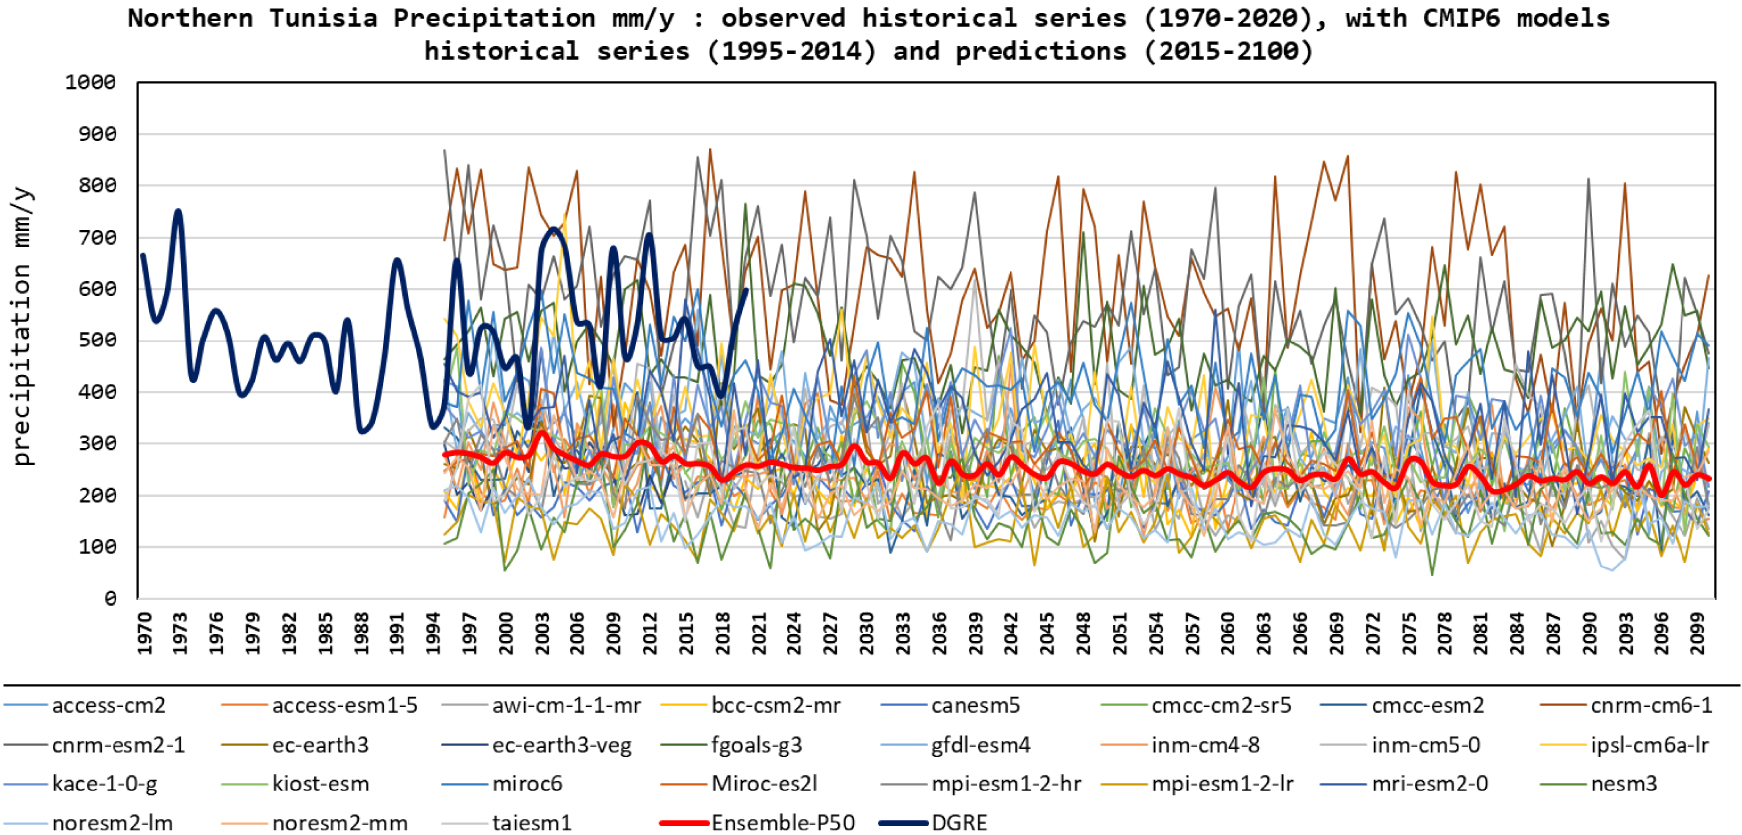
4. Modeling climate change and water resources
4.1. A model to convert precipitation into actual evapotranspiration, runoff, and groundwater recharge
From projections of temperature (T) and precipitation (P) over the next decades developed by various global climate models, we propose, with a hydrological model, to quantify the hydrological impacts of Climate Changes on Northern Tunisia and predict the future of blue and green water resources at various horizons of the 21st century.
The hydrological model is a production function type with two reservoirs: a balance reservoir and a transfer one. System inputs are precipitation and potential evapotranspiration; outputs are actual evapotranspiration, infiltration, and runoff. In semi-arid regions such as Tunisia, this type of model is operational, tested, and validated with a daily time step, but given the availability of climatic data series and the lengths of periods to simulate, we had to work on a monthly basis. On the water budget, such a time step extension results in errors that are all the greater as the climate aridity is higher [Besbes 1978]. This constraint led us to restrict our study area to the limits of Northern Tunisia climatic region. Executed in sequence, the set of equations governing the water cycle in the model reservoirs (Figure 7) are, all quantities expressed in monthly water heights:
Water balance reservoir:
- AET = Min (Rt−1 + P; PET);
- R = Min ((Rt−1 + P − AET);Rmax)
Transfer reservoir:
- F = Max ((Rt−1 + P − AET − Rmax);𝜃);
- I = Min (F, Imax);
- RU = F–I
where: AET is the Actual Evapo-Transpiration; t the time, here the month; P the precipitation; PET the Potential Evapo-Transpiration; R the soil reserve; Rmax the maximum soil reserve capacity; F the total Flow; I the infiltration (effective infiltration, or groundwater recharge); Imax the maximum infiltration capacity; RU the runoff. The two parameters Rmax and Imax need to be calibrated using the observed data.
Schematic diagram of the hydrological model.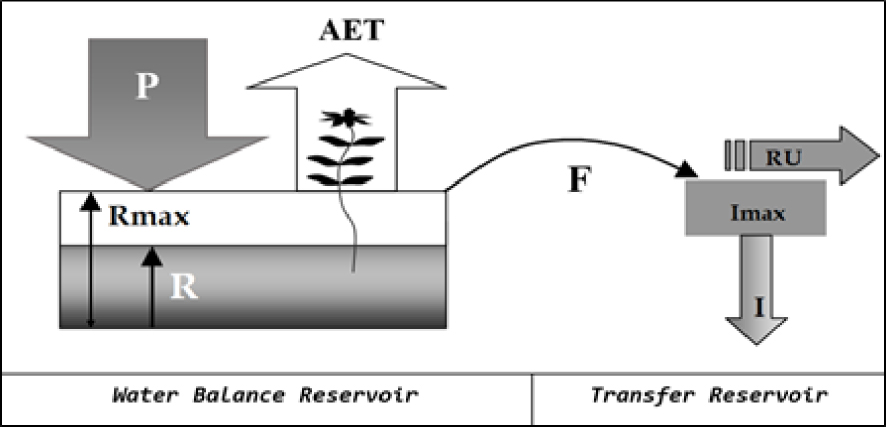
The Potential evapotranspiration is given, for temperate and Mediterranean regions, by the monthly TURC formula [Alexandris et al. 2008; Bonnet et al. 1970; McMahon et al. 2013]:
IG is the global solar radiation in cal/cm2/day (over the study region and on annual average, IG varies from 350 cal/cm2/day in Bizerte to 410 cal/cm2/day in Siliana, with a maximum in July and a minimum in January [ANME 2023]).
The study area is limited to the 11 administrative districts in the northernmost region of the country. For each of these districts, the CCKP [WBG 2022] provides monthly historical series of temperature and precipitation, which are transformed into the corresponding series of infiltration (groundwater recharge), runoff, and AET using the monthly hydrological model. The monthly outputs of the model are first integrated and converted into annual output series. The model is run separately for each of the governorates considered as lumped isolated watersheds. The general assessment is then carried out on the 11 governorates: individual annual series are integrated on space for the whole districts to build a yearly model over the entire study area. The simulated series are finally compared to observed hydrometric data.
The historical runoff data series are produced and edited by DGRE (Tunisian Ministry of Agriculture) in the Hydrological Yearbooks, which have been published regularly since the early 1980s. [DGRE 1980 −−2020]. The Yearbooks, which cover the three major hydrological basins making up the study area (Far North-Ichkeul, Medjerda, Cap Bon-Miliane, Figure 1), report on the measurements taken at the main hydrometric stations with variable frequencies but are most often formatted into daily values, then aggregated into monthly and annual values. These values do not consider the flow exchanges between Algeria and Northern Tunisia, estimated today at 100 Mm3/year on average in favor of Tunisia [BPEH 2019], nor the weak diffuse coastal runoff not monitored with hydrometric stations. In the region’s water budget, these two quantities work in opposite directions. Compared to the mean basin runoff (2.3 km3/y), we consider as a first hypothesis that these two quantities (#4%) are confined to error margins.
4.2. The hydrological model calibration process
The first step of model calibration consists to define a calibration period for which we search the optimal value of the following two parameters: Rmax the maximum soil reserve capacity, and Imax the maximum infiltration capacity. Recall that for each governorate these parameters represent spatially averaged characteristics of the whole district and are unable to be directly compared with field measurements. The second step is validation; it consists to define a validation period for which we run the model with the already calibrated parameters Rmax and Imax. The calibration period extends over 17 hydrological years, from 01/09/1985 to 31/08/2002; the validation extends over the 17 following years from 01/09/2002 to 31/08/2019 (Figure 8).
Modeled and observed yearly runoff for calibration and validation series (km3/y).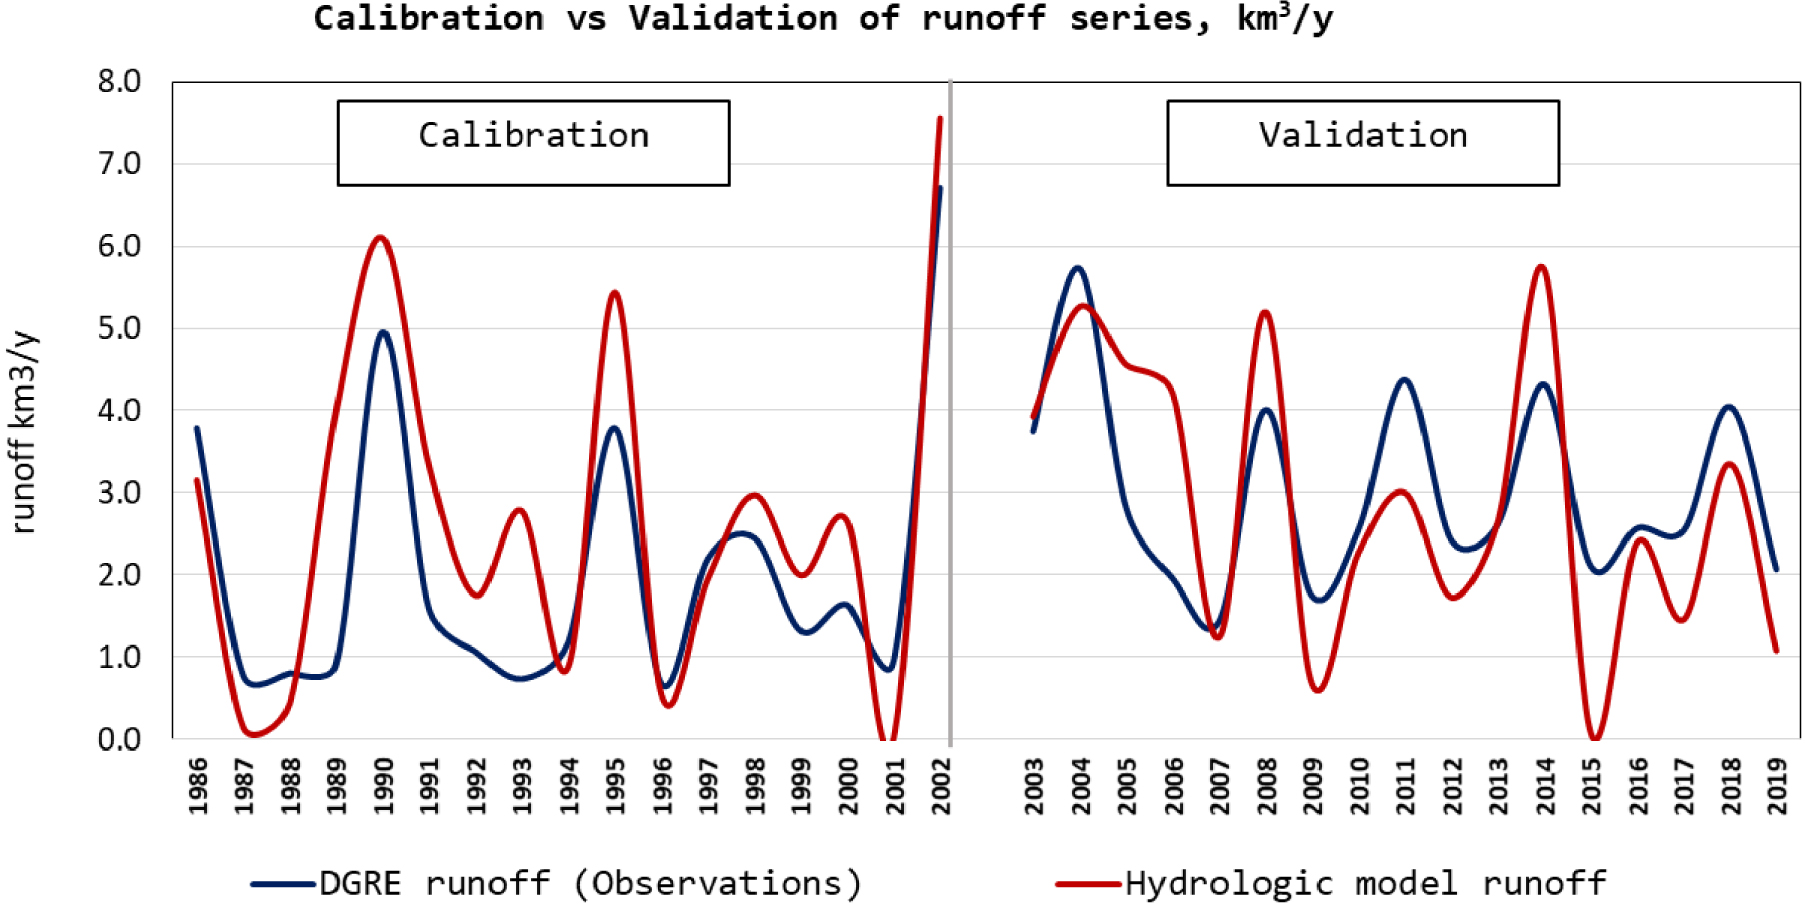
The calibration process aims to reproduce as well as possible the observed annual runoff volumes [DGRE 1980 −−2020]. As for the second major term of the hydrological resources, annual groundwater recharge, there are no direct observations or precise measurements. We must therefore refer to the most recent published field estimates [Besbes et al. 2019a].
Calibrating the model parameters:
- The maximum soil reserve capacity Rmax: the first calibration tests showed that the monthly time step operation is incompatible with the potential evapotranspiration displayed in the study region, yet one of the wettest in Tunisia. Any significant Soil Reserve Value will automatically feed into the month’s AET, leaving virtually nothing for runoff and groundwater recharge. It was only by setting Rmax to zero that the model was able to function normally, calculating quite plausible water budgets. Under similar climatic conditions, this type of model works very well daily, the monthly model is supposed to integrate the daily balances of the month. We succeeded in obtaining plausible results directly at the monthly model by introducing the artifice of Rmax = 0.
- The maximum infiltration capacity Imax: the dominant value is 10 mm/month, except in the governorates of Beja and Jendouba where Imax = 8 mm.
We assess the model calibration quality, as well as validation, by estimating: (i) the average relative bias between computed and observed runoff of the series, (ii) the correlation coefficient between modeled and observed annual runoffs; (iii) Furthermore and more specifically, our model estimates also the groundwater recharge: we then calculate the average deviation between computed and field estimated recharge. Finally, we draw a scatter plot of modeled vs. observed yearly runoff, respectively for calibration and validation series.
The hydrologic model calibration is based on a double aggregation: (a) a spatial aggregation of the outputs obtained for the eleven governorates of the study region, (b) a temporal aggregation of the monthly outputs (runoff, groundwater recharge) to build yearly series that can be compared to observed or estimated data. The results are as follows:
- The average relative bias between computed and observed annual runoff for calibration and validation yearly series establishes at respectively 22% and −5%.
- The correlation coefficients between modeled and observed annual runoffs are respectively 0.86 and 0.74.
- The average computed annual recharge for the whole series 1985–2019 is 0.68 km3/y. The average field estimated annual recharge is 0.67 km3/y [Besbes et al. 2019a]. The average deviation between computed and field-estimated recharge is 0.01 km3/y that is a relative mean deviation of 1.5%.
4.3. Selection of CMIP6 GCMs compatible with historical reference series
We have seen, Figures 5 and 6, that considering the historical reference period 1995–2014, most models exhibit a negative bias vis-à-vis historical temperature and precipitation series. We must therefore proceed to the choice of the models which are the most suitable to correctly reproduce climatic and hydrologic series for the period 1995–2014, considered as the historical reference period and for which there are simulations by all of the CMIP Models.
The selection process of the most relevant GCMs for predictive simulations follows two steps:
- The First level of selection criteria concerns the predictability of the historical temperature and precipitation series, which is evaluated by the degree of conformity of the chronological graphs and by the quality of the statistical parameters of the series. This selection was limited to precipitation (resp. Figures 9a and 9b) with criteria based on the statistical series parameters. Indeed and concerning the temperature, vis-à-vis observed values, the 30 models present series with almost identical biases, and relative biases of 5% with a standard deviation of 0.06%, which means that there is no significant difference between the series resulting from the models, which would have allowed a selection. As for precipitation (Figure 9b and Table 2), few series come close to the reference one (DGRE). According to criteria that minimize differences with DGRE, it thus appears that five GCMs give precipitation close to the observations, in particular with very low average relative biases (Table 2); these are the models cnrm-cm6-1, cnrm-esm2-1, fgoals-g3, ipsl-cm6a-lr, miroc6.
- The second level of selection criteria concerns the outputs of the hydrological model and their ability to reproduce the reference historical surface runoff and groundwater recharge. This reproducibility is assessed by the conformity of computed chronological series toward the statistical parameters of the reference series. Regarding groundwater recharge, the average field estimated value is 0.67 km3/y [Besbes et al. 2019a]. As for runoff, each of the CMIP6 GCMs generates, over the reference period 1995–2014, rainfall series used as input to the hydrological model to produce the corresponding runoff series, which is compared to the series observed by DGRE [1980 −−2020]. The hydrological results (Table 3) confirm in the first analysis those obtained on precipitation (Table 2), namely the five models: cnrm-cm6-1, cnrm-esm2-1, fgoals-g3, ipsl-cm6a-lr, miroc6, which give the best results.
Historical reference and predicted series (1995 to 2014) for annual temperature (a) and precipitation (b).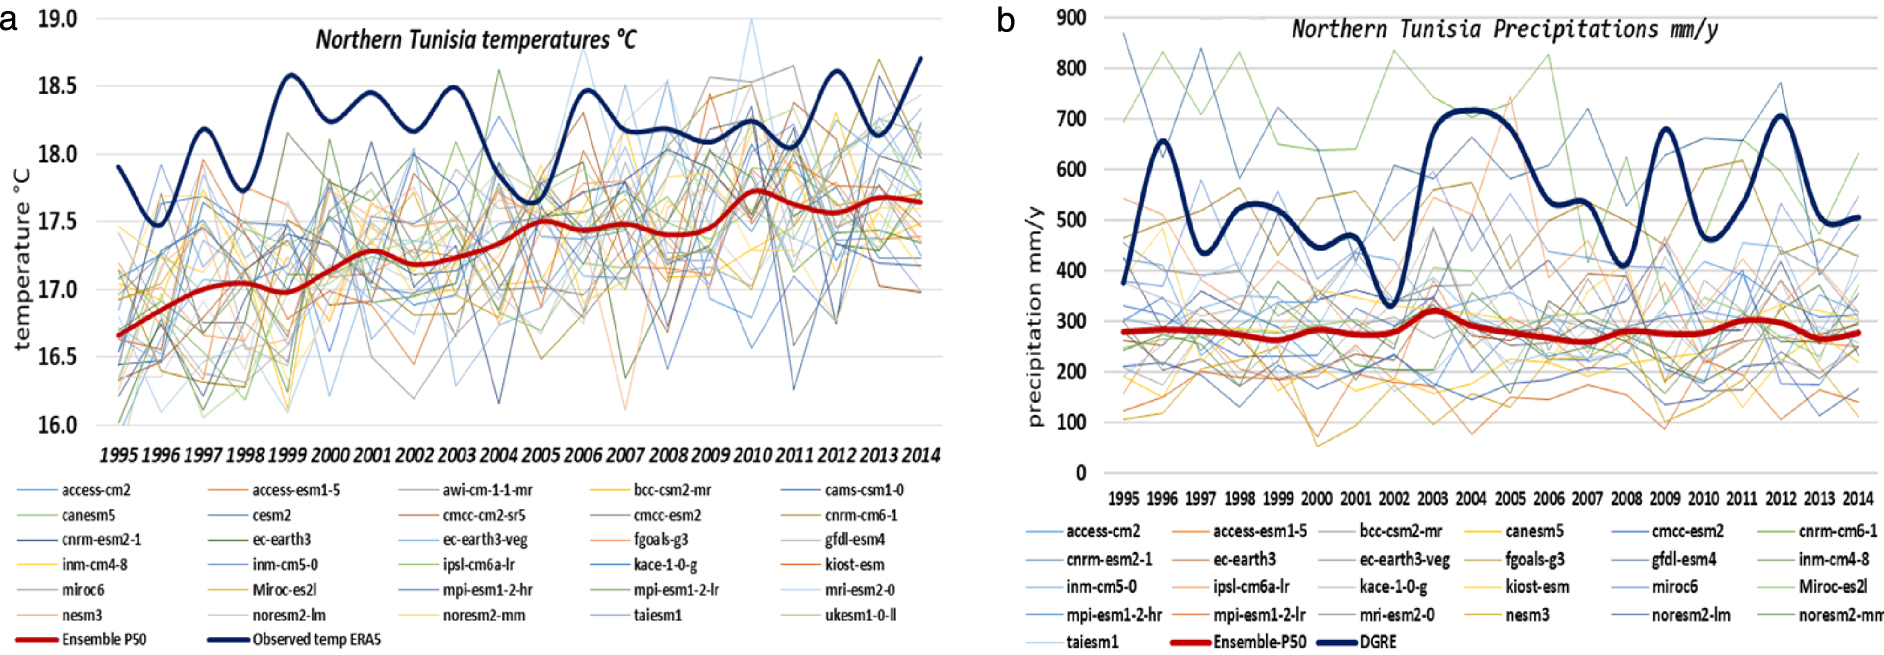
Statistical parameters of the precipitation series generated by active GCMs on 1995–2014, compared to the observed reference DGRE series
| Mean mm/y | Standard deviation mm/y | Mean bias/DGRE mm/y | Mean relative bias | |
|---|---|---|---|---|
| DGRE observed series | 554.1 | 115.4 | ||
| access-cm2 | 334.9 | 69.7 | −219.2 | −40% |
| access-esm1-5 | 251.7 | 58.7 | −302.4 | −55% |
| bcc-csm2-mr | 259.9 | 65.9 | −294.2 | −53% |
| canesm5 | 206.4 | 44.2 | −347.6 | −63% |
| cmcc-esm2 | 277.1 | 57.9 | −277.0 | −50% |
| cnrm-cm6-1 | 652.2 | 141.6 | 98.1 | 18% |
| cnrm-esm2-1 | 630.0 | 121.5 | 75.9 | 14% |
| ec-earth3 | 277.7 | 62.7 | −276.4 | −50% |
| ec-earth3-veg | 256.0 | 74.4 | −298.1 | −54% |
| fgoals-g3 | 504.6 | 62.6 | −49.5 | −9% |
| gfdl-esm4 | 364.9 | 72.8 | −189.2 | −34% |
| inm-cm4-8 | 269.3 | 62.9 | −284.7 | −51% |
| inm-cm5-0 | 339.8 | 66.6 | −214.3 | −39% |
| ipsl-cm6a-lr | 421.1 | 111.6 | −133.0 | −24% |
| kace-1-0-g | 324.8 | 71.5 | −229.3 | −41% |
| kiost-esm | 318.4 | 69.2 | −235.7 | −43% |
| miroc6 | 451.0 | 87.1 | −103.1 | −19% |
| miroc-es2l | 297.8 | 50.2 | −256.3 | −46% |
| mpi-esm1-2-hr | 272.7 | 66.1 | −281.4 | −51% |
| mpi-esm1-2-lr | 154.3 | 43.0 | −399.8 | −72% |
| mri-esm2-0 | 359.3 | 69.8 | −194.8 | −35% |
| nesm3 | 170.5 | 72.1 | −383.6 | −69% |
| noresm2-lm | 182.8 | 34.5 | −371.3 | −67% |
| noresm2-mm | 253.5 | 50.9 | −300.6 | −54% |
| taiesm1 | 252.1 | 62.7 | −302.0 | −55% |
| Ensemble-P50 | 280.4 | 14.3 | −273.7 | −49% |
Statistical parameters of runoff and groundwater recharge series generated by active GCMs on 1995–2014, compared to observed reference DGRE series
| Data DGRE | cnrm-cm6-1 | cnrm-esm2-1 | fgoals-g3 | miroc6 | ipsl-cm6a-lr | ||
|---|---|---|---|---|---|---|---|
| Runoff | Mean km3/y | 2.87 | 3.93 | 3.64 | 1.99 | 1.49 | 1.30 |
| Std deviation km3/y | 1.59 | 2.55 | 2.17 | 1.23 | 1.45 | 1.49 | |
| Mean Bias vis-à-vis DGRE | 1.06 | 0.76 | −0.88 | −1.38 | −1.58 | ||
| Mean Relative Bias | 37% | 27% | −31% | −48% | −55% | ||
| Recharge | Mean km3/y | 0.67 | 0.93 | 0.91 | 0.65 | 0.55 | 0.46 |
| Std deviation km3/y | 0.00 | 0.32 | 0.35 | 0.21 | 0.28 | 0.26 | |
| Mean Bias vis-à-vis DGRE | 0.26 | 0.24 | −0.02 | −0.12 | −0.21 | ||
| Mean Relative Bias | 39% | 36% | −3% | −18% | −31% |
But more precisely, and more particularly with regard to runoff for which there are series of reliable observations, the statistical parameters of Table 3 clearly indicate that the outputs of three models among the five selected still remain far from the reference data, either too optimistic or too pessimistic, and would therefore not guarantee sufficient reliability on the predictions. These are the models: cnrm cm6-1, ipsl-cm6a-lr, and miroc6. On the other hand, the cnrm-esm2-1 and fgoals-g3 models give results very close to the historical reference data, particularly for the runoff that they globally frame, with a respective bias of +0.76 and −0.88 km3/y. We do not find this symmetry at the groundwater recharge level, where fgoals-g3 reconstitutes the expected result on its own. However, given that we do not have direct measurements of the groundwater recharge but only an estimate from expertise, we will give greater credit to the models that best predict runoff.
5. Predicting blue and green water according to the scenario ssp2-45
5.1. Construction of a global climate model specific to Northern Tunisia
Among the CMIP6 models, the cnrm-esm2-1 and the fgoals-g3 are therefore those that best restore the series of historical runoff over Northern Tunisia; but this restitution is imperfect: the cnrm slightly overestimates the sought solution and the fgoals slightly underestimates it. We will consider that a suitable model would be a composition of the two models over the computational grid, a composite model, with a weighting α such that the composite precipitation Prc is written: Prc =α ×cnrm + (1−α) × fgoals. The same weighting is applied to temperature. To find the weighting that minimizes the difference with observations, we vary α between 0 and 1 on the rainfall series of the two models (cnrm and fgoals) for the reference historical period 1995–2014. We obtain the results presented in Table 4, where we see that there is no solution that simultaneously minimizes both the deviations in runoff and in recharge, but we can consider that the best compromise would be reached with α = 0.5. In what follows, we will call this model the “cnrm-fgoal” model.
The weighting effect on runoff and groundwater recharge results, from 100% cnrm-esm2-1 (α = 1) to 100% fgoals-3g (α = 0)
| Alpha | 1 | 0.9 | 0.8 | 0.7 | 0.6 | 0.5 | 0.4 | 0.3 | 0.2 | 0.1 | 0 |
|---|---|---|---|---|---|---|---|---|---|---|---|
| Bias on runoff km3/y | 0.76 | 0.55 | 0.34 | 0.14 | −0.04 | −0.22 | −0.37 | −0.52 | −0.65 | −0.77 | −0.88 |
| Bias on recharge km3/y | 0.24 | 0.23 | 0.20 | 0.18 | 0.16 | 0.13 | 0.10 | 0.10 | 0.04 | 0.01 | −0.02 |
5.2. Projection of blue water resources with the cnrm-fgoal model
The hydrological behavior of Northern Tunisia is simulated for the next successive situations: (i) the known period 1995–2014 considered as the historical reference period with observed precipitation and runoff series, and estimated groundwater recharge, (ii) the forecasting projection perspective covering the period 2015–2100. The three Global Climate Models: cnrm-esm2-1, fgoals-g3 and their composite “cnrm-fgoal”, are used to first simulate the hydrologic history of the basin for the reference period, and then to predict the hydrological impacts related to the ssp2-45 scenario. Figures 10 and 11 report the obtained results. The explanations and comments on these figures will be included in the summary Table 5. However, concerning both runoff and groundwater recharge, we can already observe that, after a particularly wet period that extends until 2030, the region will experience a series of dry cycles that will last until the end of the 21st century.
ssp2-45 Runoff simulation with cnrm-esm2-1, fgoals-g3, and the selected cnrm-fgoal model for historical observation period and projections.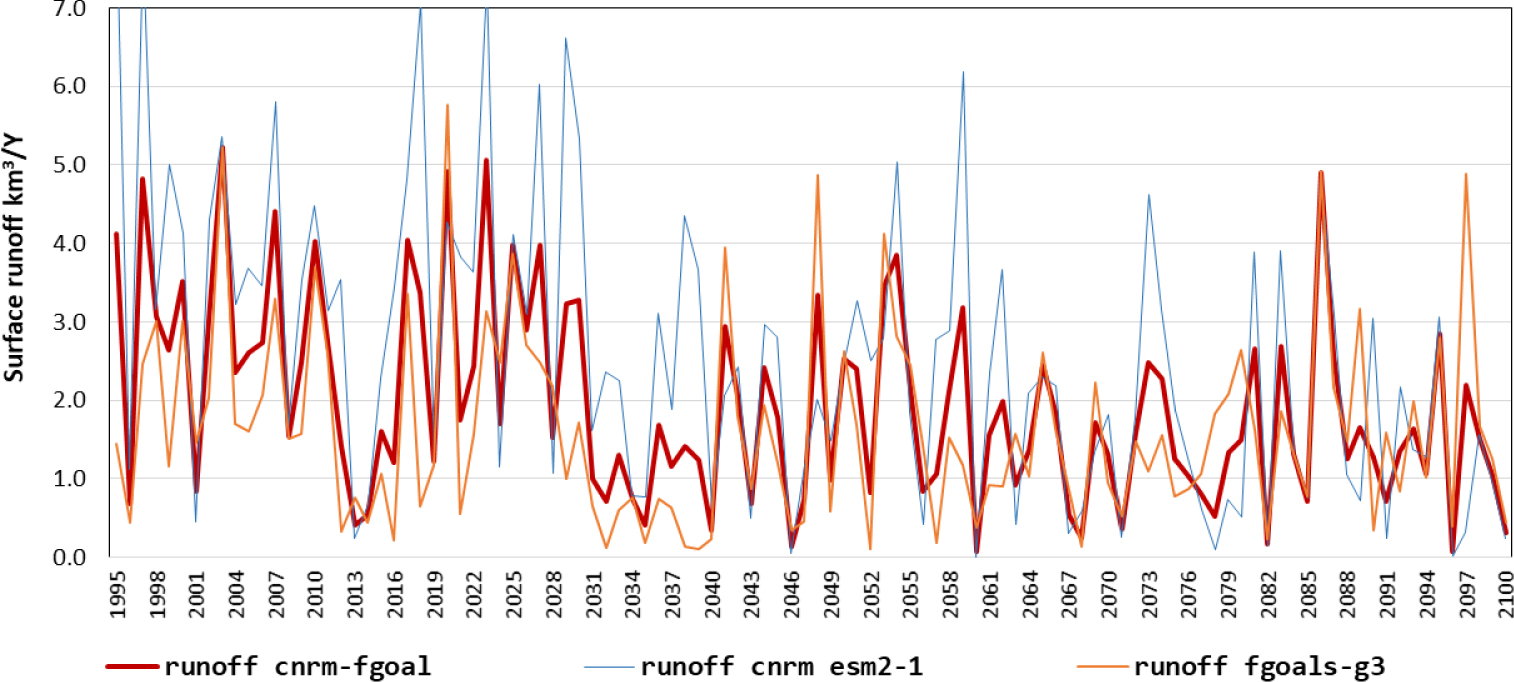
ssp2-45 Groundwater recharge simulation with cnrm-esm2-1, fgoals-g3, and the selected cnrm-fgoal model for historical observation period and projections.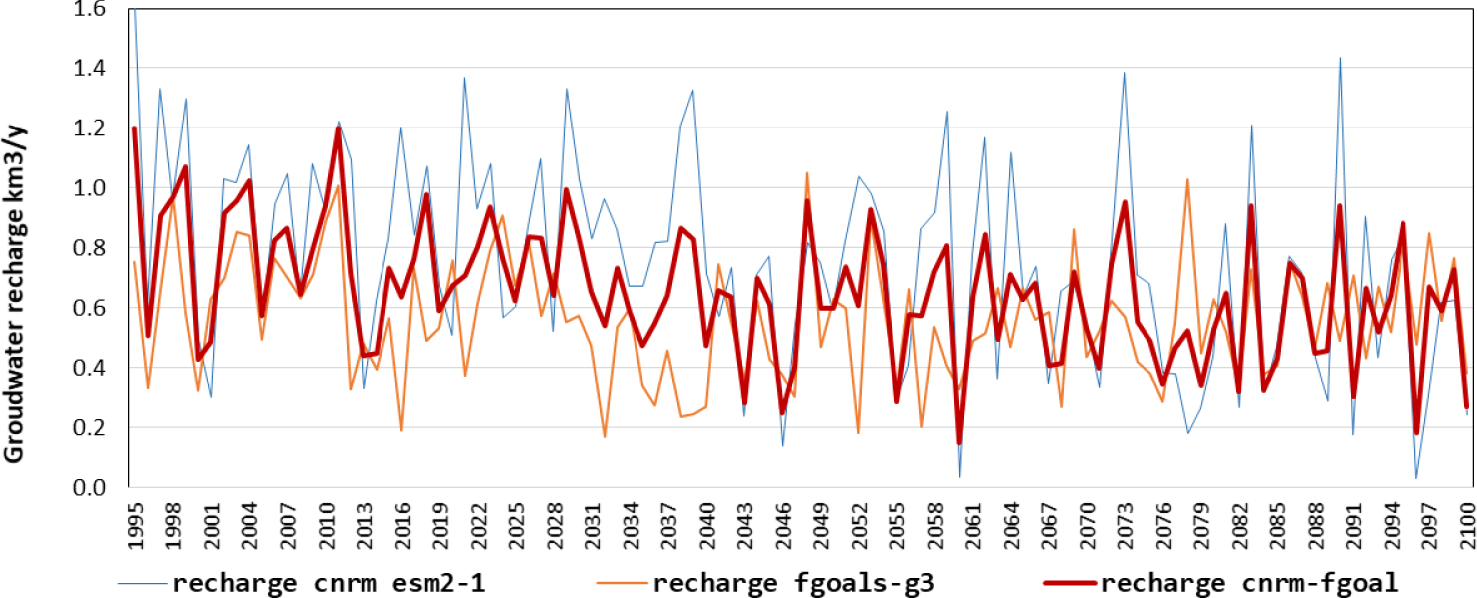
5.3. Projection of green water resources
5.3.1. The green water model: formulation and validation
The average Actual Evapotranspiration (AET) carried out by the hydrological model described above represents the ultimate potential of Green Water (GW) resources that can be extracted by plants from the soil. Only part of this potential is productive and can be converted into food production. Indeed: (i) Only part of arable land available for rainfed crops is cultivated, (ii) Evapotranspiration does not occur throughout the year, especially for annual crops such as cereals whose active period is limited in time, (iii) Cultivated area is not always entirely harvested due to possible crop failure during low rainfall episodes. The Green Water Model (GWM) is formulated on the basis of hydrological model outputs, which provide AET. To determine the productive part of GW resource, we define the rate of conversion β of the annual AET, which represents the maximum green water potential of the whole region under study (GWP), into annual GW actually used by the crops, so that we have GW = β.GWP, where GWP = A.AET, A is the yearly cultivated area. GW here is assumed to be the green water useful volume, which is proportional to agricultural production.
As for the hydrological model, the GWM is formulated for each governorate and adjusted for cereals cultivated area (8640 km2 on average) based on sub-national data from the Ministry of Agriculture [MARH, 1998–2012] and national data from FAOSTAT [FAO 2017a, b]. These data sources provide regional statistics on agricultural production from 1985 to 2020. The model outputs by governorate are integrated over the entire study region and adjusted on observations.
Figure 12 shows the relationship between the annual production of cereals (CPr) in Million Tons according to cereals’ Green Water Potential (GWP) assimilated to the total volume of AET. The slope of the least squares regression line provides the specific increase in production per unit of GWP, which amounts to 0.58 kg/m3 i.e. a specific volume of GW of 1.71 m3/kg. This value compares quite well with the water productivity of cereals in arid countries [Zimmer 2013].
Cereal production in Northern Tunisia related to Green Water Potential AET (period 1985–2019).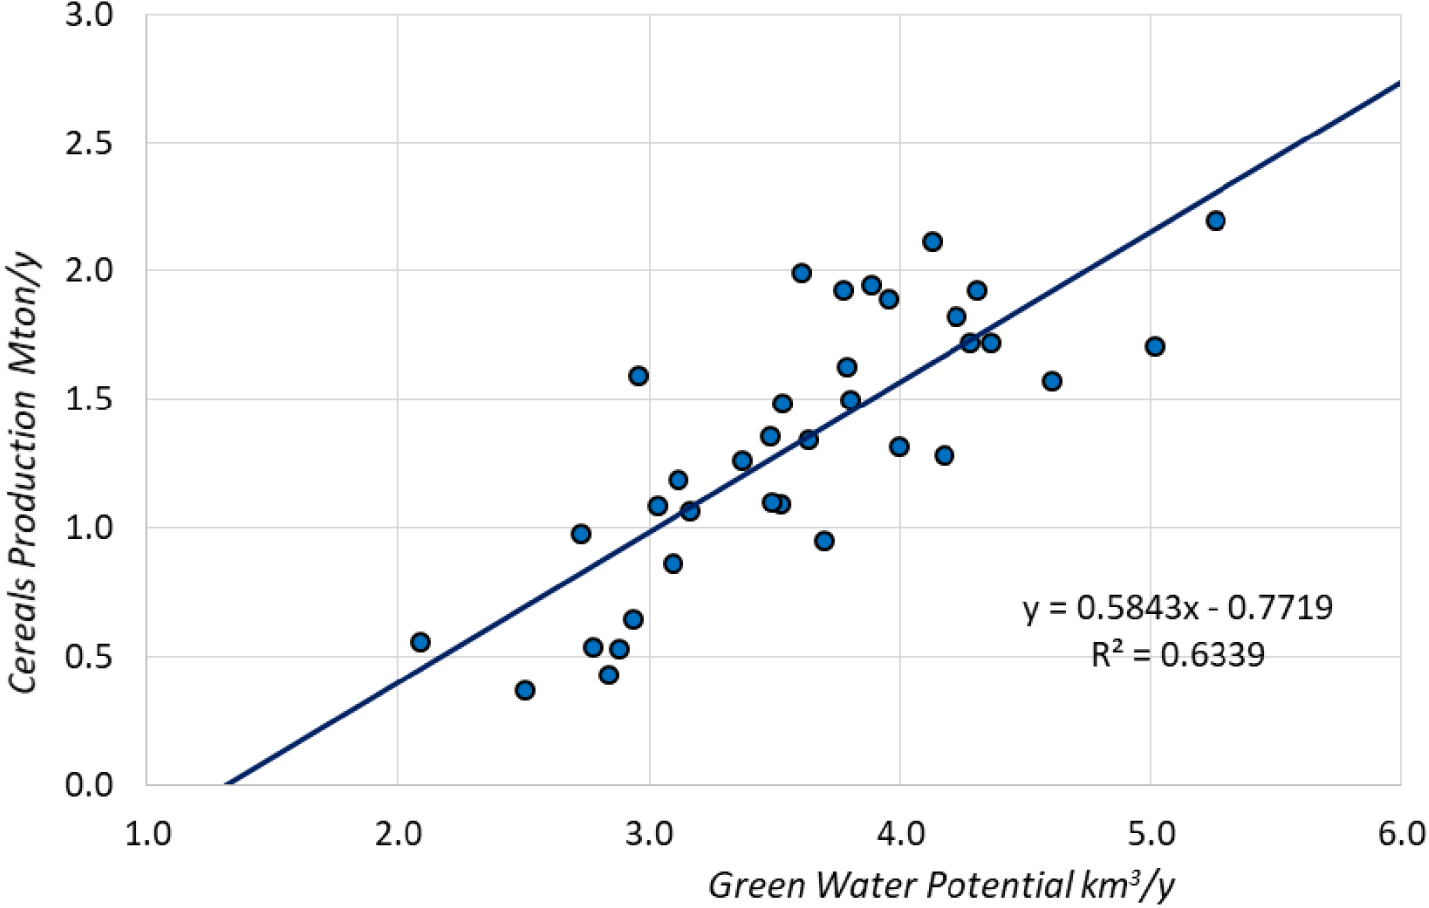
The specific volume of GW is then used to calculate the equivalent GW of annual cereal production and deduce the corresponding beta conversion rates. These are fitted using linear regression over the period 1985–2019 and presented in Figure 13, where the regression line shows a significant increase in the conversion rates of GWP into useful GW, from 0.5 to 0.7, reflecting crop yield improvement. The conversion function beta is used to generate retrospective GW amounts (Figure 13) compared to observed cereals production. Figure 13 shows that the GW volumes produced by the model manage to capture the relationship between climatic conditions and cereal production, mainly grown in rain fed conditions. During this historical reference period, GW follows the evolution of the beta factor, indicating significant yield evolution despite the stability of cereal surfaces, [Attiaoui and Boufateh 2019]. Cereals Yields improvement is not specific to the study area; it is found throughout Tunisia as well as in other Maghreb countries (Algeria and Morocco). Voluntary agricultural policies, as well as a number of incentives and favorable farming practices explain that in the case of wheat, for example, yields have doubled in twenty years [Besbes et al. 2019b].
Checking the Green Water Model over the period 1985–2019, by comparison with cereals’ water footprint (km3/y).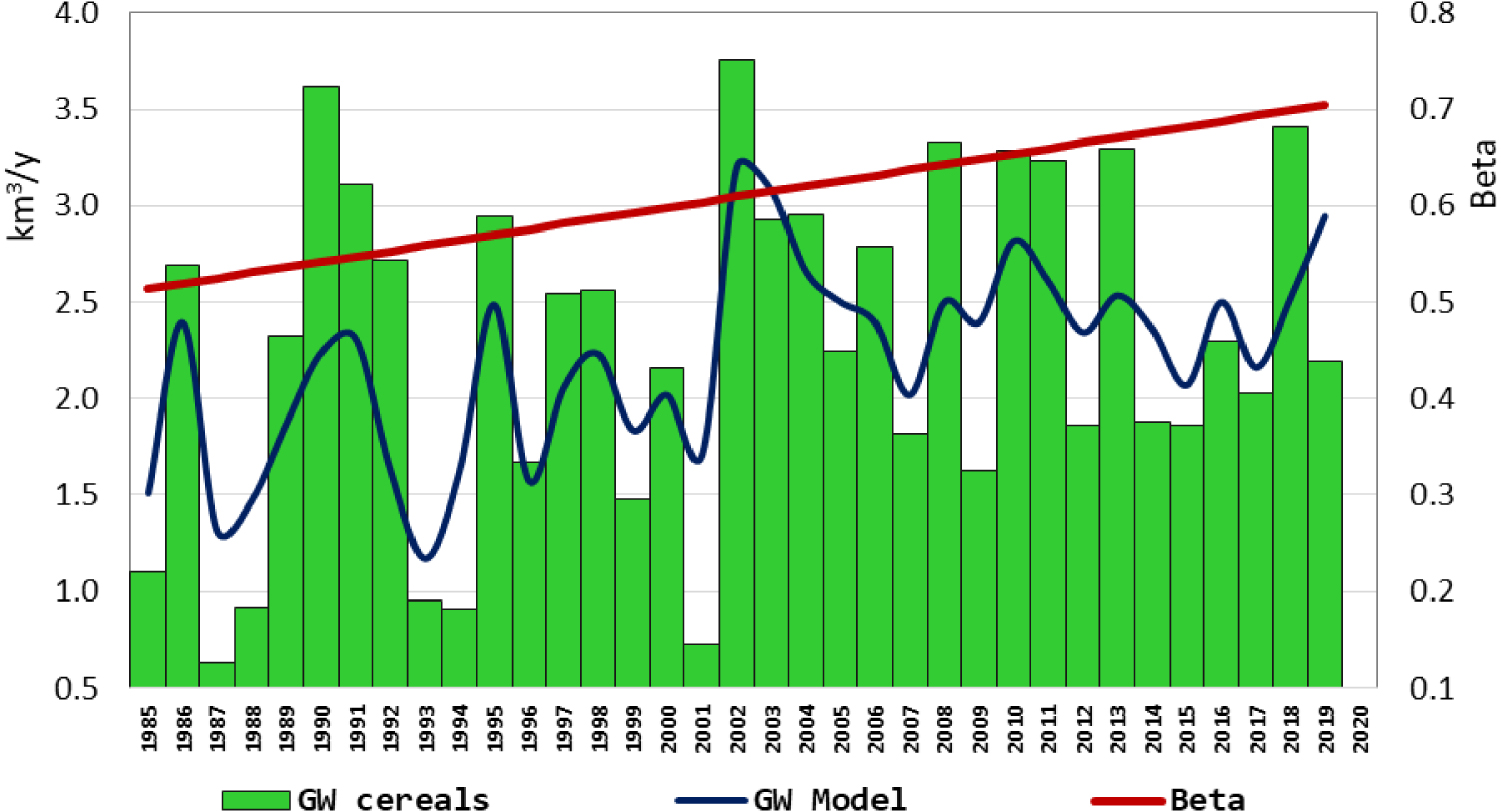
5.3.2. Simulation of the green water future with the selected models:
To make the predictive results comparable with the current situation, prospective simulations covering the period 2020–2100 were carried out with initial conditions, those prevailing in the 2010s, including crop yield and cultivated areas. For instance, the average maximum value of beta over 2011–2020 (0.68) will be kept constant throughout the prospective study period. Thus, this exercise makes it possible to examine the impacts of regional parameters predicted by Global Climatic Models on green water resources. For both blue water and green water, all calculations are carried out at the level of each of the eleven governorates, and then aggregated at the level of the entire region (Figure 14 and Table 5). Calculus uses outputs of the two GCMs cnrm-esm21 and fgoals-g3, as well as their composite cnrm-fgoal previously adjusted as part of the hydrological model.
ssp2-45 useful Green Water simulation with cnrm-esm2-1, fgoals-g3, and cnrm-fgoal for historical observation period (1995–2014) and projections (2015–2100).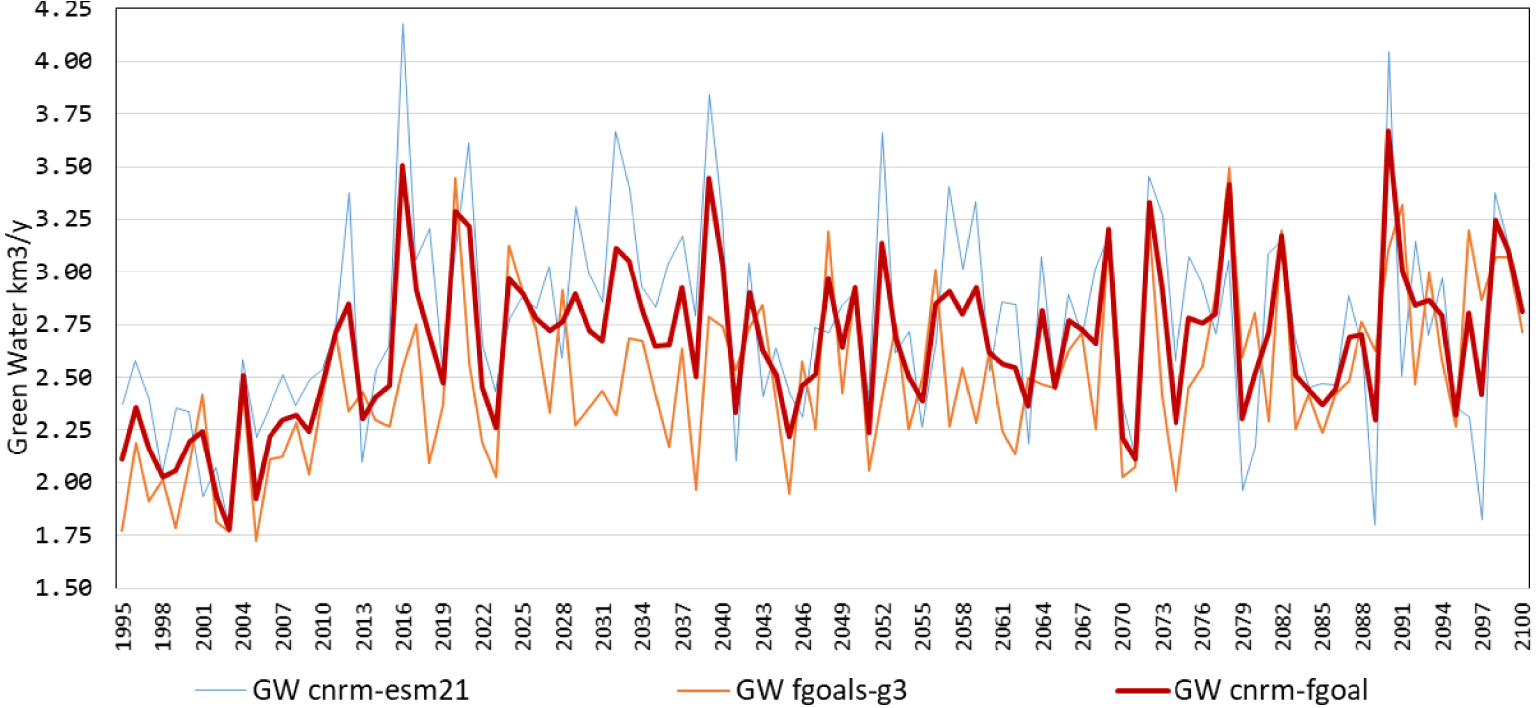
5.4. Results of water resources prediction and summary table
Table 5 is a synthetic composition intended to guide the reader. It summarizes precipitation, runoff, recharge, and green water calculated from the composite model “cnrm-fgoal”, coupled to the hydrological and the green water models, implemented over the observation and the projections periods. Here are the main points and findings:
- The decade 2011–2020 represents the historical reference state of the hydro-climatic system; it is the initial state of the projections, calculated with the model by reference to the observed state and to which any variation is related.
- We have chosen to present the general results of the study in successive sequences of 20 years, i.e. four sequences to represent the period simulated in the projections.
- A first reading of the table highlights the great fragility of blue water in relation to changes in precipitation and temperature, which is not the case for less sensitive green water. In a first analysis, this difference is probably due to the priority given to AET when modeling the water budget.
Summary table in Northern Tunisia for overall modeling with the GCM “cnrm-fgoal”, the hydrological model and the green water model
| Item/period | 2011–2020 | 2021–2040 | 2041–2060 | 2061–2080 | 2080–2100 | Summary 2021–2100 |
|---|---|---|---|---|---|---|
| Average observed precipitation (Pr) km3/y | 15.03 | |||||
| Average precipitation cnrm-fgoal km3/y | 16.23 | 15.56 | 14.53 | 14.07 | 14.69 | 14.71 |
| Difference with initial Pr % | 0% | −4% | −11% | −13% | −10% | −9% |
| Average reference temperature ERA5 °C/y | 18.30 | |||||
| Average temperature by cnrm-fgoal °C/y | 17.56 | 17.95 | 18.57 | 19.00 | 19.44 | 18.74 |
| Difference with initial temperature % | 0% | 2% | 6% | 8% | 11% | 7% |
| Average observed runoff km3/y | 3.08 | |||||
| Average runoff hydrologic model km3/y | 2.15 | 1.99 | 1.88 | 1.35 | 1.60 | 1.70 |
| Difference with initial runoff % | 0% | −7% | −13% | −37% | −26% | −21% |
| Average estimated recharge km3/y | 0.67 | |||||
| Average recharge hydrologic model km3/y | 0.72 | 0.72 | 0.59 | 0.57 | 0.57 | 0.61 |
| Difference with initial recharge % | 0% | 0% | −18% | −21% | −21% | −15% |
| Average green water harvested km3/y | 2.58 | |||||
| Average green water model km3/y | 2.67 | 2.60 | 2.44 | 2.45 | 2.53 | 2.50 |
| Difference with initial GW % | 0% | −3% | −9% | −8% | −5% | −6% |
| Total actual evapotranspiration AET km3/y | 13.37 | 12.85 | 12.06 | 12.15 | 12.52 | 12.39 |
| Difference with initial AET % | 0% | −4% | −10% | −9% | −6% | −7% |
This being so, we can note the following main results expressed in Table 5:
- Precipitation: starting from 16.33 km3/y in the 2010s, precipitation decreases to a minimum of around 14 km3/y in the 2050s and then slightly rises to 14.7 km3/year at the end of the century; this represents an average decline of 9% over the 21st Century.
- Temperatures: during the century, the average annual temperature increased by nearly 2 °C, ranging from 17.56 °C to 19.44 °C.
- With regard to runoff, it decreases on the composite model cnrm-fgoal, from 2.15 km3/y on average in the 2010s to 1.35 in the 2070s, i.e. a drop of 37%, then increases to form a century average value of 1.70 km3/y. i.e. an average drop of 21%.
- During the century, aquifers recharge went from 0.72 to 0.57 km3/y, i.e. a drop of 21%.
- With regard to Green Water, the predictive simulations for 2100 show evolutions slightly below the initial level, with a decrease of up to −6% on average.
6. Discussion
Finally, the following points should be pointed out in the form of a discussion:
- On the green water model: over the projected period 2021–2100, the temperature increases steadily. This warming results in higher water requirements for plants: (i) higher evapotranspiration demand, (ii) longer and warmer growth periods. The first factor is already effective in terms of the results obtained; indeed, the decrease in GW is small compared to that of precipitation. The second factor is not taken into account by our green water model; one can imagine that such an additional withdrawal of green water would lead to even greater decreases in runoff and recharge [Mankin et al. 2019].
- On the development of scenario ssp2.45: at the end of the 2060s (Table 5), we observe an important reduction in runoff followed by a rise. Similar results are observed in the simulations obtained from the outputs of other GCMs we analyzed, i.e. cnrm cm6-1 and miroc6. We previously attributed this phenomenon to the priority given to evapotranspiration by the hydrological model. This is partly true, but there is another reason which produces a perhaps even greater effect. Indeed: the SSP2 narrative assumes moderate global population growth with a demographic transition in the second half of the century. Population stabilization combined with sustained income growth would be accompanied by an improvement in agricultural productivity as well as in carbon and energy intensity. On the other hand, the increasing rigor of climate change mitigation is expected to decrease dependence on fossil fuels, in particular by optimizing the energy mix [Fricko et al. 2017]. All these factors are likely to reduce the effects of human activities that climate models seem to capture.
- On other studies dealing with long-term water resources prediction in Northern Tunisia:
- Precipitation forecasts with the “cnrm-fgoal” model indicate a slight change over the first half of the century, then a huge decrease with a maximum drop around the sixties (−13%). Then follows a slow recovery, bringing the average variation 2021–2100 to (−9%). These values are within orders of magnitude of previous predictions with RCM for Northern Tunisia. Under scenario RCP 4.5: Deidda et al. [2013] and Bird et al. [2016] predict a reduction of around (−17%) for 2040–2070. For the same period, Dakhlaoui et al. [2022] find an average value of (−8%) in the region, increasing to (−18%) for 2070–2100. Terink et al. [2013] announce a (−5% to −10%) for 2040–2050 and the AFD-MA study [AFD-MA 2021] predicts, for all of Tunisia, a precipitation drop of (−6% to −9%) by 2050 and (−9% to −18%) by 2100.
- Concerning runoff and under scenario RCP 4.5, Dakhlaoui et al. [2022] predict runoff reductions of (−10% to −30%) for 2040–2070 and −20% to −38% for the period 2070–2100, figures which are close to those of our present simulations, which expect reductions around −37% by 2070 and −26% by 2090.
- Consequences of green water predictions for cereal production: In line with the results of most studies in the Maghreb countries and the Mediterranean basin, rainfall is considered the crucial factor in cereals production [Zimmer 2013]. This suggests that a precipitation decline would have harmful repercussions on cereals production. According to the policy-free scenario (RCP8.5), the AFD-MA [2021] study predicts a decline of more than a third of National agricultural production by 2100. Based on statistical approaches, Attiaoui and Boufateh [2019] estimate that nationally, a 1% decrease in rainfall would result in (0.92%) decrease in cereals production in the short run and (1.295%) in the long run. These would be less marked in the more watered cereal-growing regions of the north. The authors further suggest that the increase in temperature would even have a positive effect on cereals production in these colder regions of Tunisia. Our green water model provides comparable orders of magnitude of the impact of climate change on cereals production. The predictive simulations for 2100 show an average decrease of around 6% in green water (e.g., cereals production) for an increase in temperature of 7% and a decrease in precipitation of 9%. It is as if the effects of the increase in temperature and the decrease in precipitation compensate for each other to produce smaller changes in the predicted AETs and thus in crops productions, albeit the conversion rates and cultivated areas, which are considered constant.
In sum, the results of the simulations predict an increase in temperature accompanied by a long-term decrease in precipitation. The implications of these predictions on Green Water are less significant than on Blue Water. This is an essential finding of this research that reinforces the previous analyzes showing the weight and the paramount role of green water in the national water budget [Besbes et al. 2019a]. These findings, their deepening, monitoring and possibly updating constitute essential information to guide the development of adaptation strategies compatible with the future potential of water resources in all their forms and for each region.
7. Conclusion
The simulations carried out by the GCMs that participated in the CMIP6 exercise provide temperature and precipitation series for the study area. We considered in this study the IPCC medium scenario SSP2-4-5, designed to prolong current trends. Analysis of the thirty GCMs used in the research led to the selection of only two GCMs (cnrm-esm2.1, fgoals-g3) whose outputs: (i) are the closest to the observed historical temperature and precipitation series but imperfectly, (ii) applied as inputs to the hydrological model, generate outputs that frame the observed runoff series. The modeling systems’ runoff outputs are weighted to fit observations and build a composite best-fit model: the “cnrm-fgoal” weighted at 0.5–0.5 for the prospective hydrological simulations until 2100.
Inputs and outputs of the cnrm-fgoal composite model indicate slight alterations of water resources until the forties, then a huge alteration from the middle of the 21st century and a maximum drop in the sixties, with a significant drop in precipitation (−13%), runoff (−37%), groundwater recharge (−21%) and Green Water (−8%). Subsequently, we note a recovery in all indicators, so that the average variation over most of the 21st century, from 2021 to 2100, will be a decrease of −9% for precipitation, −21% for runoff, −15% for recharge, and −6% for Green Water.
To our initial question, stated as follows: can we predict Water Resources only with GCMs, without downscaling, the results obtained in the present study show that the use of the raw predictions of original climate models for hydrological modeling purposes on large basins is possible. Simulations at these scales appear to provide relative precisions comparable to what has been produced in Northen Tunisia by Regional Models applied to small/moderate basins after inputs bias corrections.
The direct implementation of climate predictions for hydrological studies is fundamentally based on a rigorous selection of suitable climate models for the region, carried out based on an exhaustive analysis of the historical simulations of the climatic models and their comparison with observed data on the same periods. This requires that reliable and complete hydrological data are available on spatiotemporal scales compatible with those of climate simulations.
Conflicts of interest
Authors have no conflict of interest to declare.