


 CC-BY 4.0
1. Introduction
Reservoir system architecture and heterogeneities, that are controlled by stratigraphic framework and sedimentological trends, are difficult to predict, particularly when all knowledge is derived from scattered boreholes and 2D seismic data. Obviously, modeling procedures are more intricate when it comes to drawing the geological configuration at a regional and local scale and to unraveling the stratigraphic/structural pattern of sedimentary sequences. Such a 3D structural model of the subsurface provides further imperative tools that help efficiently, to (i) gain a better understanding of the stratigraphic framework, the structural setting and the reservoir discontinuities and heterogeneities, (ii) quantify dynamic processes, (iii) assess natural georesources and (iv) make the most appropriate decisions. de Marsily et al. [1992] affirmed, “We claim that the model helps us today to take the best engineering decisions, and the better the “verification” of the model, the better the “validation” of the model, and, therefore, the better the decision”.
On the other hand, the challenges in regional investigations and modeling come, mainly from the size and the quality of the data to gather and visualize. Typically, such data are limited, discrete, derived from various sources, and heterogenous, associating one or several scalar values to a set of points in space. Additionally, we suppose that, within each of these regional sequences, the facies and stacking patterns of the reservoir formations, are tectonically controlled, consequently, each of them contains a distinct set of features, that is indigenous to its position within the basin compartments [Mariethoz and Lefebvre 2014; Caumon et al. 2016]. Uncertainties are usually inherent to these local and regional trend variabilities of the geological phenomena and to the limited size and resolution of datasets [Chilès and Delfiner 2012; Wellmann and Caumon 2018].
Geostatistics can be used to quantify and reduce uncertainties through (i) its basic tool the variogram that underlies the variability structure and shows sharp changes in the rock properties (bounding surfaces elevations, rock types, hydraulic parameters …); and (ii) additional suitable algorithms that allow integration and homogenization of multisource data, and more importantly introducing geological knowledge and concepts in the modeling procedures [Ravenne 2002a, b; Linde et al. 2015; Caumon et al. 2016; Chihi 2021].
The main motivation of our work is to provide efficient tools to describe, at both regional and local scales, the geometry and extent of the main reservoir formations of the Jeffara basin in southeastern Tunisia (Figure 1). The strata located in the Jurassic-Quaternary interval of the Jeffara basin show a significant degree of variability in sedimentary facies, leading to the occurrence of local, either carbonate or siliciclastic, reservoirs (of water resources and hydrocarbons) or seals.
Major domains of the study area (a). Regional geological map, showing the main geological outcrops around the Jeffara basin and the data location (b). Synthetic regional lithostratigraphic chart and major petroleum and water reservoir formations (c).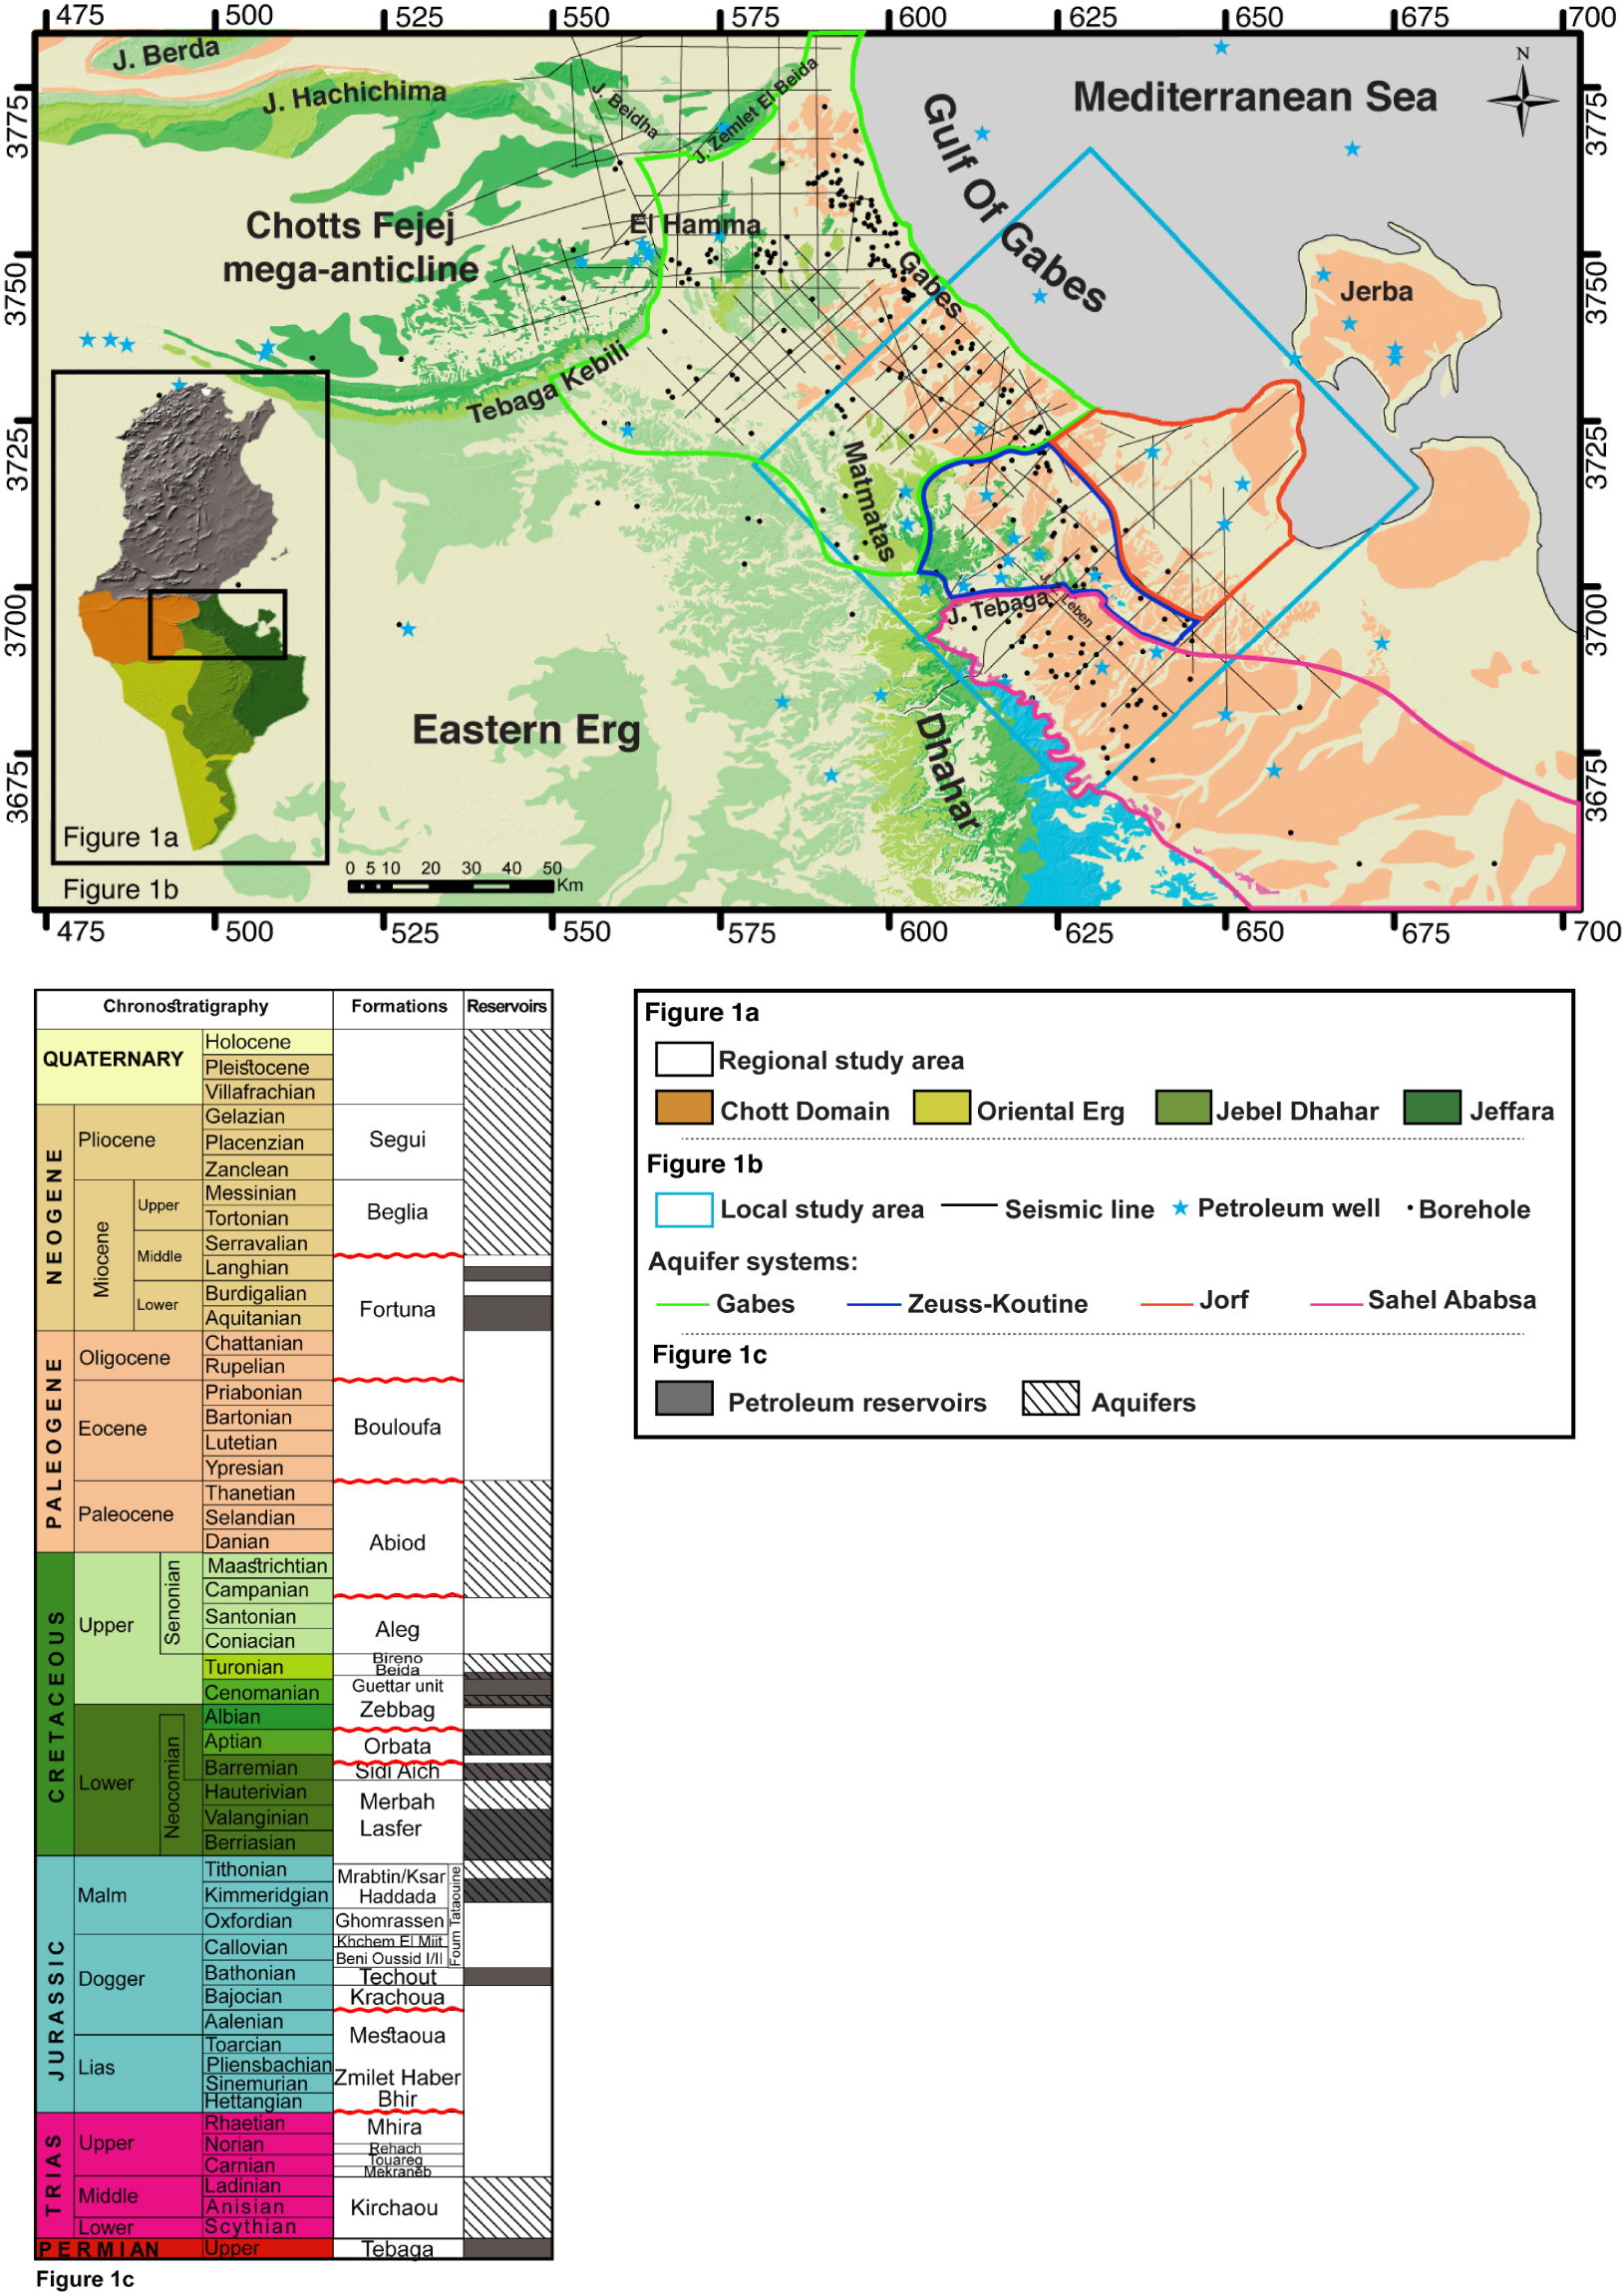
The structural geology of the Jeffara basin in southeastern Tunisia is described in detail in the literature, mainly, based upon outcrops [Busson 1967; Bishop 1975; Bodin et al. 2010; Bouaziz et al. 2002] and/or geophysical data [e.g. Gabtni et al. 2012; Chihi et al. 2013; Soua and Chihi 2014]. Most of these preceding studies have been devoted to the structural style and evolution of the main structural features and domains. However, much less is known about the stratigraphic/structural architecture, the regional extent and the facies evolution of the reservoir formations. Our investigations required to pay attention to two important issues. The first is the high complexity of the tectonic environment and the regional fault network over all the Jeffara. Actually, the rocks are outcropping on the western side and are buried at a depth of some 3500–4000 m in the eastern side. Another challenge is the difficulty of predicting the short-distance evolution of lithostratigraphic formations from one structural bloc or domain to another one, mainly within low data density areas. Accordingly, a multiscale modeling was carried out within the Tunisian Jeffara. This large study area provides an excellent example of the trade-off between structural complexity, input data, geostatistical methods and uncertainty of model outputs.
To address these challenges, we propose a multi-scale modeling workflow that takes into account data heterogeneity and scarcity, geological concepts and interpretations; while leveraging the potential of geostatistical algorithms to provide adequate and reasonable procedures for integrating multisource data, optimizing the prediction of geological and hydrogeological parameters and quantifying and mitigating uncertainty. The geostatistical tools, including stationary and non-stationary algorithms (such as ordinary kriging, kriging with external drift and 3D potential field/based cokriging interpolation), were adapted according to the modeling scale and objectives.
This paper presents a part of the results of a comprehensive regional study on the Jeffara basin (Figure 1), undertaken under the research project “Geomodeling and Natural Resources Characterization” framework. It summarizes the recent interpretation efforts carried out to promote the exploration of this challenging area and to develop a better definition of its structural setting and geological evolution. It will be demonstrated that the use of the stratigraphic analysis at the regional scale of sedimentary sequences, based on outcrops, cores and logs, and geophysical data, leads not only to a higher degree of details in the regional fault network and the 3D architectural models but also, to various significantly different interpretations concerning compartmentalization and connectivity of the faulted reservoir units hosted within the multilayered aquifer systems.
The rest of the paper is organized as follows. Section 2 provides a brief geographical and geological overview of the study area. Section 3 addresses the regional modeling of the extended sedimentary sequences to identify the spatial arrangement of regional structural domains and to better understand the relative positioning of the reservoir systems. Section 4 describes the integration of geophysical data to construct a local structural model of the coastal multilayered aquifer systems. Section 5 explains how the various findings and interpretations, presented in Sections 3 and 4, constituted the most imperative input involved in the implementation of a 3D geological model. The explanation is then extended to reveal how such combined modeling approaches can provide effective tools for (i) a better understanding of the hydrostratigraphic framework and (ii) the description of the aquifer systems distribution, (iii) the characterization of the reservoir connectivity within and between all aquifer compartments and (iv) the identification of the groundwater flow pattern, and (v) the regionalization of potential zones for aquifer recharge and aquifer system management. In Section 6 we summarize the major challenges faced during the different modeling processes, discuss the results and findings and propose solutions for future work and applications for both the present study area or other regional and/or local case studies. Section 7 outlines the concluding remarks, summarizing the main findings and results of the study.
2. Overview of the study area
The study area (Figure 1) is extended over a large domain of southeastern Tunisia that covers the Jeffara basin and the surrounding Dhahar-Matmata Mountains to the south and the west, the Chotts Fejej mega-anticline to the north, the Gabes region to the northeast, and Jerba island and a part of the Gulf of Gabes within the Mediterranean Sea to the east. It is characterized by an arid climate exposed to both Mediterranean and continental influences, with high annual average evapotranspiration of around 2700 mm, low average rainfall reaching about 200 mm/year and an average temperature ranging between 12 °C and 30 °C.
The complex geological configuration is inherited from several successive tectonic events that affected the sedimentary units distribution and controlled their lateral facies and thickness variation. This geological architecture is mainly featured by several normal major NW–SE and minor NE–SW faults. The most prominent one is the Medenine normal fault, oriented NW–SE. It subdivides the Jeffara basin into (i) the southwest uplifted domain marked by the outcropping of the Albo-Aptian and Lower Cretaceous terrains and (ii) the northeast collapsed domain covered by a Mio-Plio-Quaternary (MPQ) layer. The tectonic evolution has resulted in the sculpting of the major geological structures in the study area [Busson 1967; Bouaziz et al. 2002]. These are namely (Figure 1a,b) (i) the northern and the southern Chotts chains surrounding the Chotts Fejej mega-anticline, (ii) the Dhahar-Matmata high mountains corresponding to a large monoclinal plunging westward until it finally dives under the dune formations of the Oriental Erg, (iii) the Jeffara coastal plain constituting the collapsed eastern flank of the Dhahar, which was buried under the continental deposits of the MPQ sediments, and (iv) other structural highs such as Jebel Tebaga of Medenine, Jebel Zemlet Leben and Jebel Tejra.
The study area, including the Jeffara basin and surrounding domains, is distinguished by an extensive stratigraphic series that extends from the Permo-Triassic to the Quaternary period (Figure 1c). Several regional and local unconformities dated as Early Jurassic, Late Aptian–Early Albian, intra-Aleg unconformities, Late Cretaceous and Oligocene–Miocene, in conjunction with thickness and facies variations, have been recorded as a result of continuous tectonic activity involving the reactivation of deep faults [Letouzey and Trémolières 1980; Ben Youssef and Peybernes 1986; Klett 2001; Bodin et al. 2010; Chihi et al. 2013]. The major potential oil and water reservoir formations are hosted within (1) the Permian represented by Tebaga and Zoumit formations, (2) the Triassic marked by the Kirchaou formation, (3) the Jurassic consisting of Techout and M’Rabtine formations, (4) the Lower Cretaceous represented by Sidi Aich, Merbah Lasfer and Orbata formations, (5) the Cenomanian materialized by the Zebbag formation, (6) the Turonian composed of Bireno and Beida formations, (7) the Senonian represented by Abiod and Aleg formations, and (8) the Miocene hosting the Ain Ghrab formation [Ben Ferjani et al. 1990; Peybernes et al. 1993; Chihi et al. 2013; Jabir et al. 2020; Kraouiaet al. 2022].
Important multilayered aquifer systems are extending along the Jeffara basin, they are largely interconnected through the dense fault network [Ben Baccar 1982; Mammou 1990; Chihi et al. 2015; Hammami et al. 2018a; Mezni et al. 2022a]. The main are (Figure 1b) (i) Gabes aquifer system, hosted mainly in the Mio-Pliocene in northern Gabes, in the Carbonate Senonian and Turonian in Southern Gabes, and in the Continental Intercalary in western Gabes, (ii) Zeuss-Koutine aquifer embedded in the Jurassic, Albo-Aptian, Turonian and Senonian intervals, (iii) the Sahel El Ababsa aquifer enclosed in the Triassic sandstone series, and (iv) the Mio-Pliocene Jorf aquifer containing the detrital sediments of the MPQ. The Jeffara basin is featured by a highly dense hydrographic network articulated around the major “wadis” (or non-perennial rivers) that drain rainwater from the high Dhahar-Matmata chain to be discharged to the northeast, particularly towards the Gulf of Gabes and the Sebkhas.
3. Regional scale modeling
Regional-scale modeling was conducted to enhance geologic knowledge, promoting a necessary update of the stratigraphic/tectonic architecture all over the Jeffara basin, and a better understanding of the reservoir systems arrangement and the regional extent of reservoir formations.
3.1. Methodology
We present an original multi-approach methodology to build a regional 3D architectural model of the Jeffara basin, using geostatistical algorithms. It is based on a sequential analysis and modeling of the bounding surfaces and the thickness variations, of the regional sequences belonging to the Cretaceous intervals. To make this paper somewhat shorter and more concise, we will focus only on three regional Cretaceous sequences, namely, the Lower Cretaceous, the Albian–Cenomanian and the Upper Cretaceous sequences (Figure 1c).
3.1.1. Data management
A dense dataset (Figure 1, Table 1), consisting of (i) 12,000 km seismic lines and 40 exploration petroleum wells provided by the Tunisian Company of Petroleum Activities (ETAP), (ii) 370 water boreholes, mainly deriving from the General Directorate of Water Resources (DGRE), that were carried out over the past 60 years across the entire Jeffara basin, and (iii) 8 assembled geological maps acquired from the National Office of Mines (ONM), forms the foundation for the architectural model construction. This database represents the most detailed and extensive sampling ever considered in such a modeling procedure in the region. However, this significant amount of data is of variable quality and frequency. The configuration shows that in some areas data are very clustered and can provide too much information to take into consideration (for some local kriging estimation and for visualization on the geologic maps and later, on calculated models). On and next to outcrops settings, mainly in the southwestern side area, data are typically scarce. Moreover, the alternative of using seismic-reflection data is not a practicable option. The seismic data are very much degraded next to outcrops and faulted zones, elsewhere because of sub-seismic resolution. In fact, the low vertical seismic resolution greatly affects the quality of seismic interpretation in certain areas. Some seismic markers may not be continuously available, and some others are below vertical seismic resolution, making them difficult to identify. Consequently, the database needed to be augmented with stratigraphic details derived from alternative sources, namely the numerous geological cross-correlation sections that were established and all outcrops information derived mainly from the geological maps and previous field studies covering the whole area. Nevertheless, the seismic interpretation helped to map the major crosscutting faults.
Datasets providing inputs for the development of the regional, local and 3D geological models
| Data | Notes | Source |
|---|---|---|
| Satellite Mission—SRTM with 1 arc-second (approximately 30 m) resolution | Digital Elevation Model (DEM) | USGS database (earthexplorer.usgs.gov/) |
| Geological maps | • 8; 1/100,000 • Gabes, Mareth, Ajim, Oglet Mertba, Medenine, Tamezret, Ghomrassen and Tataouine, • A surface of approximately 43,750 km2 |
ONM |
| Digitized outcrops | 8.958 points with a resolution of about1 point/500 m2 | Carried out within the framework of the Jeffara research project |
| Seismic data | 18 Seismic sections | ETAP |
| Exploration Petroleum/Well logs | 40 | ETAP |
| Boreholes | 370 | DGRE |
| Geological cross-sections | 60, the major were created for calibrating the 3D geological model | Established within the framework of the Jeffara research project |
| Piezometric Data | 68 | DGRE |
USGS: United States Geological Survey, ONM: National Office of Mines, ETAP: Tunisian National Oil Company, DGRE: General Directorate of Water Resources.
On the other hand, an assembled geological map (Figure 1) covering Gabes, Mareth, Ajim, Oglet Mertba, Medenine, Tamezret, Ghomrassen and Tataouine, with a surface of approximately 43,750 km2, was imported into ArcGIS software [ArcGIS 2012]. All landforms, the surrounding outcrops and Jebels were sampled to obtain a regular distribution of data points. The gridding technique was performed in a way that enables the resampling of the geologic features taking into account the structural details such as lithological boundaries, elevation variation of the topographic surface for each geologic outcropping formation, fault traces, etc. In fact, the grid’s dip and azimuth were defined to provide an optimal surface sampling. The size of the grid cells was defined so that the frequency of the sample points could be large enough to cover rightly the outcropped geological units but not exceed the borehole’s frequency. A point cloud of 8.958 points with a resolution of about 1 point/500 m2 was generated.
Taking into account the details needed for the modeling procedure and the further applications of the 3D model, the multisource data described above were harmonized. The different datasets derived from geological maps, field information, water boreholes and petroleum exploration wells were integrated in such a way they fit together with respect to both geometry and semantics. In fact, we have elaborated a unified stratigraphic scheme that defines the lithostratigraphic sequences, their units, and their regional boundaries which are the sequence unconformity/relative conformity surfaces (Figure 1c). Furthermore, all datasets were organized in a GIS environment using ArcGIS software to edit and generate any geological and hydrogeological information that would be useful during the different modeling processes.
3.1.2. Methods overview
The regional architectural model typically involves two main stages, that were carried out simultaneously.
3.1.2.1. Geological investigation
A detailed geological investigation was carried out, focusing mainly on an analysis of the stratigraphic/tectonic framework of the Cretaceous-MPQ sequences of the Jeffara basin, based on the unified stratigraphic scheme (Figure 1c), and using the multisource data described above. However, the modeling will concern only three stratigraphic intervals. The first is the Lower Cretaceous sequence that is delimited at its upper boundary, by the Aptian–Albian unconformity surface and at its lower boundary, by the Upper Jurassic surface. It includes the Merbah Lasfer, Sidi Aich and Orbata formations. The sediments are composed of clastic alluvial materials from the Saharan Platform [Bishop 1975]. The Merbah Lasfer formation (Berrasian to Hauterivian) is mainly composed of sandstones and dolostones. Barremian rocks consist of Sidi Aîch sandstones. Aptian rocks are mainly composed of limestones and dolostones of the Orbata formation. Bishop [1975], Ben Ferjani et al. [1990]. The second, and the third sequences belong both to the Upper Cretaceous interval. The Albian–Cenomanian sequence is bounded by the Late Aptian–Early Albian unconformity surface at the bottom and the Upper Cenomanian at the top; it includes the Albian to Cenomanian Zebbag formation. It was deposited sealing unconformably the Orbata formation and is composed primarily of carbonate rocks. The Turonian–Senonian sequence extends in between two stratigraphic limits, the Upper Cenomanian on the bottom and the Late Cretaceous unconformity on the top. The Turonian to Campanian sediments overly the Zebbag formation. They consist of the Beida formation composed mainly of anhydrite and minor amounts of dolomite, the Bireno formation which consists of limestone and marls and the Aleg formation including mudstone, limestone, and marls. The Abiod formation is usually composed of fractured chalky limestones but is fairly eroded on a large domain of the study area [Ben Ferjani et al. 1990].
To investigate the structural geometry and lateral facies variations, we constructed two sets of numerous parallel NE–SW and NW–SE oriented geological cross-sections, perpendicular to structural trends. One of them is illustrated in Figure 2. We emphasize here that, for purposes of understanding the stratigraphic/tectonic framework and subsequent geometric modeling needs, we have plotted vertically for each well, the hiatuses and depositional sequences, matching their appropriate ages. The correlation of the studied intervals, mainly the Lower to Upper Cretaceous stratigraphy, was complicated first by, obviously, the tectonic activities but also by these unconformities because in many areas they were erosive and removed a large part of the underlying sequence and even the entire formation (e.g. the Abiod formation). It was important in this study to pay special attention to the detailed occurrence of each sequence within each well and borehole, and identify eventual hiatuses by graphic correlation based on outcrops, as described on each of the eight geologic maps, field studies, seismic sections and previous works within the study area [Chihi et al. 2013, 2016; Mezni et al. 2022a].
NW–SE regional geological cross-section drawn sub-parallel to the shoreline within the Jeffara coastal plain. It shows globally a horst and graben structuring that is installed through NE–SW striking normal faults, with lateral facies and thickness variation. Note at the extreme NW the raised fold of Zemlet El Beida featuring the uplift and outcrop of the Lower Cretaceous series. It also illustrates, as indicated on the top, the impact of the NE–SW normal faults on the geographical pattern and the extent of aquifers and the various compartments, defined in this study as Lower Cretaceous, NW, Central and SE compartments.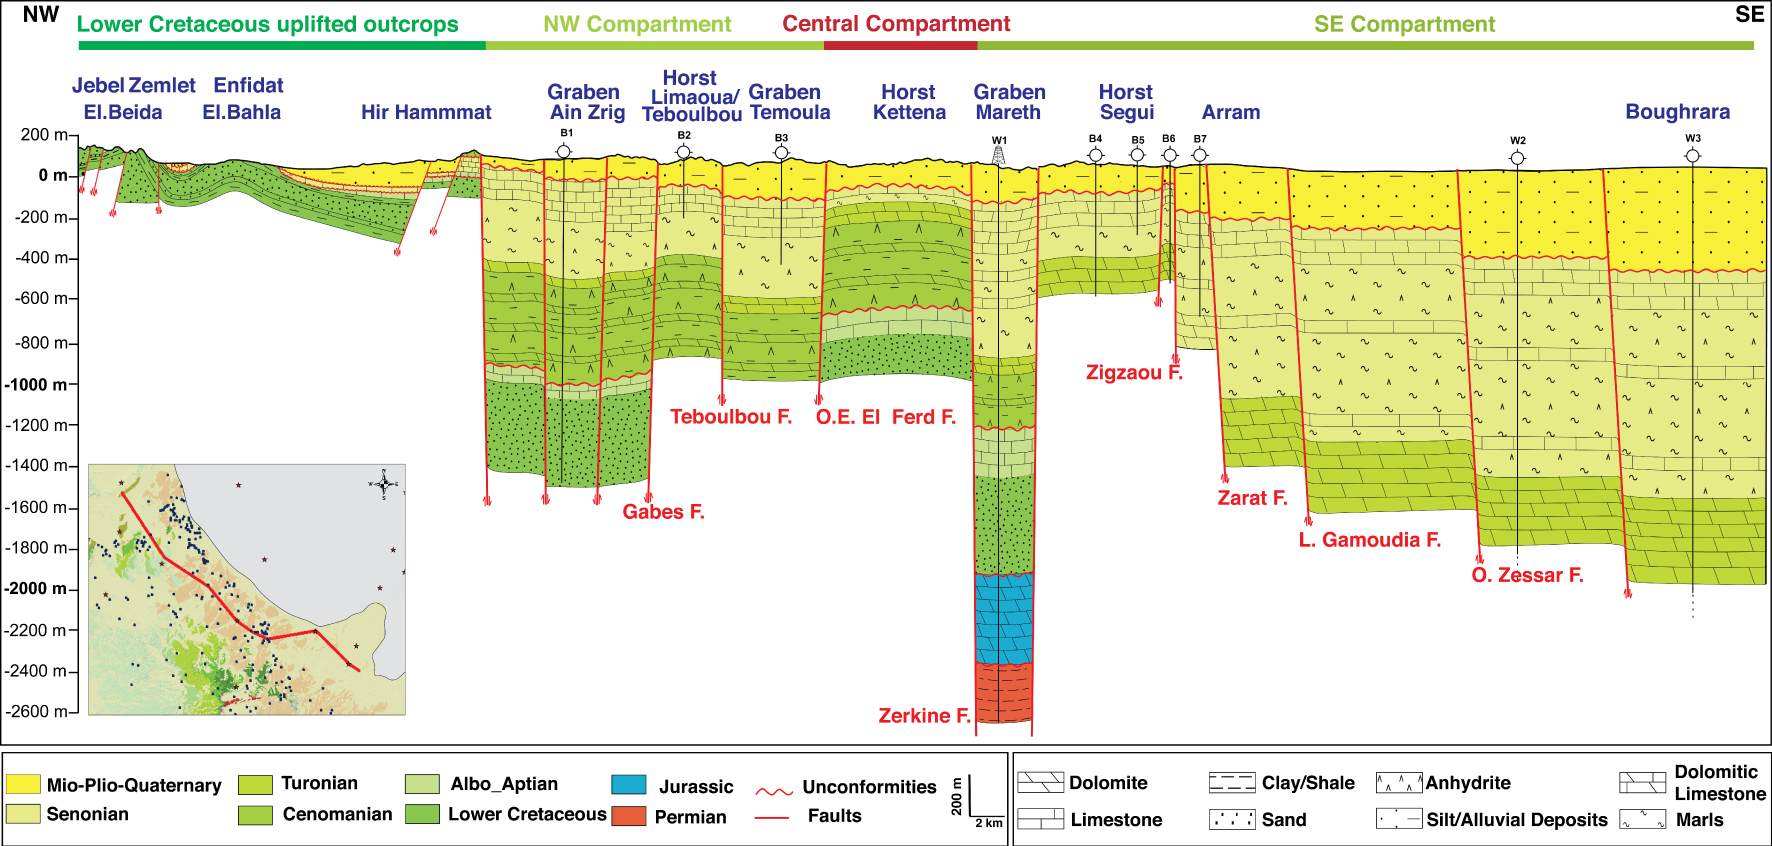
3.1.2.2. Geostatistical modeling
The stratigraphic–structural model, within the Jeffara basin, was constructed using the stack-unit mapping approach. Stratigraphic sequence boundary maps were estimated by kriging interpolation using ISATIS geostatistical algorithms [ISATIS 2020]. The sequences’ thickness maps were then calculated by subtraction from kriged lower and upper boundaries. However, the subtraction process was carefully performed so that the resulting maps appear geologically plausible.
We recall that approximately 370 control water boreholes and 40 petroleum exploration wells were augmented with more than 8.958 ancillary data generated by digitizing the surrounding outcrops in the study area (Table 1, Section 3.1.1). Furthermore, the established cross-correlation profiles in addition to the derived pseudo-wells were used to supplement the database. Elevation data (in meters) were imported into the ISATIS software as a data point file “X, Y, elevations”.
An adequate understanding of the regional properties of the lithostratigraphic sequences and of the limitations imposed by the data is absolutely necessary to adapt the geostatistical approaches and their input requirements in order to construct robust architectural models, minimize the associated uncertainty and honor the geological realism. However, in carrying out the data integration, we should take into account a series of factors that may be crucial for the quality of the end results. The first factor concerns the degree of detail aimed for the geological objects to be modeled and their interpretation. For us, the actual aim of the study is to model the regional stratigraphic–structural sequences using mainly a cross-section-based approach. The second factor consists in performing an adequate integration of the various types of all information described above to conduct the regional modeling. This could generally allow the set of major faults running through the study area to be reconstructed with sufficient accuracy and to draw easily the structural elements easily at a large scale. In our previous work on the Jeffara basin [Chihi et al. 2013, 2014; Hammami et al. 2018a], we tend to include in our modeling procedure all those discontinuities which can be identified from the seismic survey and established lithostratigraphic cross-correlation profiles (regardless of whether these have an impact on fluid flow), the purpose was to optimize the reservoir modeling procedures. This could not be adequate for the regional modeling, in this section, as it may influence the draw of isovalues’ curves. In fact, this could disturb the major lineament continuity and modify the structural elements’ shape and extent.
As an effect, we decided to elaborate an adequate simplified modeling procedure that allows optimizing the mapping at a regional scale, to highlight the regional major faults which turn out to have a significant impact on the structuring of the Jeffara basin and on the geometry and extent of its most important sequences.
3.2. Modeling the stratigraphic sequences
Geostatistical methods were used to study the spatial variability and the geological continuity of the sequences’ boundaries [Caumon et al. 2016; Chihi 1997; Chihi and de Marsily 2009; Chihi et al. 2016]. First, experimental variograms of the different “elevation” variables were calculated along the principal structural directions (i.e. normal faults striking northwest–southeast and northeast–southwest), to identify the underlying variogram components. Figure 3 displays the elementary variograms in both directions N45 and N135 for the different geological horizons.
Directional experimental (– – –) and theoretical (—) variograms of the Upper Cretaceous top (a), the Cenomanian top (b), the Aptian top (c) and the Jurassic top (d). The variograms display a drift component that indicates a notable increase in depth, revealing a downward tilting surface boundary.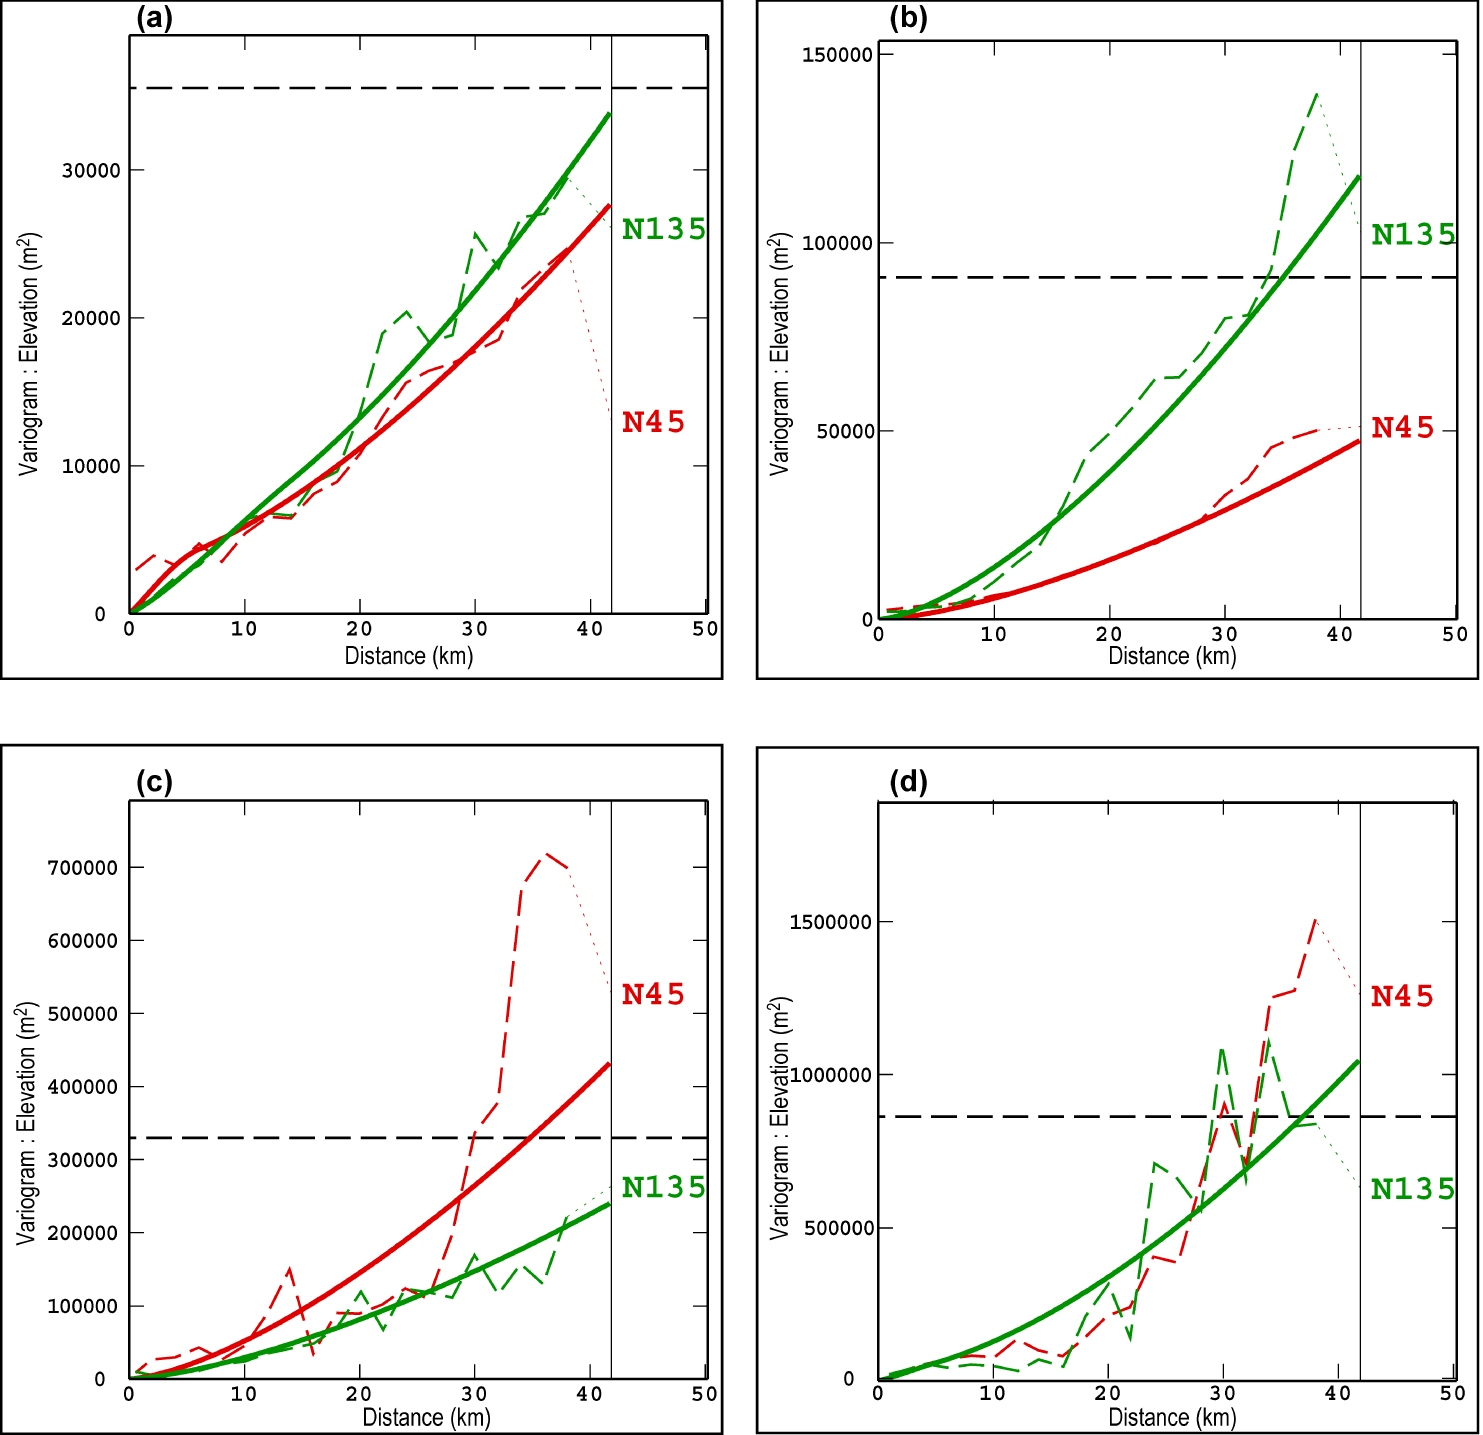
The Upper Cretaceous variable shows an anisotropic behavior (Figure 3a). We observe (i) a stationary structure describing the local depth variability and (ii) a non-stationary structure expressed along both the northeast–southwest and northwest–southeast directions. These drift structures reveal a downtilting of the Upper Cretaceous horizon that is more important in the northwest direction. The directional variograms of the Cenomanian horizon display a more pronounced anisotropic and nonstationary behavior with a higher variability along the northwest direction (Figure 3b). The Aptian variograms (Figure 3c) exhibit (i) an isotropic stationary component that describes the depth variability at a local scale and a nonstationary anisotropic drift that is more clearly expressed along the northeast. The variability of the Jurassic horizon shows an isotropic behavior and reveals a complex structure consisting of a local stationary component and a drift (Figure 3d). Table 2 summarizes the different model parameters (the range and the sill) obtained for each “elevation” variable.
Theoretical models of “elevation” variables for each horizon
| Variables | Structure | Range (m) | Sill (m2) | Equation | |
|---|---|---|---|---|---|
| N45 | N135 | ||||
| Cretaceous horizon | Spherical | 6,000 | 14,000 | 3,000 | 𝛾(h) = 3000 Spherical (6000N45 + 14,000N135) + 20,000 power (36,000N45 + 31,000N135)1.5 |
| Power | 36,000 | 31,000 | 20,000 | ||
| Cenomanian horizon | Power | 30,000 | 55,000 | 7,200 | 𝛾(h) = 7200 power (30,000N45 + 55,000N135)1.5 |
| Aptian horizon | Spherical | 2,800 | 2,800 | 3,000 | 𝛾(h) = 3000 Spherical (2800) + 33,000 power (35,000N45 + 12,000N135)1.5 |
| Power | 35,000 | 12,000 | 33,000 | ||
| Jurassic horizon | Spherical | 5,000 | 5,000 | 25,000 | 𝛾(h) = 25,000 Spherical (5000) + 220,000 power (16,000)1.6 |
| Power | 16,000 | 16,000 | 220,000 | ||
The variogram models were used to estimate successively the “elevation” variable for each sequence, at all unsampled locations by ordinary kriging on a grid covering an area of 175 km × 150 km discretized into 1 km square cells. A moving window with 8 angular sectors procedure was used to select the optimal number and configuration of the neighboring samples of the point to be estimated. This ensured to sample the most appropriate number of points along all directions as consistently as possible, the closest ones to infer local variability and the farthest ones to respect the non-stationarity of the variable. For each point estimation, we calculated the associated uncertainty defined by the standard deviation. Standard deviation maps were then generated for all estimated horizons to assess the estimation efficiency. We display, as an example, that of the Upper Cretaceous horizon in Figure 4. The values vary from 1 to 5 m around the observed points, up to 15 m where the data density is relatively lower. Accordingly, the estimation is considered sufficiently accurate. At the northwest and the southwest edges of the study area, the kriging standard deviation is much higher because data are scarce. We emphasize that during the modeling process, we have to consider comprehensively the influence of missing data in order to provide a means for improving the estimation all over the studied domain, i.e. (i) in areas with high but uneven data density and (ii) more importantly along the northwest and the southwest sides of the study area showing a few data. In fact, the first estimation trials required supplementing the database with some secondary data, derived from outcrops and geological cross-sections, which constituted an important part of the modeling approach and had a major impact on enhancing the kriging results. This would provide a better confidence for both the geological interpretation of the kriged surfaces and the generated thickness maps.
Kriging standard deviation map of the Upper Cretaceous top. The estimation is reasonably accurate around the observed points. At the northwest and southwest boundaries of the study area, the estimation error is higher due to the scarcity of available data.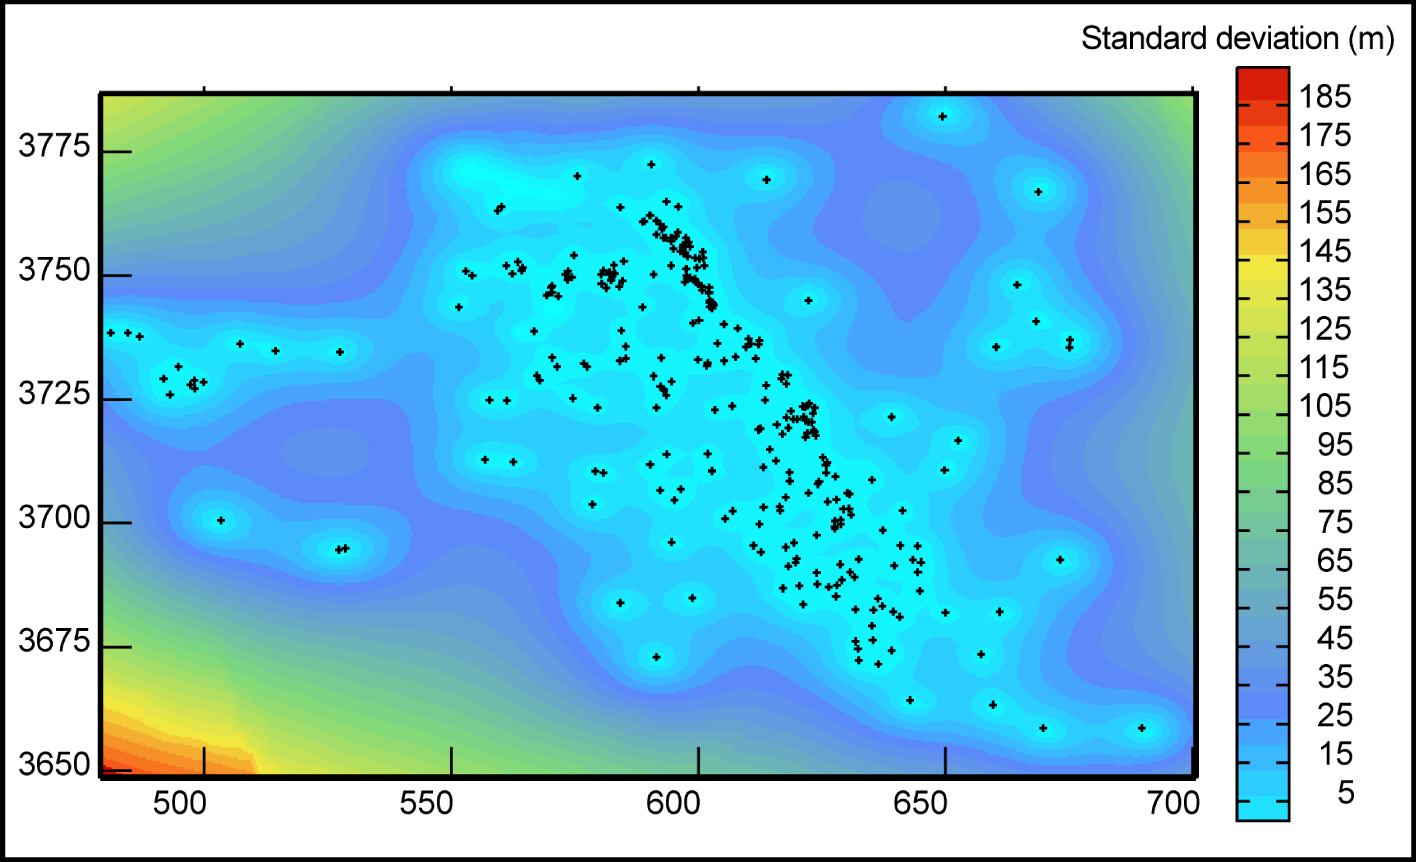
We, therefore, consider our interpretation in the reliable areas of the estimated maps while paying close and specific attention to the shaped geological features within sectors showing a relatively low data density. The thicknesses of the studied sequences that were estimated by subtracting the kriged elevations of the boundary surfaces, were validated systematically through a thorough comparison with the established geological cross-sections, the available seismic profiles in some areas and the general geological configuration as displayed on the geological maps and on outcrops.
On the other hand, it should be emphasized here that the thickness calculation resulted in negative values at some specific locations. This reveals undesired crossings between successive horizons which are geologically implausible, in these locations, and need to be investigated and corrected. Inconsistent thickness values can occur in the extrapolation zones (Figure 4) where few data are available, particularly in areas of low thickness, such as in the northwest of the study area. These inconsistencies were addressed by adding dummy data generated from the geological correlation profiles as stated above. The same can, occasionally, be observed in areas where the data density is relatively high but where there is a hiatus, the successive geological interfaces are naturally overlapping, for example in the southwest of the study area. As the surfaces are estimated by different variograms, they will have different but very close estimated values. At these points, if one of the thicknesses is calculated as a negative number, it is set to zero. This ensures that the thickness of the different geological sequences is accurately represented in the model. A comparison of all the calculations with the measured data points and the geological cross-sections was undertaken to further check the accuracy of the generated maps.
3.3. Visualization and interpretation
The calculated maps (Figure 5a–d) display the elevation variability of the sequences’ bounding surfaces defined by the Jurassic, the Aptian, the Cenomanian and the Upper Cretaceous horizons. The geological interpretation is derived from a detailed examination of the geometry spatial variation of these elevation maps that is also supported by the thickness maps of the Lower Cretaceous, Albian–Cenomanian and Upper Cretaceous sequences (Figure 5e–g). The structural interpretation is based on trend analysis and local slope variation, perceived on the elevation maps in order to ultimately delineate the structural ensembles. These results are verified through comparison with geological cross-sections, seismic lines’ interpretations and previous modeling studies in the study area [Chihi et al. 2013, 2014; Hammami et al. 2018b].
Estimated maps of the Jurassic (a), Aptian (b), Cenomanian (c) and Cretaceous (d) horizons; derived thickness maps of the Lower Cretaceous (e), Albian–Cenomanian (f) and Upper Cretaceous (g) sequences. Seven major structural domains were distinguished, namely: Medenine-Dhahar, Oglet Mertba, Chotts Fejej-El Hamma, Oriental Erg, Jeffara plain, Gulf of Gabes and Mediterranean. They are portrayed in Figure 5b, but remain relatively persistent and exhibit similar patterns across the kriged maps. It should be noted, however, that their geographical positions shifted at varying intervals.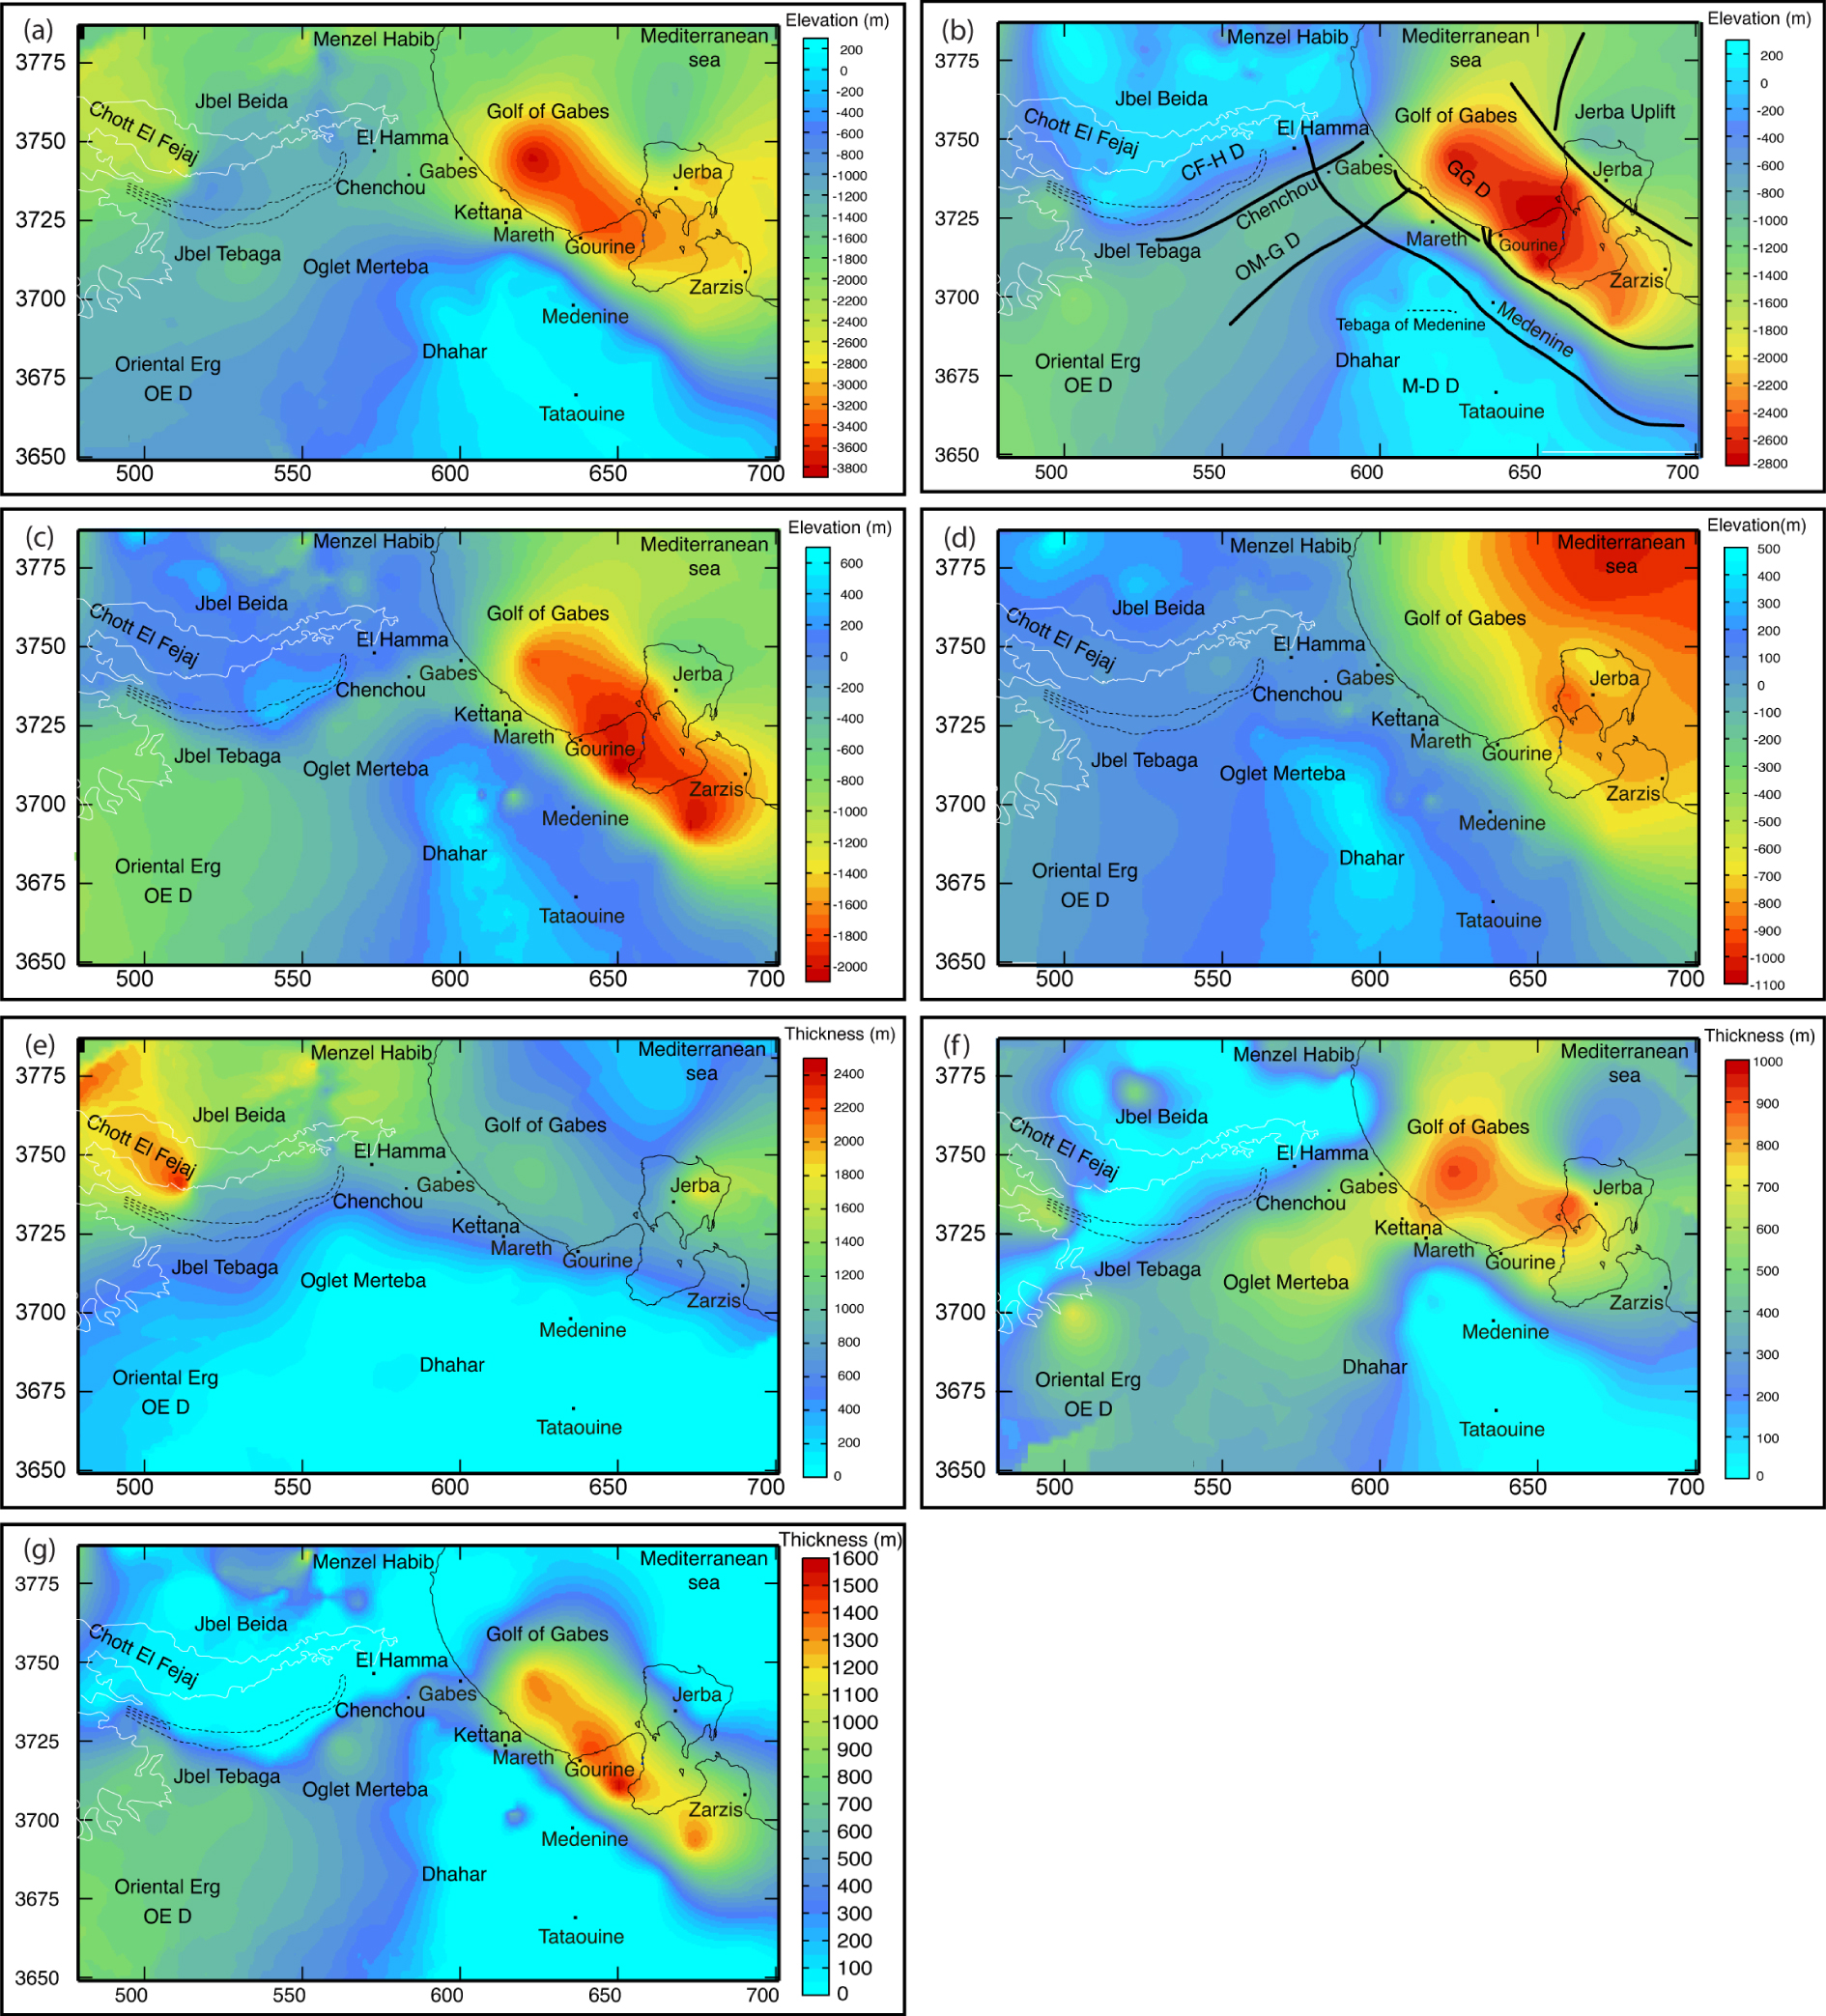
The structural feature alignment and the inherited surface morphology probably played an important role in the extent and thickness of the sedimentary sequences. Accordingly, for each sedimentary sequence, we will describe the lower boundary and the thickness map. Globally, elevation and thickness maps (Figure 5), show that the Jurassic–Cretaceous strata exhibit an irregular topography and complex geometry while dipping toward the Gulf of Gabes.
On the other hand, seven major prominent domains are distinguished. They remain relatively persistent and exhibit similar patterns across the calculated maps, but their geographic locations shifted at different times. They are marked on Figure 5b: (i) the Medenine-Dhahar Domain (M-D D) in the southern sector of the study area; (ii) Oglet Mertba–Gabes (OM-G D) and (iii) Chotts Fejej-El Hamma Domain (CF-H D), in the northwestern sector; (iv) the Oriental Erg (OE D) on the west; (v) Gulf of Gabes Domain (GG D), along the coast from Kettana to Jorf and shallow part of the Mediterranean, (vi) the Mediterranean Domain (MD) representing the rest of the Gulf of Gabes, and (vii) the Jeffara plain.
3.3.1. The Lower Cretaceous sequence
Sediments of the Lower Cretaceous series, deposited on the top of the Jurassic formations, regionally show a deepening trend emanating from all around Medenine-Dhahar (M-D D) structure (Figure 5a), albeit with variable slope intensity and a main deepening trend along the northeast direction.
The Jurassic upper surface is tilted northeastward from about 200 m in the south of (M-D D) up to 2–4 km in the northeast. This deepening is even more pronounced offshore of Gabes, along a NW–SE elongated depression, we named the Gulf of Gabes domain (GG D). Towards the northeast, in the Mediterranean Sea, the dipping gradient is locally reversed in favor of a considerable increase of elevation, up to −1400 m, within the Meditteranean Domain (MD).
This surface is also significantly tilted northward of (M-D D). The deepest northern area constitutes an extended relatively flat-lying area covering the Chotts Fejej-El Hamma Domain (CF-H D), with elevations ranging between −1200 m to −1600 m. These trends converge along a NE–SW lineament that we will be referring to as Oglet Mertba–Gabes (OM-G D) downlift. It is observed along Oglet Merteba, Chenchou and Gabes extended area, with a relatively uniform elevation ranging between −1300 m and −1700 m. In the southwestern part of the basin, a gentler and steadier gradient is observed towards the Oriental Erg (OE D) in an ESE–WNW direction.
The calculated thickness map of the Lower Cretaceous (Figure 5e) reveals two sedimentary zones, namely a shallow and a deep domain. The shallow domain is characterized by relatively little to no presence of Lower Cretaceous formations; these areas are located on the Dhahar dome and its continuity in the continental Jeffara. The paleogeographic evolution of this region indicates that it had been uplifted, since the end of the Jurassic. On the periphery of this region and around the Matmatas, the Lower Cretaceous sediments are relatively thin and hardly exceed 500 m of thickness. The deep domain extends within two main subsiding areas: northward in the Chotts region and eastward within the maritime Jeffara and along the offshore within the Gulf of Gabes Domain and Jerba to the east.
3.3.2. The Albian–Cenomanian sequence
The Aptian surface elevations range between 300 and −2800 m (Figure 5b) and exhibit globally a similar elevation distribution as the Jurassic surface roughly within the same domains. A similar dipping, but with a clear steeper gradient, is observed orthogonally to the M-D D and heads towards the Mediterranean Sea (GG D) on the east and to the Oriental Erg (OE D) on the west. This surface, also, significantly deepens northward and portrays a clearer NE–SW elongated “Gabes Oglet Mertba” depression (−1000 m and −1200 m), before reaching a high area, covering the Chotts Fejej-El Hamma Domain (CF-H D). Elevation values increase, considerably above mean sea level over 200 m. The Oriental Erg is getting distinguished as a depression with well-drawn contours. On the eastern side, the downlifted Gulf of Gabes Domain (GG D) is also recognizable but with a significant change in its shape, with a larger NE–SW extent, it is deeper in its central zone, around Jorf and Jerba island reaching values down to −2800 m. The deepening of the Aptian is reversed towards the Mediterranean. Through correlation, the elevated Mediterranean uplift for the Jurassic map exists in the Aptian map as well, albeit not peaking in the same area of the Gulf of Gabes but in Jerba instead.
The thickness of the Albian–Cenomanian sequence, varying from 0 m to 1000 m, confirms multiple stated observations (Figure 5f). The Thickening trend seems to conform with the deepening trend in the Lower Cretaceous and, the lineaments observed on the elevation map can be recognized in the thickness map as well. In this case, the elevated areas of the Dhahar and of Chotts Fejej correspond to the areas where the Albian is almost inexistent or with very low thickness ranging between 0 to 100 m. The structural domains of (GG D), Oglet Mertba and Oriental Erg and their limits are recognized in the thickness map showing the most important values. The maximums, 800 to 1000 m, are within the Gulf of Gabes Domain.
3.3.3. The Upper Cretaceous sequence
Sediments of the Upper Cretaceous lay directly on the Cenomanian surface (Figure 5c) which obeys the same structural trends observed in the previous maps and also shows three major deepening directions. The same structural domains are recognized, but with some variations. In fact, the NE–SW deepening that radiates from the Dhahar has a gentler slope in the continental Jeffara of Gabes and of Medenine area. The Gulf of Gabes downlift which represents the peak of the deepening towards the Mediterranean Sea, is more prominent. The progressive shifting observed of the Jurassic and the Lower Cretaceous series continues for the Cenomanian series as this domain now covers the entirety of Jorf and Zarzis where the dipping reaches −2100 m. The elevated Jerba uplift, more to the northeast, seems to be of lesser importance than in the underlying layers. In the NW–SE direction, the two opposite dipping trends seen in the Aptian map are also present and converge to the deep lineament in the area of Oglet Mertba, Gabes and Chenchou. The northernmost Chotts Fejej uplifting domain is more extended and shows a spectacular rising as elevations range from 0 to 600 m. To the West, the Oriental Erg domain shows a better expressed shape with a greater extent and a softer slope that rotates towards the southwest.
However, the Upper Cretaceous elevation map behaves differently when compared to the underlying sequences (Figure 5d). The Medenine-Dhahar domain remains present albeit with much gentler deepening trends than those of the Cenomanian and the Lower Cretaceous with elevation ranging between 200 and 500 m. The Fejej-Hamma domain is also more attenuated and retracts to the northwest. The Oglet Mertba–Gabes and Gulf of Gabes domains are no longer distinguishable. However, a noticeable elevation dipping can be perceived in northern Gabes and the Oum Zessar areas down to −800 m in Jerba. In fact, the Upper Cretaceous top seems to conform with the topographic surface, the exceptions being northern Gabes and the Oum Zessar-Jerba areas where important Neogene layers are deposited (Figures 5d and 1). Unlike the lower sequences where elevation increases within the Mediterranean domain, this trend is reversed in the Upper Cretaceous top elevations dip down to −1100 m towards the northeast. The Oriental Erg deepening is much softer with a slower but more uniform slope that seems to further rotate towards the southeast similarly to the Cenomanian top surface (Figure 5c).
The thickness map (Figure 5g) actually brings more information on the Upper Cretaceous structural setup as the trends observed in the underlying sequences can be seen once more due to the inherited morphological setup of the Cenomanian layer. The Upper Cretaceous is thin to non-existent in the Medenine-Dhahar domain starting from where the thickening begins. Towards the north and the northeast, the thickness increases reaching up to about 600 m in the same Oglet Mertba, Chenchou and Gabes corridor, and 800 m in the Gulf of Gabes domain. It decreases once more in the Fejej-Hamma domain where it coincides with the outcropping of the Lower Cretaceous to the East of Hamma and the important Neogene deposits replacing the Upper Cretaceous in northern Gabes. Important Upper Cretaceous deposits can be observed again in the area of Menzel Habib in the northwest.
3.3.4. Insights on the hydrogeological setting
In light of the above interpretations, correlations with the hydrogeological setting of the region can support these results. Indeed, the setting of the aquifer systems of the region is closely related to the structural evolution and paleogeography of the area. Considering that the Jeffara plain is a result of the Atlasic orogeny at the limit of the Saharan platform, its tectonic collapse contributed to the obstruction of the violent Atlasic movements still observed on its limits, causing the division of the region into uplifted and downlifted domains. These tectonic events resulted in a specific structural arrangement of sedimentary sequences and fault networks within each domain, making the aquifer systems they host very distinct in nature. Regionally, the main trends interpreted from the elevation and thickness maps are (i) the uplifted compartments of Chotts Fejej-El Hamma and Medenine-Dhahar as well as Jerba to a lesser extent; (ii) the downlifted NE–SW compartments of Oglet Mertba–Gabes and the NW–SE Gulf of Gabes; and (iii) the relatively stable Oriental Erg domain. The collapse of the coastal Jeffara and its individualization from the rest of southern Tunisia was the result of post-Cretaceous tectonic compression that reactivated and reworked the fault networks that once controlled the Cretaceous and Jurassic deposition [Bodin et al. 2010]. The resulting downlifted and uplifted domains can be delineated on all elevation and thickness maps. However, they are becoming increasingly prominent within the upper layers (Figure 5a,e). The uplifted Medenine-Dhahar domain contains two important aquifers included in the Jurassic and the Lower Cretaceous, which belong to the so-called Zeuss-Koutine aquifer system located in the Medenine region. This system extends to the northeast downlifted costal Jeffara domain by the Turonian aquifer and joins the aquifer system of Gabes in the northwest (Figure 1b). Although the Chotts Fejej-El Hamma domain is also an uplifted domain, it exhibited a different behavior during the Jurassic, with a thickness of up to 1600 m, which indicates that this domain was a subsiding zone (Figure 5a). The uplifting trend becomes progressively more visible in subsequent maps, starting from the Aptian. This exposed high domain faced an intense erosion of the ante-Miocene deposits, on the Lower Cretaceous outcrops in particular [Bishop 1975]. The eroded sediments were deposited in the northern Gabes region where the Neogene aquifers lay directly on the Upper Cretaceous formations. Neogene deposits can also be found within Oum Zessar and Jerba areas and are a testament of the extreme erosion that occurred in the post-Cretaceous and led to the flattening of the Jeffara (Figure 5d,g). This open-cut erosion also contributed to the karstification of carbonates outcropping in the Cretaceous and Jurassic formations (i.e. Zeuss-Koutine and Gabes aquifer systems). The collapsing has also contributed to the preservation of formations hosting the Jeffara aquifer system within the grabens. Indeed, the two most important subsidence basins, the Chenchou-Gabes corridor and the Gulf of Gabes contain thick layers of Jurassic and Cretaceous deposits (Figure 5b) not affected by erosion. However, these structural movements have played a major role in the compartmentalization and karstification of some of the Jeffara aquifer systems.
In addition, the El Hamma Fault functions as a conduit between the “Continental Intercalary” and Jeffara aquifer systems, allowing water to emerge naturally along the faults. This phenomenon is a direct consequence of the ability of the fault network to promote the discharge of these waters from the western Lower Cretaceous “Continental Intercalary” aquifer (covering the entire western domains of the Fejej, Dhahar and Oriental Erg) to the eastern Upper Cretaceous “Jeffara” aquifer (within El Hamma and Gabes).
4. Local scale modeling
Regional mapping provided a numeric and reasonable foundation for understanding the spatial extent, the stratigraphic pattern and the structural factors delimiting the neighboring multilayered aquifers. To achieve a meticulous evaluation of water resources within the coastal aquifer systems, we constructed an architectural model of the Jeffara of Medenine area (Figure 1b). Extending the database by geophysical investigations allowed a geostatistical mapping of all geological features of interest at the required level.
4.1. Methodology
An architectural model of the Jeffara of Medenine area was constructed based on a sequential estimation of the Cretaceous sequences’ boundaries using well logs, core and seismic data. The local modeling workflow involves four essential processing steps: seismic interpretations, fault network construction, building the horizons models in time domain, and depth conversion using an external drift kriging. The thicknesses of the different reservoir units were sequentially estimated by subtracting their respective kriged upper and lower limits.
4.1.1. Seismic investigation
The architectural modeling workflow involved eighteen time migrated 2D seismic lines, eleven well stratigraphic logs and associated petrophysical parameters (especially sonic log), and stacking velocities obtained from seismic lines processing, using SMT Kingdom software [Seismic Micro-Technology 2015].
The harmonization process, which enables the different datasets to be processed so that they conform to each other in both geometric and semantic stratigraphic terms, is guided by the unified stratigraphic chart (Figure 1c) concordant with that adopted for large-scale characterization. The scheme defines the lithostratigraphic units and their bounding surfaces (reservoir unit tops or relative conformity/unconformity surfaces). This scheme constitutes the fundamental referential for interpreting seismic and well data, while also providing the details necessary for subsequent 3D modeling procedures.
Figure 6 shows an example of a seismic line crossing the study area with a NE–SW trend, it displays the interpreted seismic horizons which are the Jurassic, the Aptian, the Cenomanian, the Turonian and the Cretaceous tops. They are affected by a cluster of NW–SE oriented normal faults. The most significant are dipping northeast at approximately a 70° downdip angle. The other faults dip to the southwest at a dip angle of about 60°. They define a series of Horst and Graben and tilted block structures.
Example of a SW–NE oriented seismic line interpreted using SMT-Kingdom. It shows normal faulting, Horst and Graben, and tilted block structures. It also illustrates, as indicated on the top, the impact of the NW–SE normal faults on the geographical pattern and the extent of aquifers and the various compartments, defined in Chihi et al. [2015] and confirmed in this study, as the SW uplifted and the NE downlifted compartments of the Zeuss-Koutine aquifer, and the collapsed compartment of the Jorf aquifer.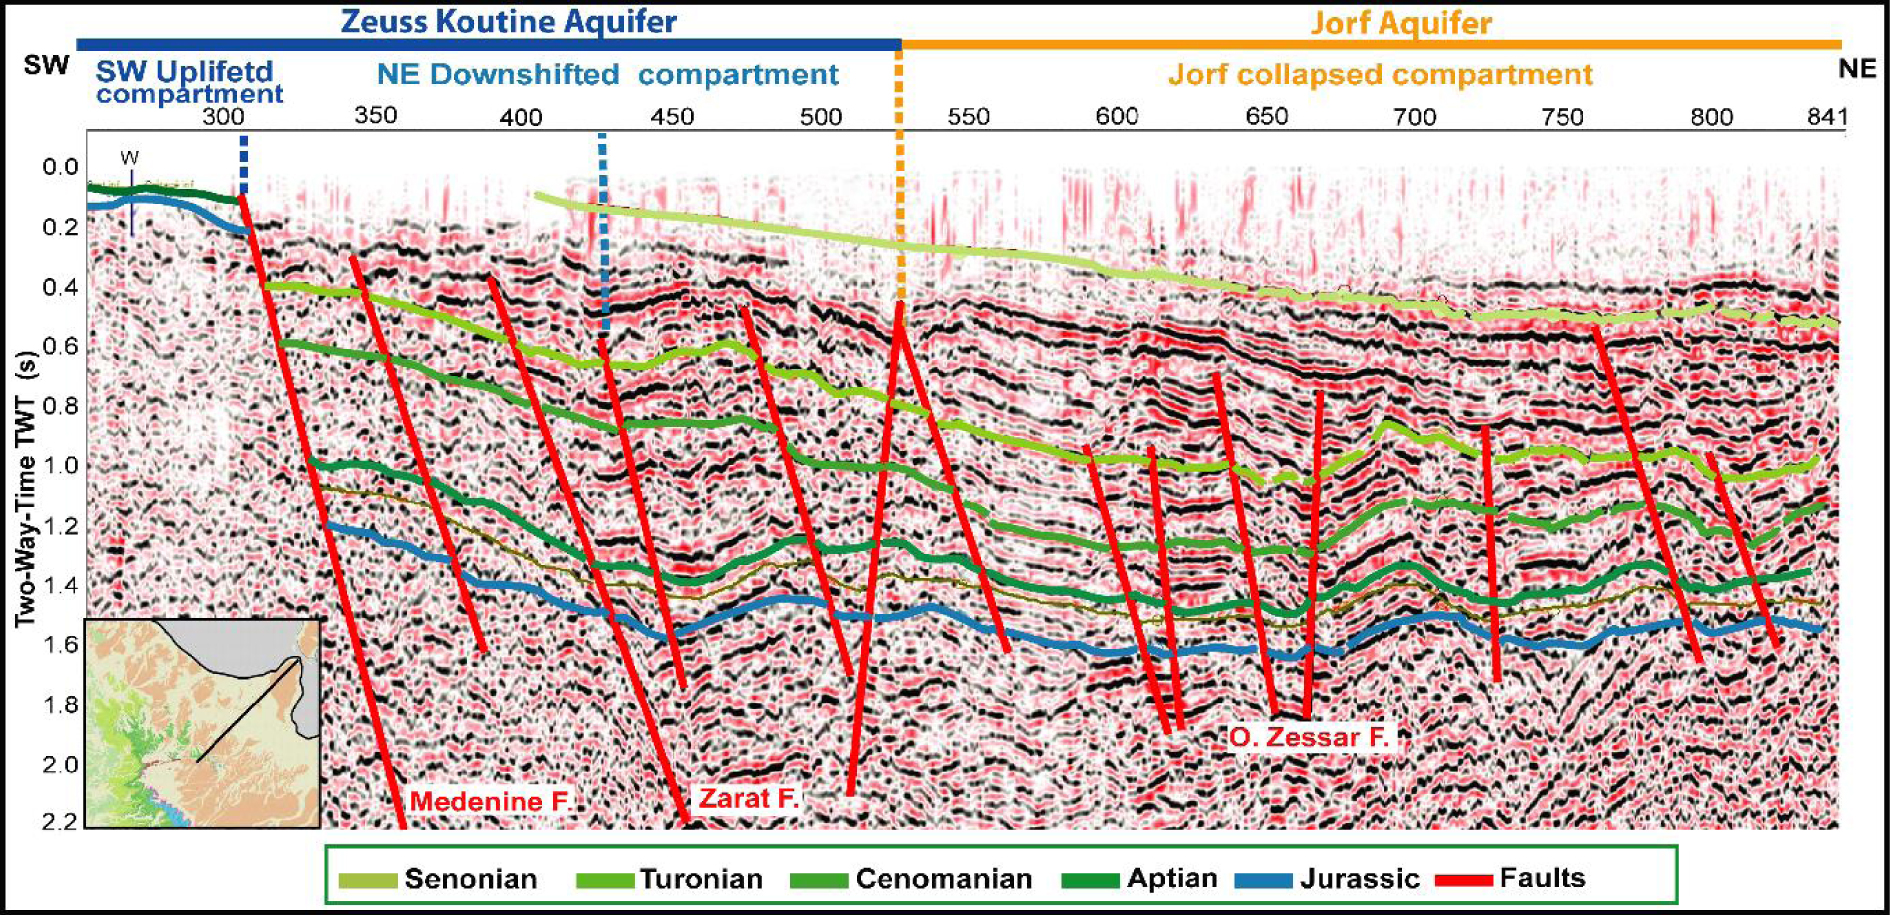
These major faults divide the region into structural blocks, some of which define the limits of aquifer systems (Figure 6). The included formations are affected by the repetitive faults’ movement resulting in lateral extent and thickness variation.
4.1.2. Building the fault network
The fault network strongly affects the arrangement, continuity and functioning of any such aquifers. It is, therefore, necessary to construct the fault network, to be integrated into the modeling process and to be used as a basis for understanding its impact on the various water units’ functioning. Accordingly, faults interpreted from the seismic data and from the constructed regional geologic cross-sections were all plotted on the assembled geological map (Figure 1) using GIS tools. A thorough correlation analysis of all fault segments while taking into account locations of outcrops and their limits, bedding attitude, and fault geometric criteria (strike, throw magnitude, dip and dip direction), as well as topographic data and fieldwork validation. This analysis allowed to build the fault network, within the Jeffara basin, displayed on Figure 7.
Structural map of the study area, as specified in current structural studies, showing outcropping terrains and major normal faults mapped from interpreted seismic profiles, established geological sections and field studies.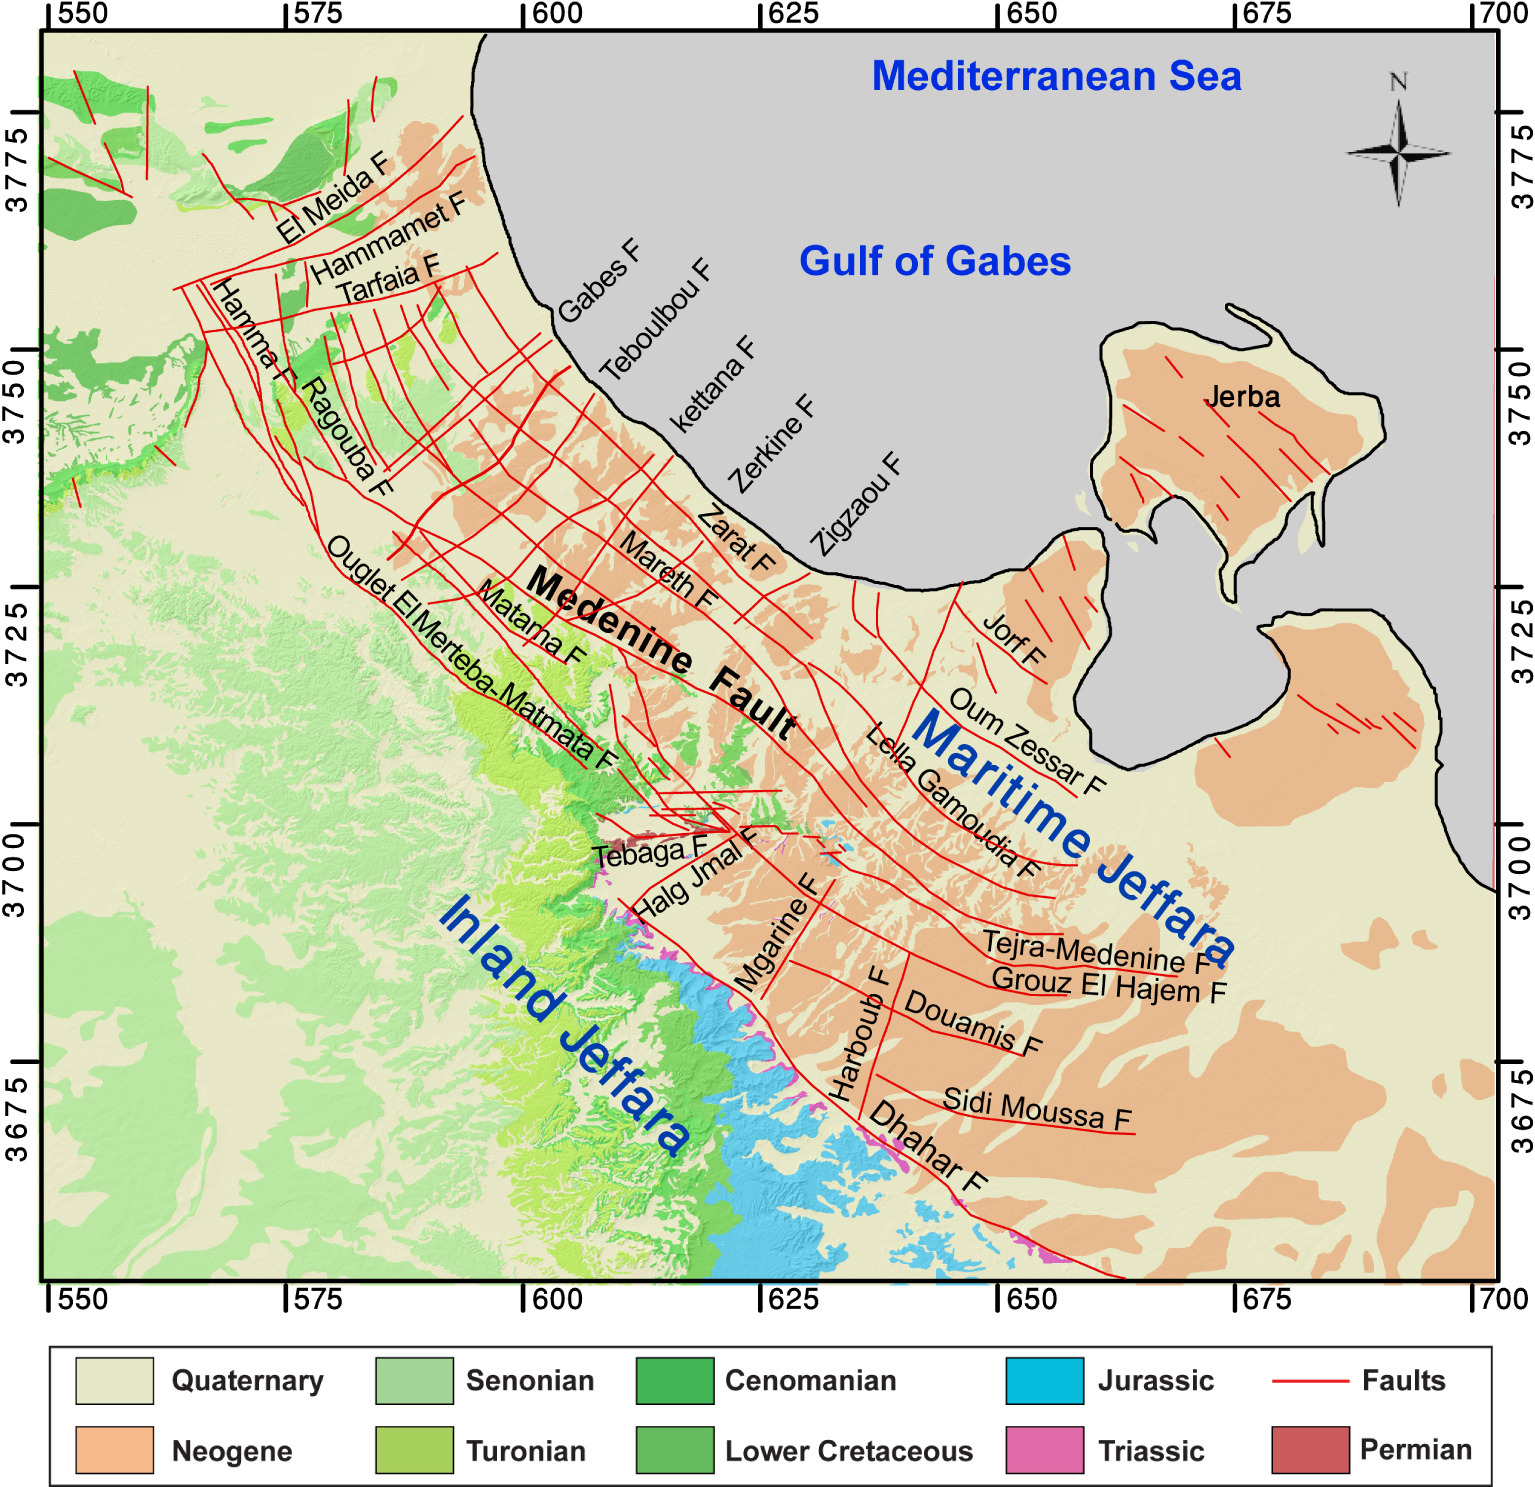
The obtained structural map shows that the Jeffara basin is subdivided into two zones: the inland Jeffara represented by a series of continental terraces dipping gently westward and southward from the Medenine fault to the Dhahar foothills (Figures 1 and 5a–d). The maritime Jeffara extends along the coastal plain characterized by a thick sedimentary pile covered by Quaternary deposits. It is divided by a network of conjugate normal faults. The most prominent of these are the deep “en echelon” normal faults, which strike in the NW–SE direction and run parallel to the coast. These faults caused the sediments to shift downward towards the Gulf of Gabes. The most important is the Medenine fault, along which sediments may be displaced up to 1000 m. The NE–SW faulting system splits the study area into Horst and Graben blocks. The major aquifer systems, considered in this study, are situated along the Maritime Jeffara. The “Medenine Fault” divides all of them into two major domains: a northeast subsiding domain and a southwest high domain (Figures 6 and 7). The NE–SW faulting system splits the major domains into sub-compartments such us Teboulbou, Kettana, Zerkine, Temoula, Ain Zrig, Koutine, Zeuss and Ksar Chrarif (Figure 2).
4.1.3. Modeling of primary horizons in time domain
The interpreted fault pattern and structural horizons bounding the stratigraphic sequences are basically the main components to construct a structural model. In the first step, a horizon model is constructed in time domain based on (i) the picked points, from interpreted seismic profiles (Figure 6) referred to each geological unit top, and (ii) the spatial continuity analysis of the “elevation variable” as it is detailed below. For the sake of simplicity, we have chosen to describe the modeling of the Turonian reservoir, bounded by the Cenomanian on its bottom and the Turonian on its top. Accordingly, in the following, we will detail the modeling procedure of the Cenomanian horizon through a time-to-depth conversion by means of kriging with external drift algorithm using the ISATIS geostatistical software. The thickness map of the Turonian reservoir was generated by subtracting the Lower Cenomanian and Upper Turonian kriged horizons.
The experimental variograms were calculated for the different “time” variables along the principal structural directions defined by the major normal faults trending northwest–southeast and northeast–southwest. The directional variograms of the Cenomanian horizon are displayed on Figure 8a, shown as an example. The variogram curves are continuously increasing, indicating a regional trend in both directions. They are also marked by a significant variability due to the structural faulting, inducing variable displacements of the considered surfaces. They also exhibit a slightly anisotropic behavior, which proves that the spatial variability of the Cenomanian horizon changes with directional orientation. The maximum variability is globally SW–NE. This indicates, in concrete terms, that the surfaces are tilted, and that the tilting is more accentuated towards the northeast rather than towards the southwest, as we would reasonably expect from seismic data and geological cross-sections.
Time-to-“depth” conversion using kriging with external drift: Directional experimental (– – –) and theoretical (—) variogram of the Cenomanian time horizon showing a drift component that indicates a notable increase in depth, revealing a downward tilting surface boundary (a). Time map of the Cenomanian horizon (b). Kriging Standard deviation map of the Cenomanian horizon indicating accurate estimation, the uncertainty is low close to the wells and in between, it rises only along the eastern edges of the study area (c). Elevation map of the Cenomanian horizon (d). Elevation map of the Turonian horizon (e), they reproduce the two regional compartments that are separated by the Medenine fault and display a general increase in elevation indicating that the region is down-tilted towards the Mediterranean Sea. The tilting is more pronounced in the southeastern sector, situated to the east of the Gourine fault. Thickness map of the Turonian reservoir, significantly affected by the crossing NW–SE and the NE–SW normal faults, the higher thickness values are observed on the southeast side within Gourine and Bou Ghrara regions. The reservoir is much thinner on the northwestern and southern sides, where it outcrops in the regions of El Mdou and Matmata.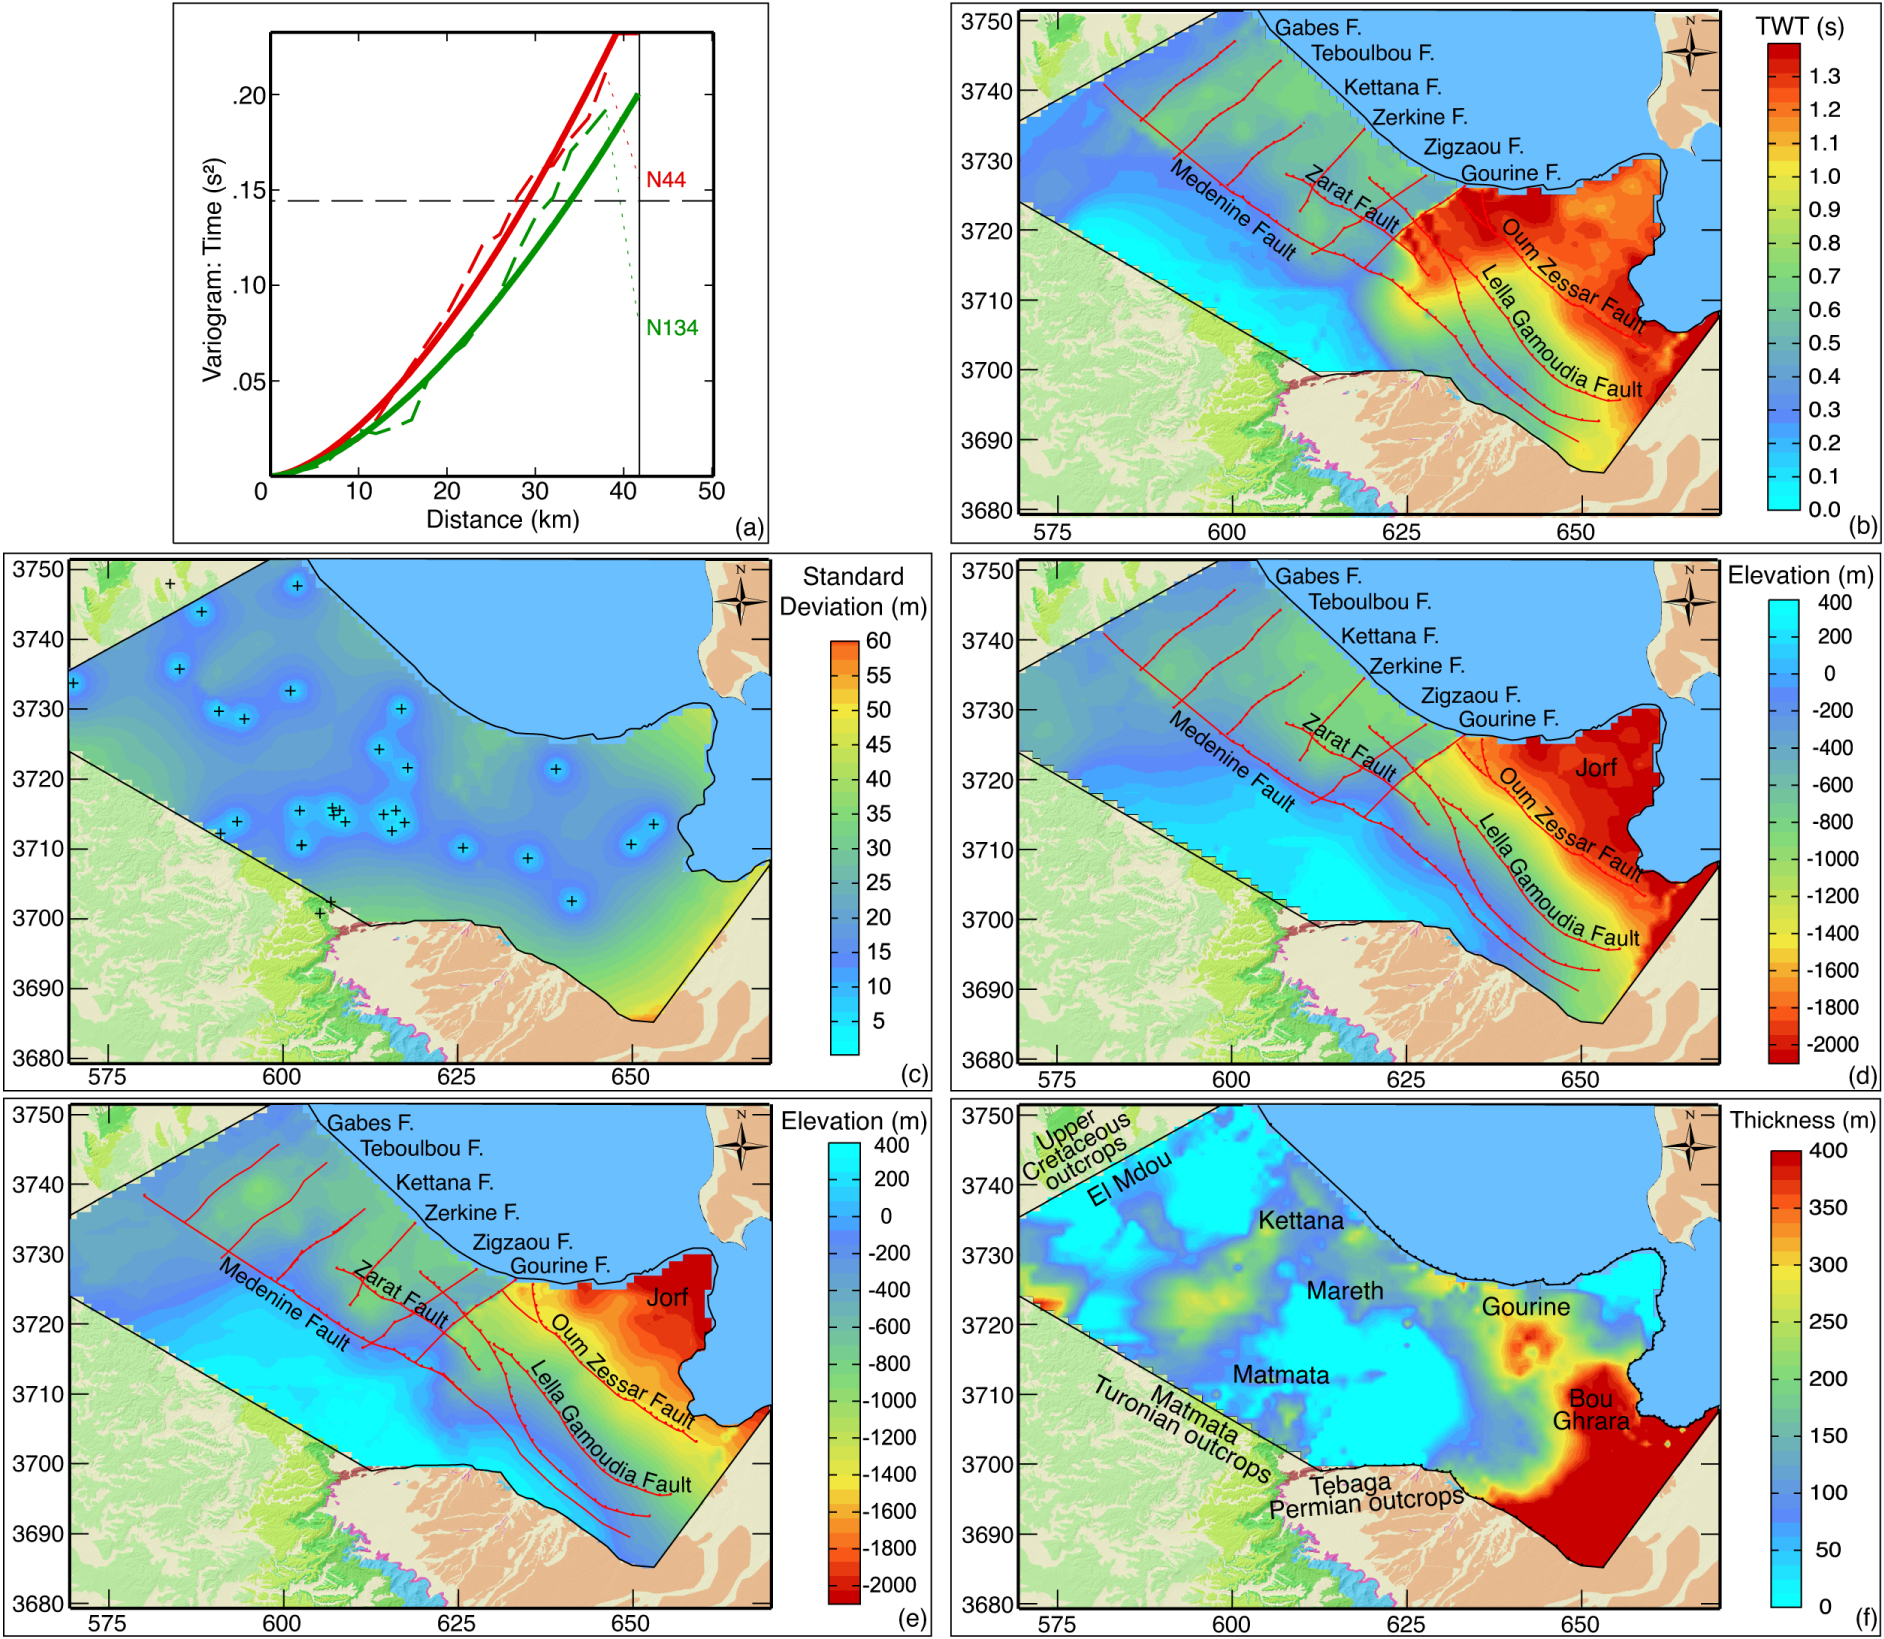
The estimated fitted model for the “Cenomanian horizon” variable implies an anisotropic power function (Figure 8a):
The surface estimation has given successful outcomes. In fact, the kriging standard deviation is low (0.00–0.01 s) evidently along the seismic profiles and around their intersections where the data density is the highest. Even, in between the seismic profile grid meshes the standard deviation values are ranging from 0.01 to 0.04 s. At locations where the seismic data are less dense, particularly in the southwest domain the estimation error increases up to 0.14 s. Figure 8b displays as an example the time depth map of the Cenomanian horizon.
4.1.4. Modeling in “depth” domain
The cross-plot of elevation (m) versus seismic times TWT (s) for the Cenomanian horizon demonstrated a clear correlation between these variables at the well locations. This would suggest that the seismic times might be used to help predict horizons’ elevations between wells. This time-to-depth conversion is possible through the kriging with external drift (KED) procedure, where the seismic time data guide the kriging process to introduce a component of its trend into the estimated depth. The seismic data are introduced as an additional constraint to optimize the faulted horizons.
First, the model of the target variable (elevations of the Cenomanian measured at the wells) was defined, taking the seismic information into account as a drift, according to the theory of intrinsic random functions of order k (IRF-K) and using generalized polynomial covariances [Chilès and Delfiner 2012; Chihi 1997; Chihi et al. 2000, 2007]. The estimated generalized covariance model is composed of two structures: a generalized covariance of order 1 and a linear drift part (1 f1). Then kriging was performed using elevation at wells as main data and the time map (Figure 8b) as an external drift. The quality of the estimation result was evaluated through the kriging standard deviation map (Figure 8c). The uncertainty is low near the wells, 0 to 5 m, and increases up to 12 m in between. Uncertainty rises significantly only along the eastern edges of the study area.
The geostatistical KED allowed, without integrating a velocity model, to generate the Cenomanian map (in depth) achieving a relatively small absolute error, honoring well data and reproducing the geological reality (Figure 8d). The same procedure was applied to calculate successfully the Turonian horizon (Figure 8e). Therefore, an isopach map of the Turonian reservoir was calculated by subtraction from the mapped Lower Cenomanian and the Upper Turonian boundaries (Figure 8f).
4.2. Visualization and interpretation
The geostatistical analysis suggests a complex spatial structure on the scale of the model grid (Figure 8). Globally, the study domain is characterized by two geological compartments that are separated by the Medenine fault (Figures 8 and 6).
Additionally, both the Cenomanian and the Turonian surfaces show general increasing elevations from southwest to northeast indicating that the whole area is downtilted towards the Mediterranean Sea (Figure 6). Maximum depth is observed along the southwestern and northeastern sides within Jorf area and Oum Zessar Graben (Figure 8). A more detailed trend analysis shows that the tilting is not uniform and presents different intensities. Indeed, the tilting is higher in the southeast sector, located east of the Gourine fault, compared to that on the northwest sector, within Mareth and south Gabes regions (Figure 8b,d,e). Meanwhile, the calculated surfaces clearly depict, there, several Horst and Graben structures, generated by the normal NE–SW faults: Gourine, Zigzaou, Zerkine, Kettana and Teboulbou.
This dense fault network, dramatically, affects the reservoir thickness as it is illustrated in Figure 8f. The higher thickness values, greater than 400 m, are observed on the southeast side within Gourine and Bou Ghrara regions (Figures 8f and 2). Turonian thickness varies from 100 to 200 m in the regions of Kettana and Mareth. However, the reservoir is much thinner on the northwestern and southern sides, where it outcrops, respectively, in the regions of El Mdou and Matmata.
The stratigraphic/structural configuration, of the local studied domain, although generally consistent with that advanced in regional mapping (Figures 8d and 5c), shows important improvement to the mapping of lateral extent and regional/local dip of the reservoir formation. It particularly captures diverse, distinctive features that make it attractive from a hydrogeological point of view. In this regard, special attention was paid to the reservoir formations’ extent and connection and more generally the compartmentalization and its impact on fluid circulation. This is described more in detail in Section 5.
5. Multi-scale modeling results—Aquifer systems characterization and management
The various findings and interpretations presented previously in this paper constituted the most imperative input involved in the implementation of a 3D geological model, and covering a wide domain in the Jeffara of Medenine area that includes four multilayered aquifer systems: Zeuss-Koutine, Sahel El Ababsa, Jorf and Mareth aquifers. This huge aquifer system will be designated as the “Jeffara of Medenine aquifer system” (JMAS). The outputs of the (3D) geological modeling were then used as a basis for the JAMS aquifer system management. This has been developed in three steps that will be clarified in the following sections: (i) description of the aquifer systems distribution, (ii) characterization of the reservoir connectivity within and between all aquifer compartments and (iii) development of a conceptual model describing the groundwater flow pattern, and identifying potential zones for aquifer recharge.
5.1. 3D geological modeling
The 3D geological modeling was conducted, using GeoModeller [Intrepid Geophysics GeoModeller 2020], to characterize the multi-layer reservoir systems involving the Triassic-Quaternary intervals and to enhance the understanding of their functioning at regional and local scales. It is based on a huge database (Section 3.1.1, Table 1), namely: (i) the digitized geological maps, (ii) a Digital Elevation Model (DEM) with 1 arc-second (approximately 30 m) resolution, derived from Satellite Mission – SRTM (Shuttle Radar Topography Mission), available on the USGS database (earthexplorer.usgs.gov/); (iii) structural data related to the geological interfaces deduced from time-to-depth conversion and the fault network (Section 4); (iv) boreholes’ data and wells’ logs; (v) interpreted seismic profiles and geological cross-sections; and (vi) geological interpretations and assumptions.
The process of computing consists in a specific 3D interpolation method based on the potential field theory, that defines a geological interface as an implicit surface, namely a particular isosurface of a scalar field defined in the 3D space [Lajaunie et al. 1997; Mcinerney and Guillen 2005]. It is implemented through a co-kriging geostatistical technique involving two main variables: (i) the “geological contact” defining the upper boundary elevation, of a given geological sequence, treated as an iso-potential surface, and (ii) the “orientation data” (strike, dip and facing) that constitute the gradients of the potential field. The interpolation was constrained by some geological knowledge and hypothesis that are derived from the combined geological–geophysical investigations (presented above in Sections 3 and 4). The first and most important geological constraints are those concerning the stratigraphic layering pattern, defining the chronological order of the geological sequence, to define correctly the “geological contact” variables. Furthermore, we have to specify the complex relationships (erosive and/or onlap) between geological series, for this, multiple potential fields can be combined in the same model [Chilès et al. 2004; Calcagno et al. 2008; Caumon et al. 2016]. The second geological constraint concerns the faults affecting the continuity of the studied sequences [Chihi et al. 2015; Hammami et al. 2018a, b]. Specifically, we defined the links (i) between geological formations and faults and (ii) between the faults themselves. Intersection relationships between fault pairs are identified by examining which faults stop on other faults. This assumption allows an age relationship to be considered since the terminal fault is assumed to be the oldest. Similarly, the estimation of the fault surfaces is based on the interpolation of the potential field by considering the fault traces as data points and the fault orientation data as gradients. The geological boundaries and the fault surfaces were drawn as iso-values of the interpolated scalar field [Lajaunie et al. 1997; Caumon et al. 2016]. The 3D model of the JMAS, encompassing the four multilayered aquifer systems, covers an area of 2275 km2 (65 km × 35 km) and extends down to a depth of 1.8 km. The Digital Elevation Model (DEM) was input to confer the terrain upper surface of the model.
The constraints defined above make it possible to ensure the reliability of the model, and deal effectively with major uncertainties [de Marsily 1994; Wellmann and Caumon 2018]. The main challenges, for the present study, are defined by (i) the complexity of the structural configuration defined by several geological faulted and downtilted layers showing lateral thickness variation and (ii) the dataset, although considered large, has an uneven distribution. The uncertainty is taken into consideration through (i) the data coherence, (ii) the robustness of the interpolation procedure; and (iii) the iterative computing/reevaluation process.
The position and coherence of the different datasets were thoroughly checked during the different previous (regional and local) modeling processes. However, their integration as input data in the GeoModeller software allowed through the 3D visualization a careful examination of the coherence and the relative position of the surface topography, the geological outcrops settings, boreholes and petroleum wells, and also the seismic profiles and the digitized geological cross-sections. This was performed to guarantee the correctness of the data within and between different datasets and to avoid inconsistencies in the conceptual geological model and the data sources.
The robustness of the interpolation procedures is as indicated above based on a cokriging method. The geological interfaces were estimated by cokriging involving the “contacts” and the “orientation” data, derived from the various datasets. These are guided by the imposed constraints that define the priority between the layers “erode” and “onlap”, as well as a stratigraphic column. All this would make it possible to reproduce the geometry and the relative 3D position of the geological interfaces.
On the other hand, including faults that were modeled by introducing discontinuous external drift functions in the cokriging system to calculate the potential field, allowed to reproduce the effect of faults on the geological interfaces. The management of the faults themselves constituted a key issue in the present case study. As presented above (Sections 3 and 4), the faults show a change in the structural orientation, from major faults striking southwest–northeast to minor northwest–southeast and also east–west faults all along the study area (Figure 7). They are also characterized by variable displacement and depth extent. Taking into account their paramount importance, a thorough analysis was systematically carried out for all major faults, in order to define the geometric parameters allowing to integrate them into the surface modeling process, while respecting the imposed constraints namely their position in relation to all affected surfaces and their relative relationships to neighboring faults.
Involving an iterative computing/reevaluation process allowed a continuous validation of the model. Parameters, including contact and orientation data and faults characteristics, were systematically varied or supplemented by integrating more geological cross-sections until a satisfactory model honoring the data and the geological reality was obtained. Practically, this was achieved by comparing visually the observed data with the modeled geological interfaces and faults while checking the structural configuration and the stratigraphic pattern within each compartment.
All these manual, visual, cognitive and technical processes helped to optimize the estimation procedure, reduce uncertainty and reproduce the geometry and the relative 3D position of the geological interfaces and the crossing faults.
The relevance of the 3D model was evaluated in terms of misfits that express quantitatively the match between model outputs and the observed data. A model is considered adequate when the percentage of the total assessed mismatch is below a tolerance threshold defined according to the complexity of the geological environment.
The implicit 3D geological modeling approach that we performed allowed the geological model to properly match with the existing data. In fact, 70% of the total data, show a misfit lower than 3%, these data are in general located within the eastern side of the study area characterized by a higher data density. The remaining 30% indicate a misfit of about 5%, these data concern the western region.
The 3D geological modeling outputs were displayed in diverse, impressive representations illustrating three-dimensional geometries, subsurface stratigraphic patterns and internal lithological variations, in 3D visualizations, 2D map views and modeled cross-sections were generated [see Mezni et al. 2022a, for more details]. Here, we present a south view 3D visualization of the model (Figure 9). Insightful descriptions were provided concerning (i) the reservoir/aquifer systems distribution, (ii) the reservoir formation geometry, the thickness variation and the extent according to the fault network, and (iii) reservoir connectivity within and between all aquifer compartments. This helped to develop a conceptual understanding of groundwater flow in aquifer systems. This will be detailed in the following sections.
Visualization of the 3D geological model looking toward the south. It shows the uplifted series within the Dhahar and Matamatas mountains and their downshifting toward the Jeffara plain. It reproduces accurately the spatial arrangement of aquifers against each other and in conjunction with the major fault structures. Note as well how the collapsing of the Upper Cretaceous and the MPQ series is portrayed beneath the Mediterranean Sea.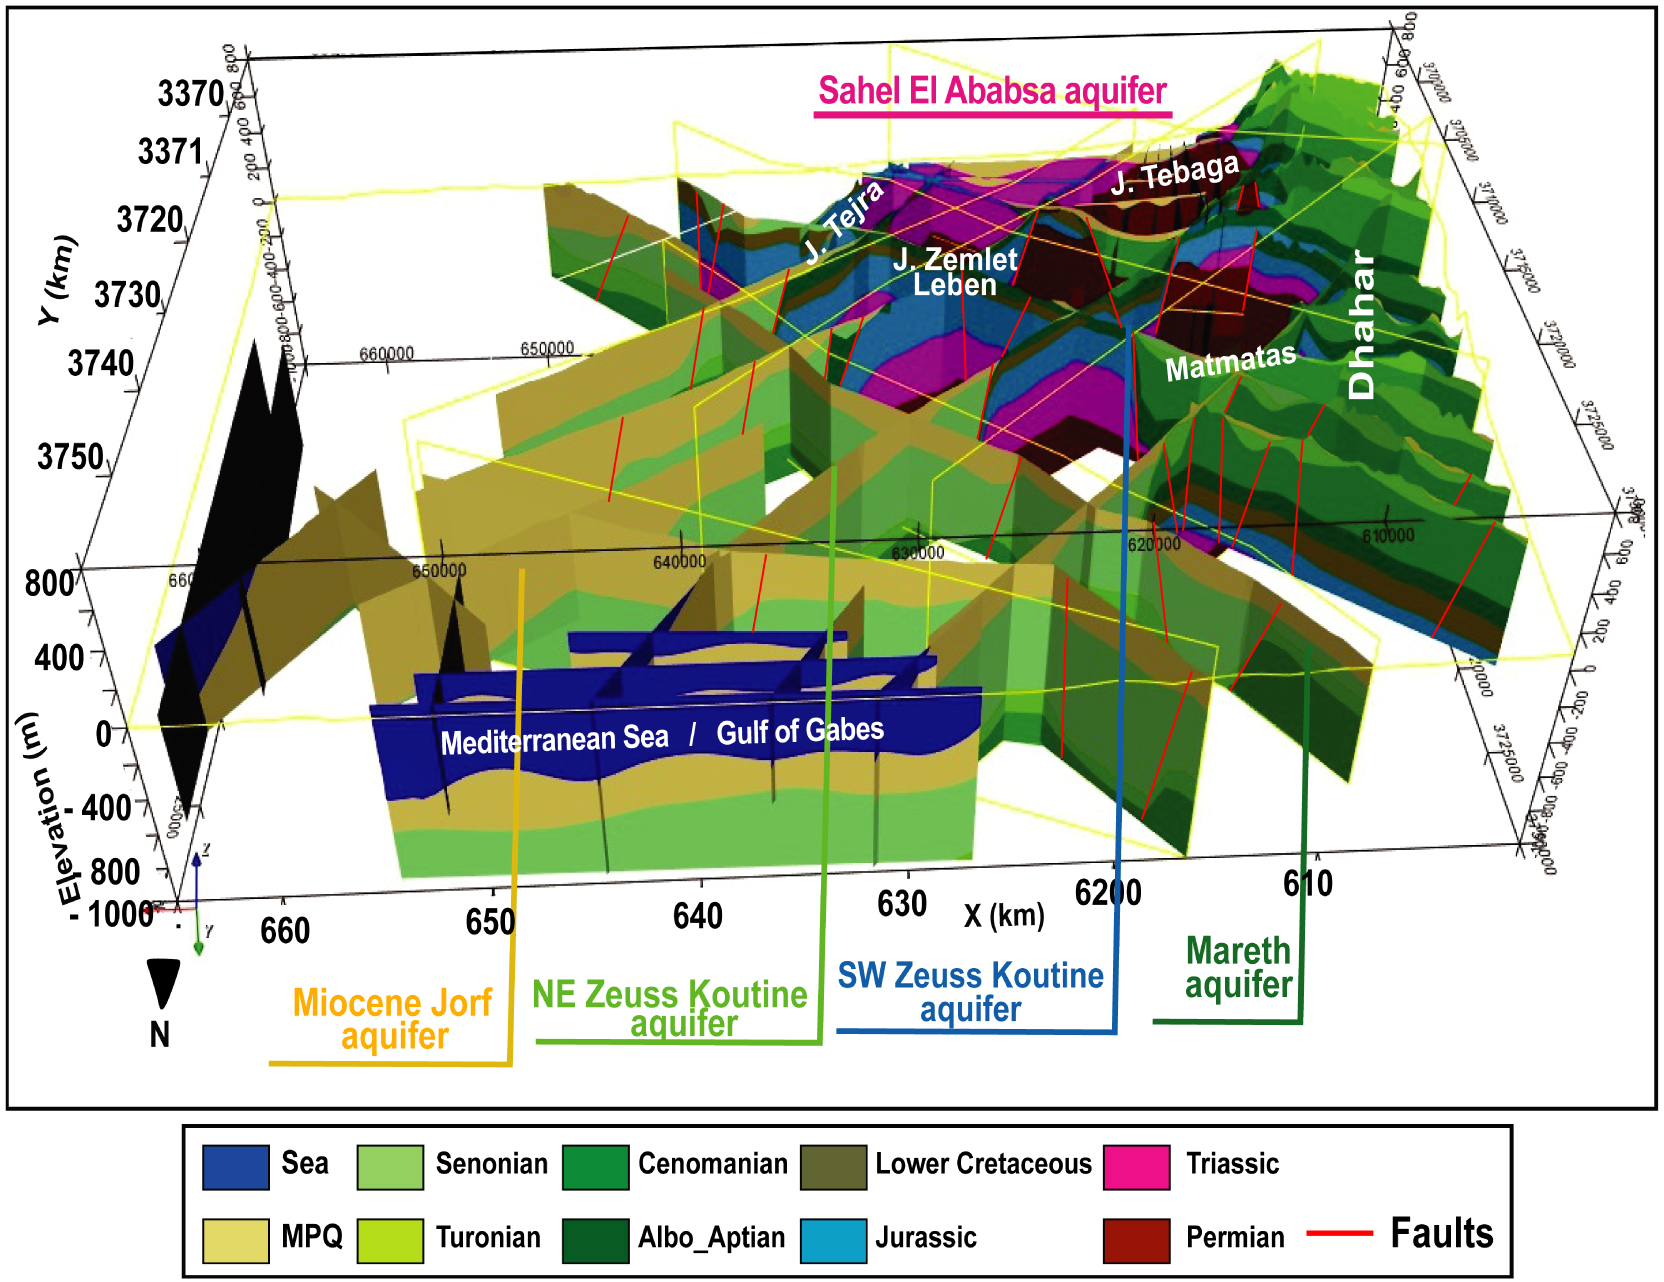
5.2. Reservoir/aquifer systems distribution
The 3D regional geological model (Figure 9) reproduces the spatial arrangement of aquifers against each other and in conjunction with the major fault structures. At a lower scale, it accurately renders the layouts of geological bodies in space: i.e. stratigraphic series, fault patterns and the compartments’ distribution within each aquifer system.
At the center lies the Zeuss-Koutine aquifer system, which is partitioned by the major Medenine fault into: (i) a southwest uplifted compartment, comprising the karstified limestones of the Jurassic and Albo-Aptian and (ii) a northeast collapsed compartment including the Turonian and Senonian carbonates, overlain by thick MPQ sediments (Figures 9 and 6). To the northeast of Zeuss-Koutine aquifer, we depict the Jorf aquifer containing the detrital sediments of the MPQ. It is delimited to the south by the Lella Gamoudia fault. To the south, the Triassic sandstone aquifer is extended along Sahel El Ababsa region. It is separated from the Dhahar outcrops by the Dhahar fault and is connected to the Zeuss-Koutine aquifer system by the Tebaga-Tejra faults. To the west, we recognize the southern Gabes region hosting Mareth aquifer, constituted of Lower Senonian and Turonian carbonates, and the Jebel Dhahar outcrops. In the southern domain, the Permian sedimentary unit hosting the reef reservoirs can be discerned, even on the surface.
5.3. Reservoir connectivity analysis within aquifer systems
Water flow paths are dependent on the continuity of reservoir formations and the degree of connection within and between all aquifer compartments [de Marsily et al. 2005]. This is largely governed by the internal stratigraphic structural pattern of each compartment and on the hydrodynamic properties of its bounding faults, deduced from lateral facies variation on both sides of each fault, as well as the sources of recharge and outflow locations. Accordingly, a thorough analysis of reservoir connectivity was conducted along the Jeffara of Medenine area on the basis of (i) a piezometric map of the JMAS that was kriged taking into account the major faults (Figure 10), (ii) several restituted modeled cross-sections, (iii) a thorough correlation of the potentiometric gradient/lithologic properties along aquifer compartments and (iv) the hydraulic behavior of tectonic faults, such the major “Medenine fault”, allowed to highlight the flow exchange between reservoir units and between major aquifers and to deduce a conceptual model of the water flow path.
An overlay of the potential recharge zones map and the piezometric map within Jeffara of Medenine aquifer system. Potential recharge zones map shows that high recharge potentials cover 31% of the total area and are located within Koutine, Ksar Chrarif Sahel El Ababsa, Medenine High, and Mareth. These locations are characterized by the highest infiltration rates enhanced by geologic factors, in particular the underlying thin vadose zone composed of permeable facies and in particular, karstified layers in Koutine and Ksar Chrarif compartments.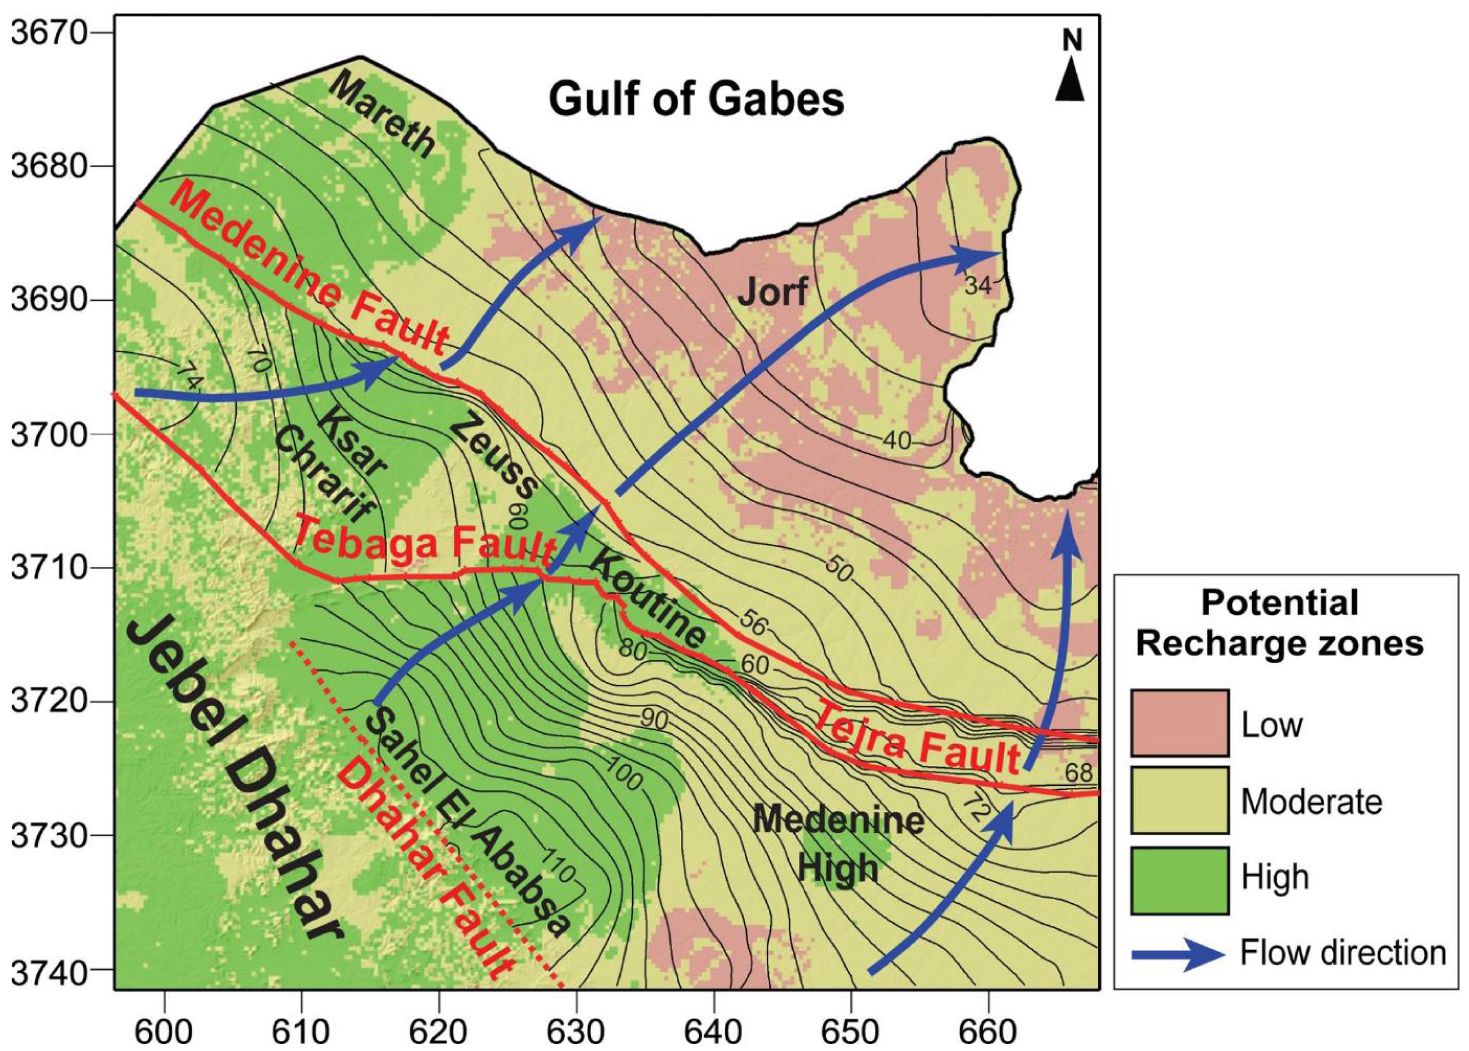
Taking into account the regional groundwater flow within the JMAS (Figure 10), in general, from southwest to northeast, and the significant water level changes across the different compartments showing shorter and multidirectional flow paths, we revealed that the tectonic structures and the stratigraphic pattern govern largely the behavior of the flow units and the water flow path. First, we noticed a direct recharge of water from outcropping formations, mainly within Dhahar and Matmata Mountains. A high amount of water recharge is provided through the uplifted karstified formations. The most important are those of Koutine and Ksar Chrarif compartments (Figures 9 and 10) that allow rapid percolation of water. In addition, groundwater in the aquifer system flows through a network of a steeply dipping normal NW–SE faults [Chihi et al. 2015]. The most important is the Medenine fault showing variable hydraulic behavior, according to the throw amount that increases from the southwest to the northeast. Actually, along its southwest segment, the fault juxtaposes the permeable Lower Cretaceous formations against the Upper Senonian impermeable formation, acting as an impermeable seal. In Zeuss area, the Medenine fault presents a conduit behavior. In fact, the throw amount is higher, involving the junction of two permeable carbonate units, namely the Jurassic and the Lower Senonian against each other. More to the northwest, the same fault adjoins the Turonian and the Senonian carbonates, thus ensuring water movement.
On the other hand, NE–SW normal faulting developed Horst and Graben structural features. However, the throw amount is relatively less important, within the northeast and the southwest compartments (Figure 2), engendering the same water-bearing formations to be juxtaposed, i.e. Senonian vs. Senonian carbonates or Turonian vs. Turonian carbonates. Within the central compartment, the fault displacement is more important, allowing to place the Senonian and Turonian carbonates close to each other. In any case, the fault block displacements preserve the connectivity of the aquifer formations (Figure 2). Additionally, it is noteworthy that these faults alongside the rivers have played an important role in their development and their evolution. These rivers actually play a very important role in the replenishment of aquifer formations.
Subsequently, studying in the same way all the flow units behavior along the different aquifer compartments, we concluded that this architecture ensures a good hydraulic continuity all along the Jeffara of Medenine area. The water flow path could be drawn as following (Figures 10, 9 and 6) (i) from the southwest to the northeast compartments of the Zeuss-Koutine aquifer through Medenine fault, (ii) from the northeast Zeuss-Koutine compartment to the Jorf aquifer via the Lella Gamoudia fault, (iii) from the Sahel El Ababsa aquifer to the Zeuss-Koutine aquifer system via the Tebaga and Tejra faults, (iv) and from the Mareth aquifer to the Jorf aquifer by means of the Zerkine fault.
5.4. Contribution to the aquifer system management
The results of the digital data processing within the geological model were also quite successful and opened new prospects for the production of thematic maps. Accordingly, we committed to develop a multidisciplinary methodology that enables to identify favorable areas for natural groundwater recharge (GWR) and to suggest suitable recharge structures [Mezni et al. 2022b]. A range of factors including, mainly, infiltration capacity and spatial and temporal distribution of rainfall and water runoff, govern GWR [Jaafarzadeh et al. 2021]. The infiltration capacity depends on the thickness and permeability of the soil and its evaluation is an important prerequisite, especially in case of lack or absence of measured data and, moreover, in a complex underlying geology. In order to overcome the lack of measured data related to the infiltration capacity, we conducted an efficient method based on a knowledge-driven modeling approach, using GIS, Remote Sensing, geostatistical interpolation and Analytical Hierarchy Process (AHP) to optimize the infiltration capacity distribution. This allowed the delineation of the potential GWR zones.
The originality of this approach [detailed in Mezni et al. 2022b] compared with that proposed in the preceding studies lies mainly in the integration of the structural features characterizing the complex geological environment. These features are the aquifers architecture, the stacking pattern of the aquifer units, the structural compartmentalization, the lateral facies variation, the faults network, and fractures occurrence on geologic outcrops. We demonstrated that all these factors played a crucial role on the distribution of infiltration capacity and the waterways from the surface towards aquifer formations, via the vadose zone. This presents an asset to optimize the mapping of the potential aquifer recharge zones.
The multicriteria AHP-overlay method was applied, aided by ArcGIS to integrate various thematic layers comprising (i) topographic and hydro-geomorphological factors, including slope, drainage density, effective rainfall and land-use/land-cover maps; and (ii) geological and structural factors involving lineament density, soil, permeability distribution of the vadose zone and aquifer formations, and vadose zone thickness maps [Mezni et al. 2022b]. All these factors were derived from all the previous work described above, primarily from (i) the combined geological–geophysical investigation, (ii) the geomodeling results concerning the spatial extent of geological formations, their connectivity in relation with the faults’ network and (iii) the potentiometric gradient and the deduced conceptual functioning of the aquifer systems in the whole region.
The generated map delineating the GWR potential zones (Figure 10) was evaluated by the Receiver Operating Characteristic (ROC) curve and the Area Under the ROC Curve (ROC AUC) score tools, and thereafter used to optimize the suitable sites for Managed Aquifer Recharge (MAR) facility installation. Accordingly, the GWR zones map shows that high recharge potentials cover 31% of the total area, they are located within (i) Koutine and Ksar Chrarif compartments, (ii) Sahel El Ababsa area and Medenine High, and (iii) Mareth region. They are characterized by the highest infiltration rates where water percolation is enhanced by many geologic factors, such as (i) the underlying thin vadose zone composed of permeable facies and (ii) in particular, karstified layers, as those of the Koutine and Ksar Chrarif subcompartments, and more importantly with similar fractured multilayer aquifer systems. Therefore, these MAR structures built at different locations would promote sustainable groundwater supply and, crucially, allow groundwater withdrawals to be controlled. The overall results indicate that the proposed approach is reliable and can be applied within similar fractured multilayered aquifer systems. More importantly, it can be adapted to any semi-arid/arid environment.
6. Discussion
Multiscale modeling was carried out within the Tunisian Jeffara. This large study area provides a valuable example of the balance and interplay between structural complexity, input data, geostatistical modeling algorithms and procedures for dealing with uncertainty of model outputs. In the following, we summarize the major challenges and describe how we addressed these challenges while proposing solutions for future work and applications in other regional and/or local case studies. A crucial guiding point to consider is that a successful model depends on the density and, in particular, the availability of data according to the needed scale and the specificity of model purposes.
First, a regional structural model was constructed based on geological data, i.e. boreholes and well data, geological maps, geological cross-sections and field information.
The first challenge concerned the uneven data distribution, with a big difference in data density between the eastern and the western side of the study area (Figure 1). This prompted us to incorporate secondary information from outcropping sequences and geological cross-sections on the western side (Section 3), to control mapping results far from the wells.
Another challenge encountered was the geological complexity that was addressed through the adjusted theoretical variograms showing globally local stationary and drift anisotropic structures. These nested structures allowed to reproduce the complex geometry of the sequences’ boundaries while highlighting the local “elevation” variability within each structural bloc and the larger scale variability describing the downshifting of the surfaces from one bloc to another one.
The rate of the “elevation” variability was also handled through the adopted “moving neighborhood selection” procedure. In fact, we implement an octant search while optimizing the size and adjusting the relative spread within each angular sector. This ensured to sample the most appropriate points along all directions as consistently as possible, the closest ones to infer local variability and the farthest ones to respect the non-stationarity of the variable.
Based on the adjusted variogram and the neighborhood parameters, the kriging procedure provides the best estimates of the elevation variables, for each point, and an approximation of the uncertainty defined by the kriging standard deviation. The visualization and the analysis of the geological horizons and the standard deviation indicated a higher estimation error on the northwestern and southwestern sides of the study area, having fewer input data. Therefore, the kriging method can effectively indicate where additional measurements need to be made to reduce uncertainty and improve the estimation of surfaces. The needed additional information was generated from geological cross-sections, the only possible source for supplementary data in these regions.
Thereby, imposing such constraints within the modeling approach, we managed to produce highly realistic basal structures, even in areas of sparse data within the western side of the study area and complex structures along the eastern side. We emphasize that the northwest and southwest sides of the study area although having less input data, have much simpler geological structure, so it can therefore be inferred that the overall uncertainty is not necessarily significantly high and that the modeling results can be accepted.
We should note that completing the database with secondary data improves the results of the mapping away from the wells. However, they should not be integrated as hard data but as soft data generated through a reasonable approximation of the “elevation” values, taking into account the geological knowledge, the local variability and regional structural trends. There is another way for integrating different sources of data to improve the mapping of the geological horizons. Multivariate geostatistical interpolation can also be used to supplement some measurements from the upper, generally more sampled, surfaces to better estimate the lower ones, where data is limited. Accordingly, it may be possible to improve the estimation of a given horizon using cokriging interpolation, which takes into account the correlation between successive horizons. This method is, however, complex and requires further work, as the relationships between successive geological horizons are significantly different across the geological compartments.
Second, a local structural model was built on the basis of the detailed seismic information with limited geological data, using geostatistical algorithms. We chose to apply the KED method for time-to-depth conversion and constructed accurate depth maps of the successive geological horizons. The generated maps are in accordance with the general expectation deduced from the regional geological model while exhibiting new detailed features that are captured and thus represented in the model.
Nevertheless, it should be noted that the time-to-depth conversion methodology, as used in a sequential framework, may eventually lead to a propagation of the errors from top to bottom. To address this uncertainty problem, a more efficient global (joint) approach can be applied. It consists in processing all horizons at once while optimizing the use of the available data, i.e. data from a given horizon are used in the estimation procedure of that horizon as well as the others. This procedure takes advantage of all available data, and thus reduces the uncertainty of the prediction and improves the horizons mapping while reproducing the geological reality. However, a clear correlation between the processed horizons must be evidenced. This is not the case in our current study. Such structural models could be used to simulate facies and petrophysical properties. This provides crucial 3D support for volume calculations, flow simulation and reservoir behavior. This can have a significant effect on consequent reservoir management.
3D geological modeling of the Jeffara of Medenine was based on 3D cokriging interpolation involving geological contact, and orientation data and taking into account faults as external drift. This advanced estimation method is also constrained, as explained in Section 5, by (i) “erode and onlap” and (ii) the stratigraphic column that defines the chronological order of the interfaces. Inferring all these interpolation processes make it possible to solve all uncertainty issues and to avoid the crossing of the geological interfaces mentioned above (Section 3.2). The generated 3D geological model is coherent with the general geological knowledge, it reproduces the spatial distribution of the aquifer systems, the geometric features and the fault network, the thickness variability of the faulted geologic units, their lateral extent and their continuity to the land surface.
The outputs provide a sound basis for a better understanding of the geological configuration, the heterogeneity and connectivity of the reservoir units, in both local and regional scales. This effectively helped to identify the regional pattern of groundwater flow and the exchange of water between the different aquifer compartments and to propose rational solutions for water recharge for the planning of sustainable water resources management in the Jeffara. The model could serve as a support for hydrodynamic modeling, to investigate processes associated with inter-aquifer mixing, including groundwater contamination [Hammami et al. 2021, 2022a, b, 2023].
The present work demonstrates the potential of such modeling multiscale approach to assist decision-makers in their exploration or research programs and resources management. Large regional and, more specifically, transboundary aquifer systems require a new way of thinking that can help to better understand the complexity of the subsurface structure and its associated uncertainties. This approach can be improved by implementing conditional simulation to generate multiple realizations of the subsurface, which can then be used to make more informed decisions about exploration and resources management.
7. Conclusions
In this work, we present original multiapproach methodologies to build regional and local architectural models in the extensive Jeffara basin, lying on the southern shore of the Mediterranean, using advanced geostatistical algorithms. The workflow offers a level of approach combination and accuracy to reconstruct and interpret the regional/local stratigraphic/tectonic setting of the main sedimentary sequences belonging to the Cretaceous-Mio-Plio-Quaetrnary interval. The developed methodology allowed to implement efficient procedures to deal with two major constraints the data scarcity and their unequal distribution and the complex geological setting. It enabled integrating a large variety of multisource data, i.e., outcrops data, boreholes, oil wells, satellite images, geological and structural maps, lithostratigraphic cross-sections, seismic data and more importantly geological reasoning. Actually, this large database represents the most detailed and extensive sampling ever considered in such a modeling procedure in the region. On the other hand, the joint application of geological, hydrogeological and geostatistical methods shows that it is possible to significantly improve the integration and the reliability of existing and extended data and to enhance the characterization of the architecture and the functioning of aquifer systems at large and small scales.
At regional scale, we produced a new comprehensive map of the fault network that affects the extensive area of the Jeffara. In addition, seven major structural domains were distinguished, namely: Medenine-Dhahar, Oglet Mertba, Chotts Fejej-El Hamma, Oriental Erg, Jeffara plain, Gulf of Gabes and Mediterranean. Accordingly, a thorough correlation with the hydrostratigraphic framework allowed us to get a better understanding of the structural arrangement of the multilayered aquifer systems that extend in the region, i.e. the aquifers of Gabes, Zeuss-Koutine, Sahel El Ababsa and Jorf. We revealed that this specific layout of these aquifer systems was significantly conditioned by the tectonic events that occurred in the region.
At local scale, the integration of 2D seismic profiles and well-logging data allowed building a 3D geological model to highlight the existing relations between the coastal aquifer system units. The time-to-depth conversion, using kriging with external drift, revealed a complex structuring of the studied coastal aquifers with numerous NE–SW oriented Horsts and Grabens, combined with NE-dipping bedding planes triggered by major NW–SE faults. Downdip tilting prevails in the Jorf area, bringing the aquifer formations to greater depths. The extended data allowed to accurately reproduce the geological bodies in space: i.e. stratigraphic series, fault patterns and the compartments’ repartition within each aquifer system. The newly revealed fault system, at reservoir scale, contributed to a thorough re-evaluation of the structural/stratigraphic configuration, geometry and spatial extent of the subtle structural features, seals and reservoirs included within the coastal Jeffara of Medenine aquifer systems. A comprehensive correlation of the potentiometric gradient/lithologic properties along aquifer compartments and the hydraulic behavior of tectonic faults allowed to identify the flow exchange between reservoir units and between aquifer compartments. This brings out the preferential flow paths at large and small scales.
The geological model outputs constituted fundamental basis to conceive a reasoning approach based on AHP overlaying methods to accurately predict infiltration capacity, to regionalize potential GWR zones, and to propose adequate types and location for MAR systems. This constituted one of the major contributions of this study as it provided a sound basis for planning sustainable water resources in such arid environment where surface water supply is inadequate.
Uncertainty is an inherent aspect of geological modeling, and this study provides an illustration for each modeling process. Although we have integrated a vast amount of data, there are still limitations and uncertainties in some of the data sources, such as the quality of seismic data. The use of geostatistical algorithms fortunately allows uncertainty to be addressed, particularly in areas where data is scarce. Inferring the adequate interpolation processes and geological constraints makes it possible to solve the major uncertainty as mentioned above. We also recommended several solutions that could refine and improve the modeling processes and to further mitigate uncertainty, so as to increase the accuracy and realism of geological models. In this respect, and for example, the proposed geomodeling approaches could be improved by implementing conditional simulation to generate multiple realizations of the subsurface heterogeneities, which can then be used to make more informed decisions about exploration and resources management.
As for future work, there are several avenues to explore. One area of interest is the potential impact of climate change on the hydrogeological system of the Jeffara basin. Considering the region’s arid environment and the significant importance of its aquifers, it is important to investigate how shifts in precipitation patterns and rising temperatures may affect water resources availability and quality in the future.
Another important direction for the application of such multiscale modeling is to support decision-makers in exploring and managing resources in regions with similar geological and hydrogeological settings, particularly in arid or semi-arid areas. This could help improve our understanding of aquifer systems and their behavior, which could ultimately lead to a more effective and sustainable management of water resources. It is also of major strategic importance to address large regional and transboundary aquifer systems. These are often shared by two or more countries and may trigger conflicting demands for water resources. By using such multiscale modeling in these areas, we can broaden the understanding of aquifer systems and their functioning across national boundaries, thereby helping to identify potential areas of concern and to develop strategies to prevent or resolve conflicts between different stakeholders. This can ultimately contribute to more equitable and sustainable water resource management practices.
Conflicts of interest
Authors have no conflict of interest to declare.
Acknowledgments
This work was part of the project “Geomodeling and Natural Resources Characterization”, undertaken in the Georesources Laboratory of the Center for Water Research and Technologies and supported by the Ministry of Higher Education and Scientific Research. The authors would like to thank the Tunisian National Oil Company (ETAP) for providing seismic and petroleum well data and the General Directorate of Water Resources (DGRE) for providing borehole data.