


 CC-BY 4.0
1. Introduction
Rivers, through their erosive power, play a key role in adjusting the landscapes to multiple forcings such as tectonic uplift, sea-level fluctuations or climate variations [Whipple 2004; Whipple and Tucker 1999]. Indeed, bedrock channels set the base level for adjacent hillslopes and thus control long-term relief evolution and denudation rates [e.g., Whipple et al. 2000]. Rivers not only control mass wasting by undercutting hillslopes in mountainous areas [Howard et al. 1994], they also transport the resulting sediments towards depositional basins in mountain forelands [Guerit et al. 2016].
The rate at which river incision shapes landscapes is highly variable and is controlled by processes operating at different temporal and spatial scales [Daniels 2008]. These processes interact with each other, and the study of short-term (<103 yr) processes may allow to better understand their respective contributions together with longer-term forcings (>104 to 105 yr). For example, as climate variations control water discharge in rivers [Ely 1997], understanding how punctual flood events influence bedrock incision rates can provide insights on the long-term landscape sensitivity to climate changes [103–104 yrs, Molnar 2007; Hartshorn et al. 2002; Lague et al. 2005]. Through the recurrence of short-term processes (<103 yr), rivers are irrevocably adjusting their incision rates to long-term tectonic uplift rates in order to achieve an ideal steady state in which vertical incision equals to rock uplift [Whipple and Tucker 1999; Wobus et al. 2006]. However, deciphering the dominant forcing if any (e.g., tectonic vs. climate) remains difficult [Herman et al. 2013].
The so-called “external” forcings control river erosion by providing the necessary tools for bedrock incision: water discharge and sediment availability. While the first provides the energy for sediment transport, the latter acts as a “mechanical tool” for rivers to incise their bedrock [Sklar and Dietrich 2006; Jansen et al. 2011]. However, several studies showed that an excessive amount of sediments will, to the contrary, prevent incision by overloading the river, raising the channel bed by aggradation and therefore temporarily shielding the bedrock [Sklar and Dietrich 2001; Hartshorn et al. 2002]. Furthermore, the efficiency of bedrock incision is controlled by intrinsic morphological and geological features (lithology, slope, with/depth ratio, local relief [Schumm 1977]. The degree of jointing and the weathering state of the bedrock also influence river incision rates [e.g., Whipple et al. 2000]. These added elements together act as a “geological factor” that dictates the locus of erosion and its efficiency [Cowie et al. 2008; Hartshorn et al. 2002; Herman et al. 2013; Sklar and Dietrich 2001].
In fold-and-thrust belts, the folding of sedimentary layers with a distinct resistance to erosion produces complex river network geometries with alternating strike-parallel and perpendicular stream sections defining a transverse drainage pattern [Oberlander 1965; Stokes et al. 2008; Twidale 2004]. Beside these local heterogeneities, large-scale regional horizontal tectonic movements can be detected in the shape of the river network by systematic changes in flow directions resulting from the planar deformation of the river network with its substrate [Guerit et al. 2016]. On the other hand, vertical tectonic motions of the bedrock together with along-channel variations in the rock resistance to erosion will affect both the river longitudinal profile and the shape of surrounding hillslopes. The complete understanding of interactions between such small- and large-scale parameters and incision processes over large spatial and temporal scales is not yet achieved [Jansen et al. 2011].
With the goal to shed some new light on the response of a river system to internal and external factors, we chose to study the High Verdon Gorges (HVG), located in the Southwestern Alps foreland (Figure 1A). The Verdon catchment presents the advantage of cross-cutting the whole Meso-Cenozoic sedimentary sequence of the southern subalpine fold-and-thrust belt, including highly resistant upper Jurassic limestones in which the HVG were carved. The Verdon River headwaters are located in an area previously covered by Quaternary glaciers [Brisset et al. 2015], while its outlet in the Durance river is near the junction between the Alpine deformation front and the Valensole foreland basin (Figure 1B). In this paper, we present new, and use some published [Cardinal et al. 2022], 36Cl Cosmic Ray Exposure (CRE) datings of river-polished surfaces in the HVG and interpret them for the recent (Late Quaternary) period, and discuss a long-term (Pliocene to Quaternary) evolutionary scenario of the Verdon River in its Alpine and Mediterranean context.
(A) Location of the Verdon Catchment in the Southwestern Alps. (B) Simplified geological map of the study area. The Verdon catchment area is underlined by brighter colours, corresponding to the colours in the legend and on the cross-section. The High Verdon Gorge (HVG) are highlighted along the river in pink. (C) Schematic geological cross-section along the Verdon River longitudinal profile. Black crosses indicate the beginning (B) and the end (E) of the river profile. Note that in the profile; Cretaceous, Jurassic and Triassic periods are distinguished from the more general term “Mezosoic” used in the geological map B, as highlighted in the legend. The Black outlined circles 1 to 3 on the map and on the profile indicate the sampling sites. Thick red lines A, B, and C show the location of the topographic profiles shown on Figure 10. Locations numbered 4 to 8 are incision or uplift rates from literature which are discussed in Section 5.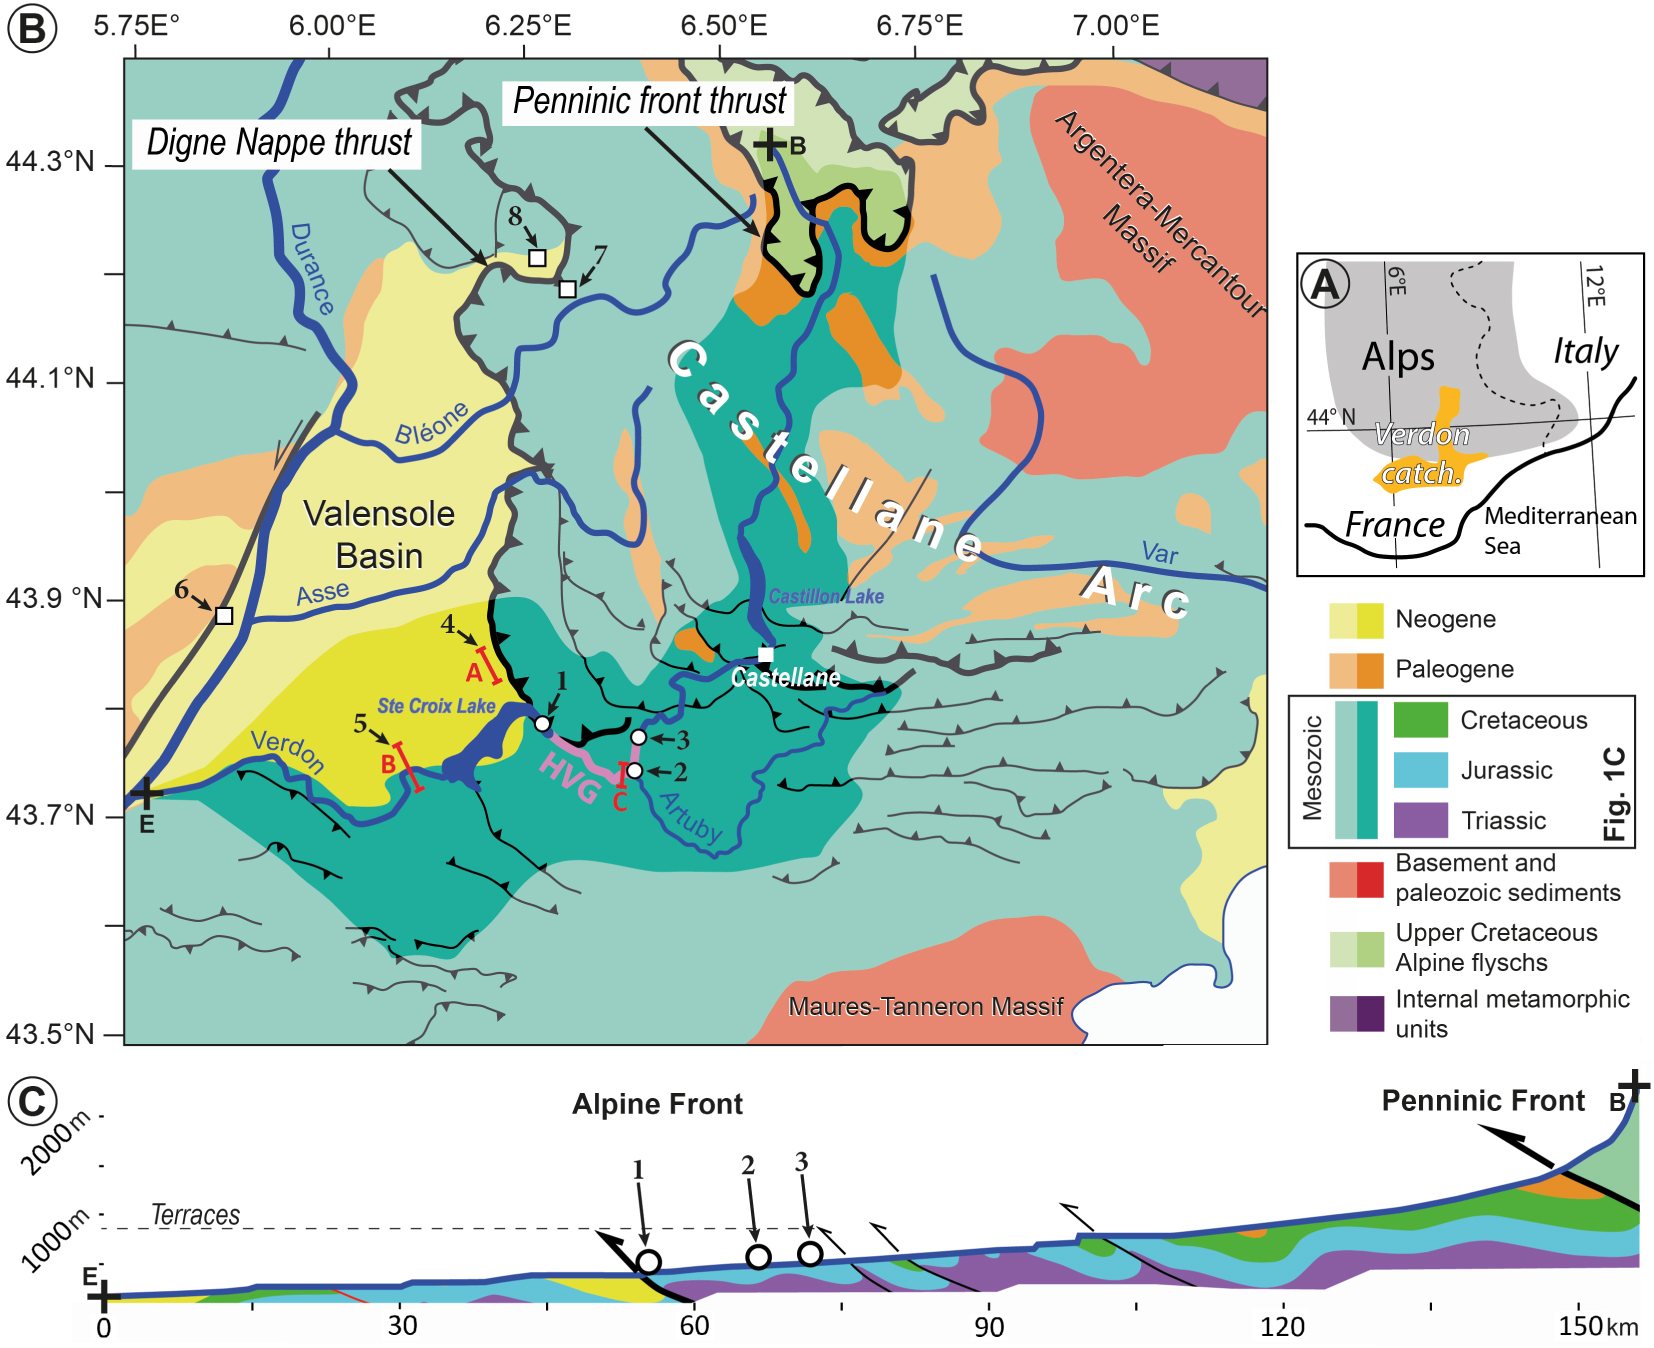
2. Context
2.1. Structural context and drainage patterns of the Verdon River
The study area is located upstream of the foreland basin of the Southwestern European Alps (Figure 1A and B). The Castellane fold-and-thrust belt (also called the “Castellane Arc”) was first formed during the Pyrenean collisional phase (Cretaceous to Eocene) and underwent reactivation during the Oligocene due to the onset of Alpine collision and SW propagation of the Penninic front, which resulted in the development of an Oligocene foredeep filled with turbiditic sequences [Espurt et al. 2012; Jourdon et al. 2014]. During the Miocene, compressional deformation propagated outwards and caused the uplift of the sedimentary wedge together with the flexure and filling of the Valensole molassic basin in the foreland (Figure 1B). This deformation phase ended with the underthrusting of Neogene molassic sequences below the Digne Nappe during Late Miocene times [Schwartz et al. 2017]. The Valensole basin is filled with marine to continental conglomeratic sequences, and erosional unconformities have been tentatively correlated to the Mio-Pliocene transition marked by the Messinian Salinity Crisis [Clauzon et al. 1996, 2011; Hippolyte et al. 2011]. The last marine sequences found in the Valensole basin are dated as Late Tortonian and correspond to shallow water molasses [Ford et al. 1999; Ford and Lickorish 2004]. Gravel deposits mark the end of sedimentation in the Valensole basin, the upper surface of which has been dated around 1.8 to 2 Ma; however, towards the Alpine front, alluvial cones continue to prograde on the basin, ending with the Balene breccia formation dated at 0.7 to 1 Ma [Dubar 1984; Dubar et al. 1998]. The arrival of coarse, detritic deposits in the Valensole basin in the early Quaternary (ca. 2.4 Ma) is interpreted as reflecting active tectonics on the Castellane Arc and/or cooler climatic conditions [Dubar 1984; Dubar et al. 1998].
With a length of 166.5 km and a catchment area of 2218 km2, the Verdon River is the main tributary of the Durance River. The Verdon River and its catchment have their headwaters in the Helminthoid flysch nappes (∼2500 masl) and run towards the south through the unmetamorphosed Mesozoic sedimentary cover of the Alpine foreland. Near the city of Castellane, the Verdon course takes a turn upon encountering the outer folds and thrusts of the Castellane Arc and consequently flows in a W–E direction, wandering around and cutting across the fold axes [Chardonnet 1943; Jorda 1975]. From this point, the Verdon cuts its way through Jurassic limestones in which it dug one of the most impressive European gorge, the High Verdon Gorges (HVG, Figure 1A). Downstream, the Verdon River meets the Valensole Plateau and follows the Valensole conglomerate regular slope while repeatedly crossing some Jurassic limestone outcrops [Goguel 1935], until it reaches its outlet in the Durance River (255 masl, Figure 1B). The longitudinal profile of the Verdon River reflects well lithological variations encountered along the channel length. Indeed, significant convexity can be seen where the river has incised the massive Tithonian limestone and formed the HVG, whereas upstream and downstream, the river profile, although modified by artificial dam lakes, is overall concave (Figures 1C and 2).
(A) Verdon River profile and location of the HVG and dam lakes. (B) Longitudinal profile of the Verdon River along the HVG, lithology schematic outcrop and location of the sampled sites. Black crosses indicate the beginning (B) and the end (E) of the river profile (see location of these point in Figure 1B).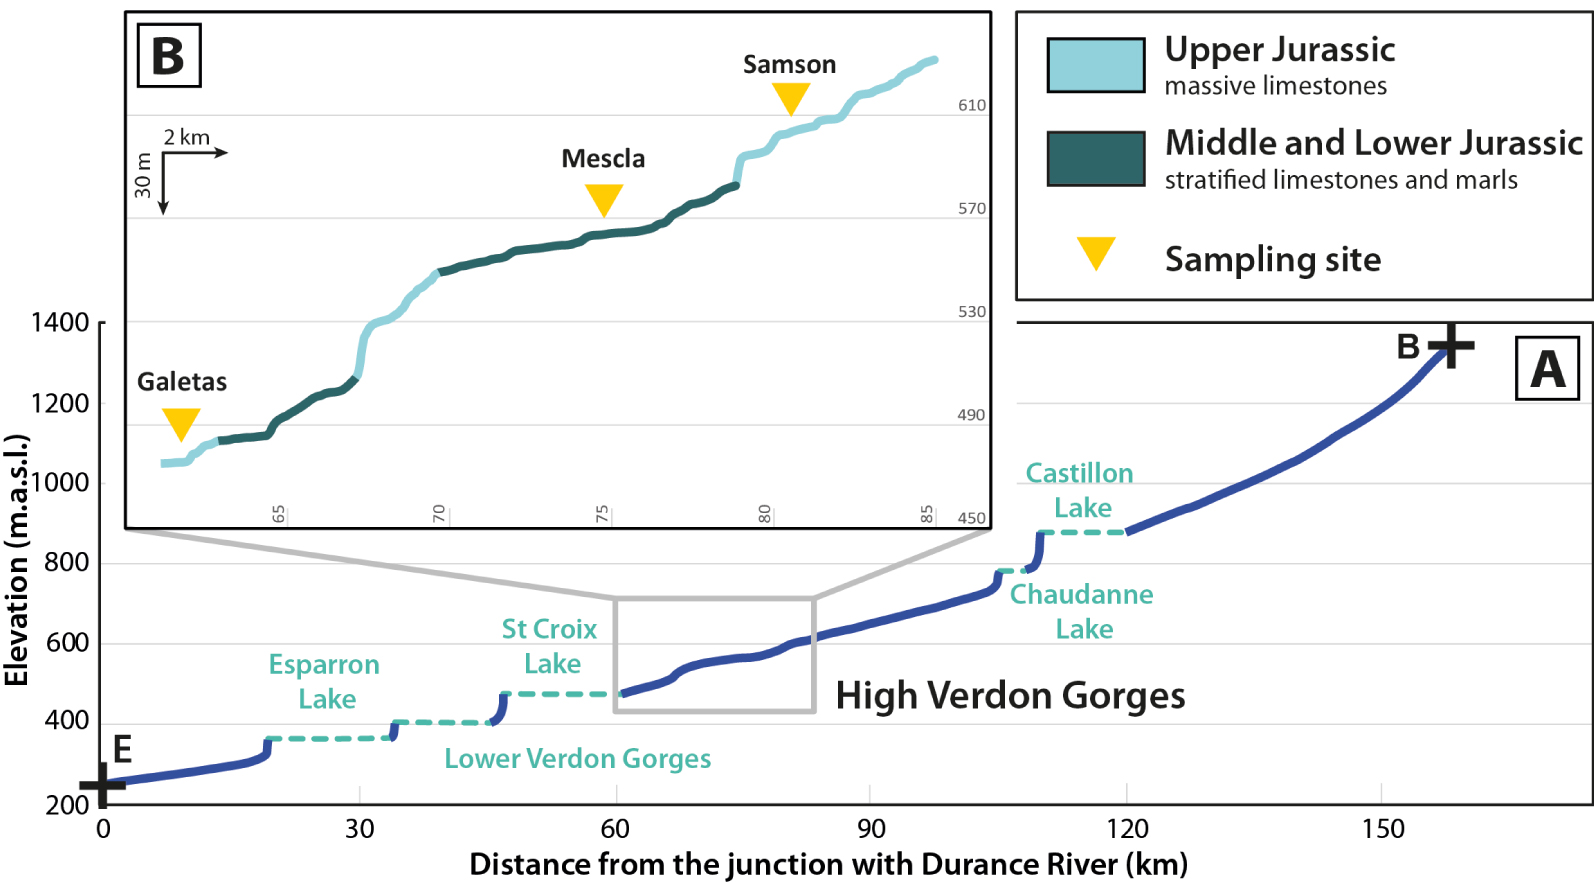
The origin of the Verdon River course is a matter of debate. Indeed,the upstream portion of the river trends roughly parallel to the N–S direction of tectonic structures [Goguel 1935; Jorda 1975]. Further its middle part crosscuts sub-perpendicularly the fold axes affecting the Jurassic cover, while encompassing the upper part of the HVG and the southern boundary of the Castellane Arc [Chardonnet 1943], from the city of Castellane to the junction between the Verdon and Artuby rivers (Figure 1B). To explain these cross-cutting relationships, many authors agree on the hypothesis that the Verdon River course is, in the area, antecedent [Blanchard 1915; Chardonnet 1943; Goguel 1935; Nicod 2004]. This hypothesis implies that the Verdon River was originally flowing on a rather low-relief peneplane and was then forced into incising the underlying Tithonian limestones during a Cenozoic tectonic uplift episode [Chardonnet 1943].
2.2. Catchment morphology
The overall “L shape” of the Verdon catchment suggests possible drainage captures [Blanchard 1915] and/or a complex adaptation to a deformed terrain [Goguel 1935]. From a closer look, the Verdon catchment and long river profile (Figure 1) can be divided into three portions:
- The upper Verdon Valley, from the headwaters to downstream of Castellane town;
- The HVG, knickzone interrupting the overall concave profile (Figure 2A);
- The lower Verdon Valley, from the Sainte Croix Lake to its junction with the Durance River.
Regarding the upper section, the Verdon River catchment width decreases downstream as a result of massive captures from the Asse and Bléone rivers to the West and from the Var River to the East [Blanchard 1915; Chardonnet 1943; Jorda 1975]. These authors considered that the HVG constitutes a abnormally high local base level for the upper Verdon. The HVG forms a limestone (Tithonic) lithological knickpoint which likely mitigates the propagation of incision upstream, as observed in several studies [Crosby and Whipple 2006; Jansen et al. 2010; Bishop and Goldrick 2010; Cardinal et al. 2022]. Therefore, undergoing slower incision, the upper Verdon mean elevation remains high, which makes it vulnerable to capture by the more competitively erosive surrounding catchments. The high mean elevation also allowed extensive glacier coverage in the upper Verdon catchment. For comparison, the Würmian glaciers extent reached a length of 40 km along the Verdon River, against only 20 km along the Var River. The HVG therefore has a high impact on the morphological evolution of the upstream catchment. Between the Sainte Croix and Castillon lakes, the HVG course displays a complex pattern (Figure 1B). Downstream, the Verdon drainage area then considerably grows from the contribution of the Artuby River (from 962 km2 to 1300 km2) and the incorporation of the Valensole Plateau drainage network.
2.3. High Verdon Gorges morphology
The 26 km-long HVG (Figure 3A) appears as a deep cut in the massive limestones of the Mesozoic sequence. The cohesive nature of the bedrock results in maintaining steep walls with mean height around 300 m (Figure 3B, C), which makes it one of the most impressive mountain gorges in western Europe. However, the limestones show different facies along the gorges, from the compact late Jurassic to early Cretaceous Tithonian bars with limited jointing, to middle–upper Jurassic limestones and marls with a higher degree of bedding, fracturing and weathering (Figure 2). The lithological variations are visible on the river profile in the HVG, where Tithonian limestone outcrops are highlighted by strong knickpoints (Figure 2B). Furthermore, the gorge transversal profile is alternatively wide and narrow (Figure 3A), in agreement with the successive outcropping of middle–upper Jurassic and Tithonian limestones, respectively [Martel 1908], demonstrating the contrast in rock resistance along the gorges.
(A) Aerial image (IGN) of the HVG with the main topographic features and the location of the sampled sites and photos point of view (B and C). (B) Samson Corridor and location of the Collet-Baris anticline. (C) Location of the possible ancient Verdon thalweg position.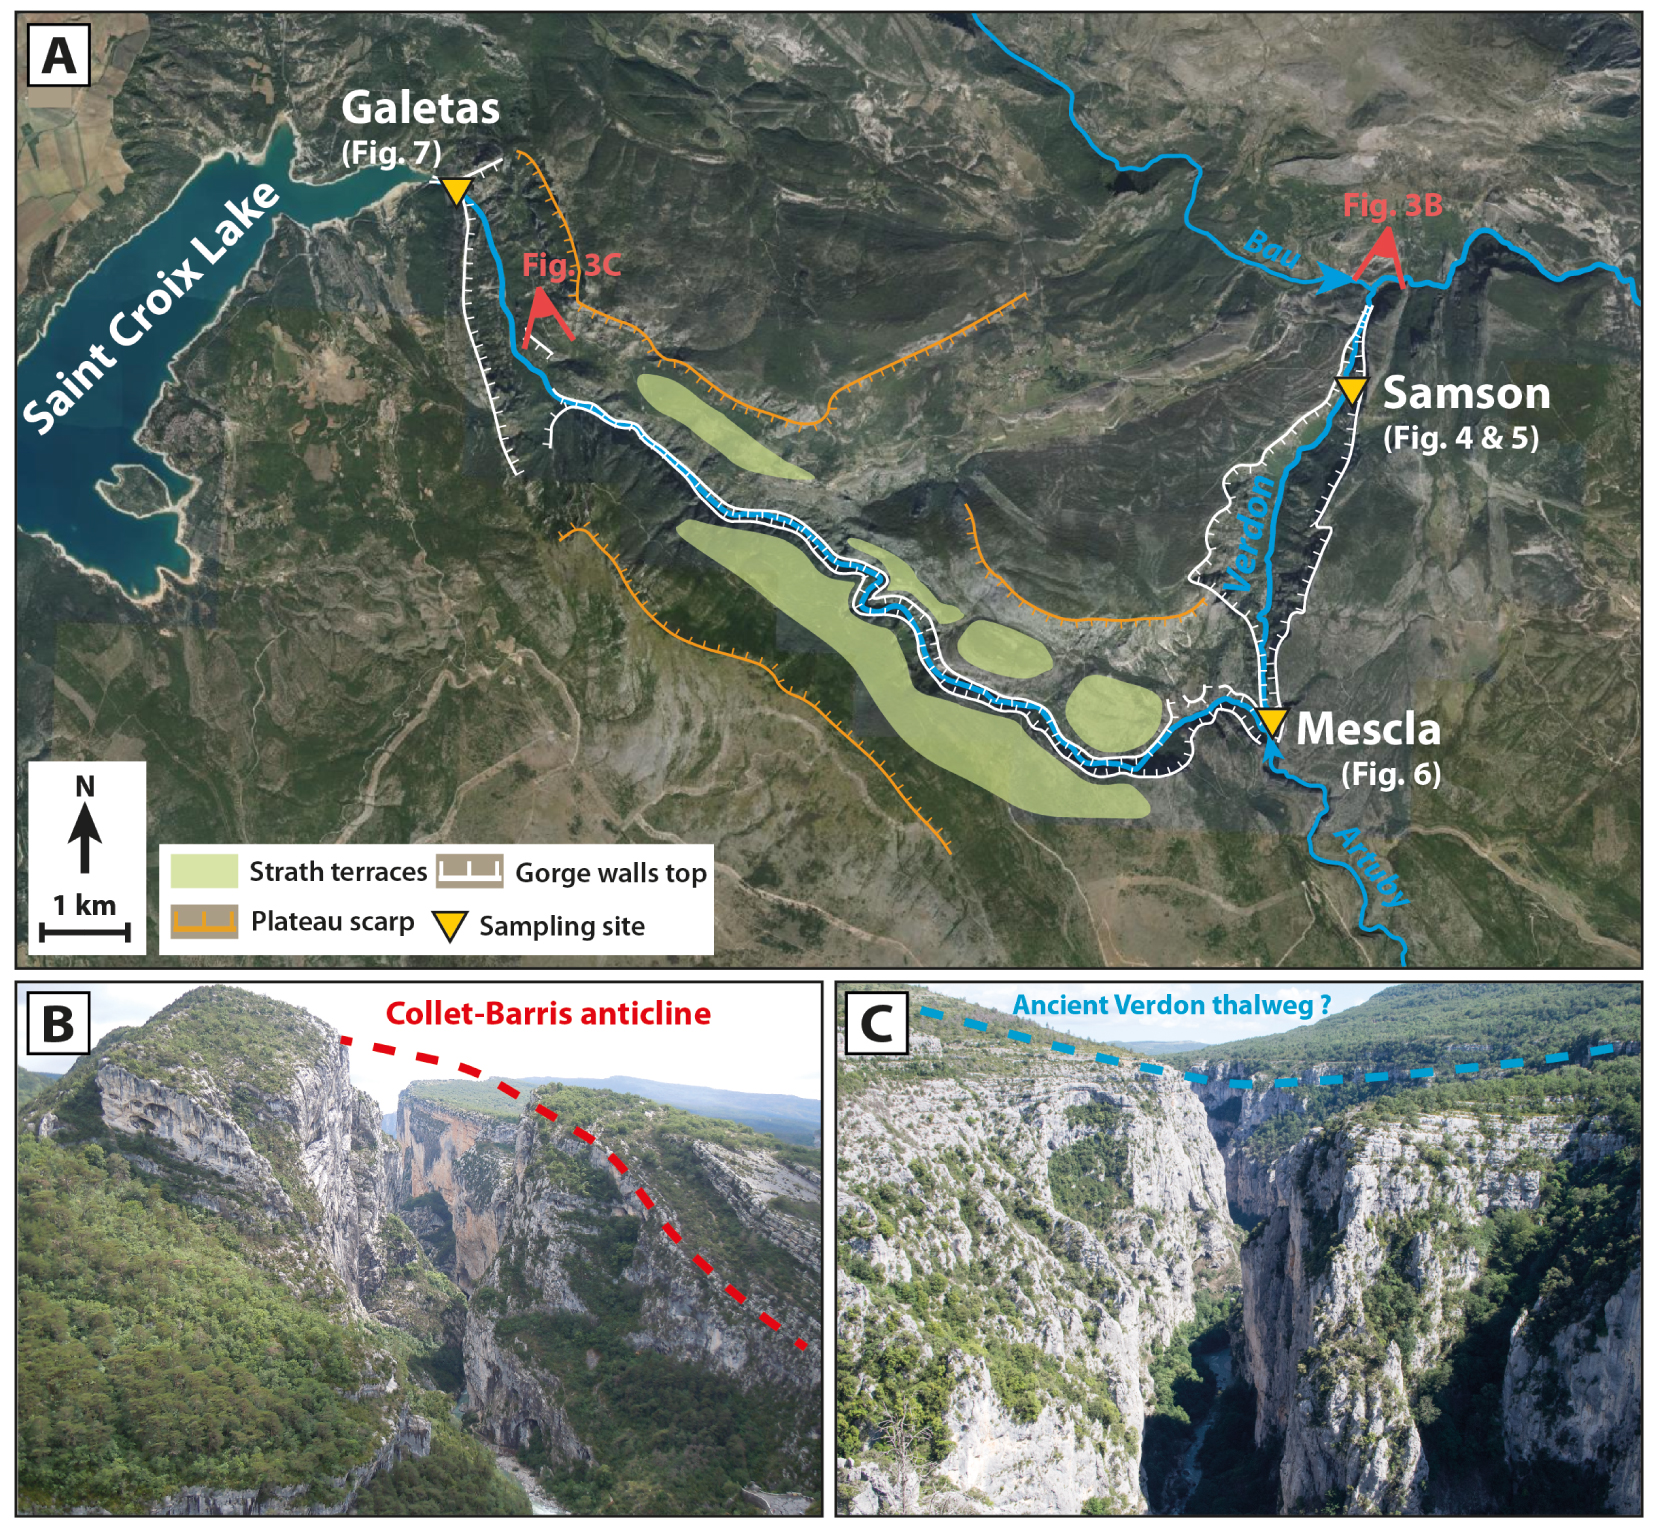
A combination of rock falls, fluvial and karstic erosive processes operates inside the gorges [Chardonnet 1943; Martel 1908; Nicod 2004]. The gorge walls are affected by rock falls, creating scree slopes overgrown by vegetation at the foot of weak lithology walls and large boulder accumulations in the riverbed overlooked by resistant lithology walls. Intense fluvial erosion is visible through the widespread presence of pot-holes and polished surface, sometimes preserved high up in the steep walls but especially along the riverbanks and within the boulder accumulation in the river bed (Figure 4). Locally, the development of karst network results in open cavities and large overhangs (called “baumes”; Figure 4). These cavities in turn guide the course of the river and focus the fluvial erosion. The karstic network is also intricated with the current riverbed. Indeed, a part of the river flow is incorporated into the subsurface karst system at “La Mescla” [Figure 3A, Blanchard 1915; Fabre and Nicod 1978].
Field pictures of the High Verdon Gorges (at the vicinity of the Samson sampling site) and highlight of the main geomorphological erosion features.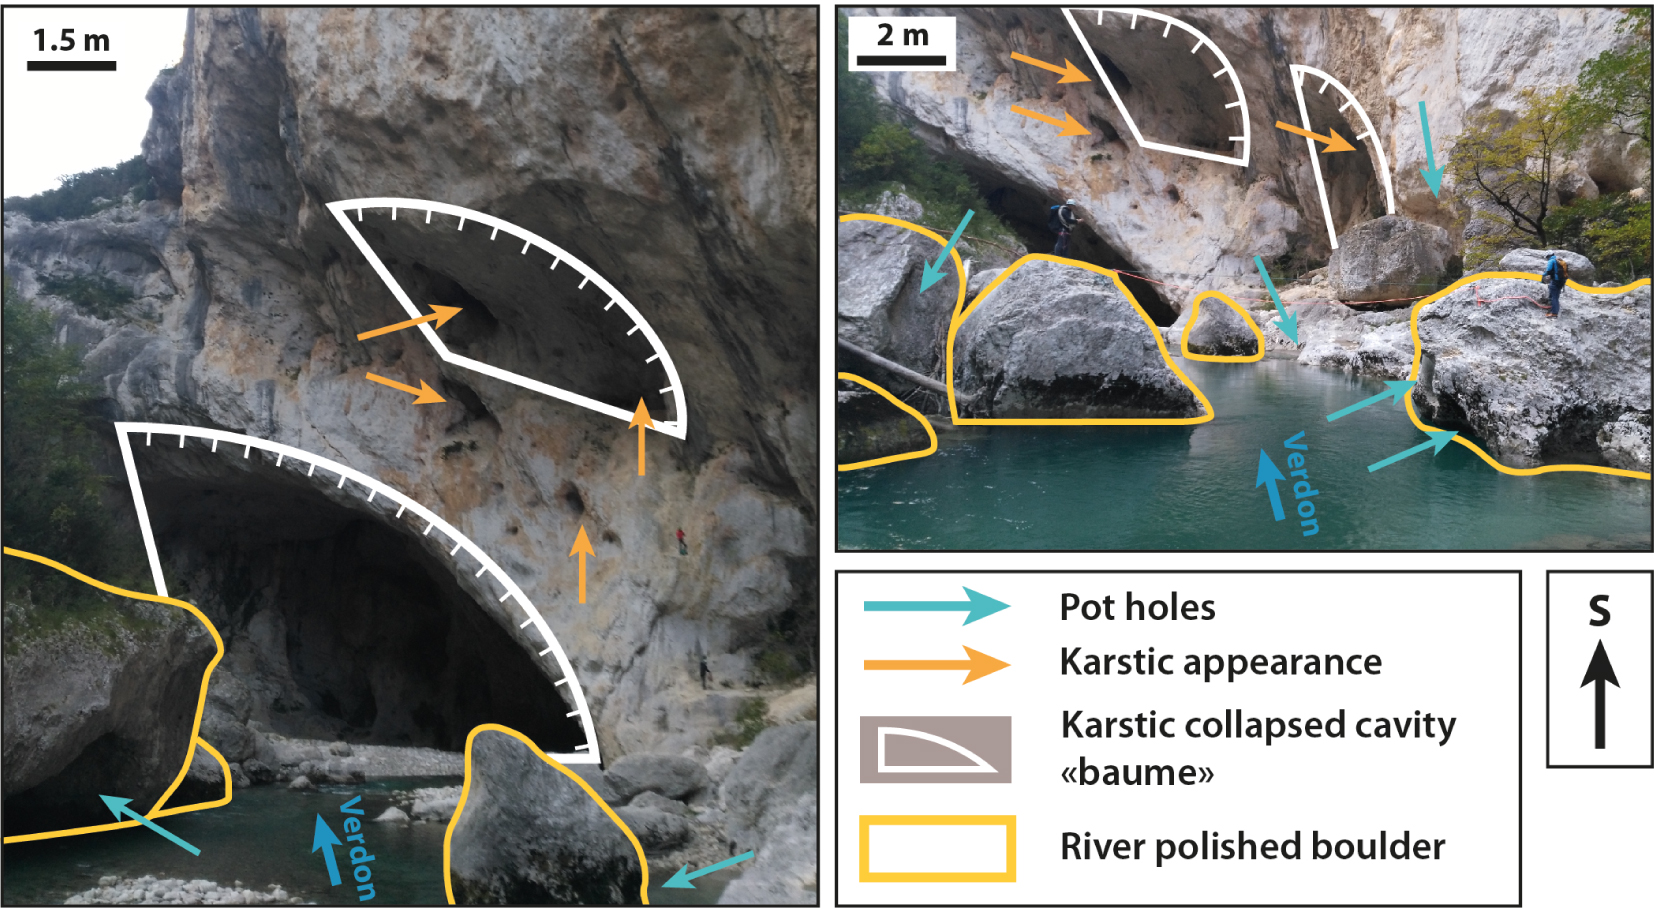
2.4. Incision of the High Verdon Gorges
The top of the HVG vertical walls are marked by a flat erosion surface (Figure 3A), possibly corresponding to a level of terraces as their slope does not match that of the limestone bedding [Chardonnet 1943]. Located between 800–850 masl, the terraces level is visible along the downstream part of the HVG, after La Mescla [Martel 1908]. The terraces are not present in the upstream part of the HVG, but the numerous emergences of karstic network at the same altitude (800–850 masl) suggest that this paleo-level is continuous along the whole HVG [Chardonnet 1943]. These terraces underline an ancient and wider river channel (Figure 3C), which is different from the present steep and narrow HVG.
No geochronological constraint is available to precisely determine the timing of incision and the formation of these terraces. However, some geological indices can help estimating the period at which the incision started. Indeed, continental deposits (conglomerates) from the Late Pleistocene, corresponding to the latest period of filling of the Valensole Basin, can be found at the same elevation as the terraces and karstic network, i.e., between 800–850 masl [Blanc 1992; Chardonnet 1943]. The event responsible for the onset of the HVG formation is believed to be the massive sea-level drop related to the Messinian Salinity Crisis [Blanc 1992; Nicod 2004], as proposed in surrounding areas [Clauzon et al. 2011; Hippolyte et al. 2011]. However, some authors suggest that the formation of the HVG is not older than the Pliocene [Chardonnet 1943]. From the elevation of the karstic network in the Lower Verdon Gorges (downstream of the St Croix Lake), Blanc [1992] estimated an incision rate of 0.34–0.33 mm/yr since the Pliocene-Quaternary boundary. However, no available data allows constraining incision rates for the recent Quaternary period.
3. Methods
3.1. Sampling strategy
In order to bring new insights on the incision history of the HVG, three sites were selected and sampled for dating with the Cosmic Ray Exposure (CRE) method.
Field pictures of river-polished surface sampled in the Samson Corridor and sample locations. Note the presence of pot-holes attesting of the surface preservation since its exposure by incision.
Considering the size of the HVG, it seemed more adequate to sample several sites along the gorges rather than one single wall as done previously in neighbouring areas [Valla et al. 2010; Saillard et al. 2014; Rolland et al. 2017; Petit et al. 2019; Cardinal et al. 2021, 2022]. The main challenges in the HVG were the narrowness of the gorges and the along-strike lithological variations. Indeed, the portions of the gorges made of the most massive (Tithonian) limestones, in which well-preserved river polished surfaces can be expected, are also the narrowest ones, limiting exposure to cosmic rays due to strong topographic shielding. Conversely, well-exposed surfaces were found in portions of the gorges where the stratified limestones bedrock is very fractured and was most likely impacted by post-incision erosion process (mainly rock-falls). A compromise between gorge-wall preservation and reasonable topographic shielding resulted in the selection of three areas along the HVG (Figures 3, and 5–7) located in:
- The downstream part of the Samson Corridor, at the upstream entrance of the gorge;
- La Mescla, in the middle part of the gorges, at the junction with the Artuby River;
- The Galetas bridge, at the gorges outlet.
(A) Field pictures of river-polished surfaces sampled at La Mescla with sample location. Bedding (yellow dashed line) is gently dipping southwards (5°). (B, C) Details on Section 1 with overhanging walls. (D) Sketch map of the La Mescla site. (E, F) Schematic topographic cross-sections of Sections 1 and 2.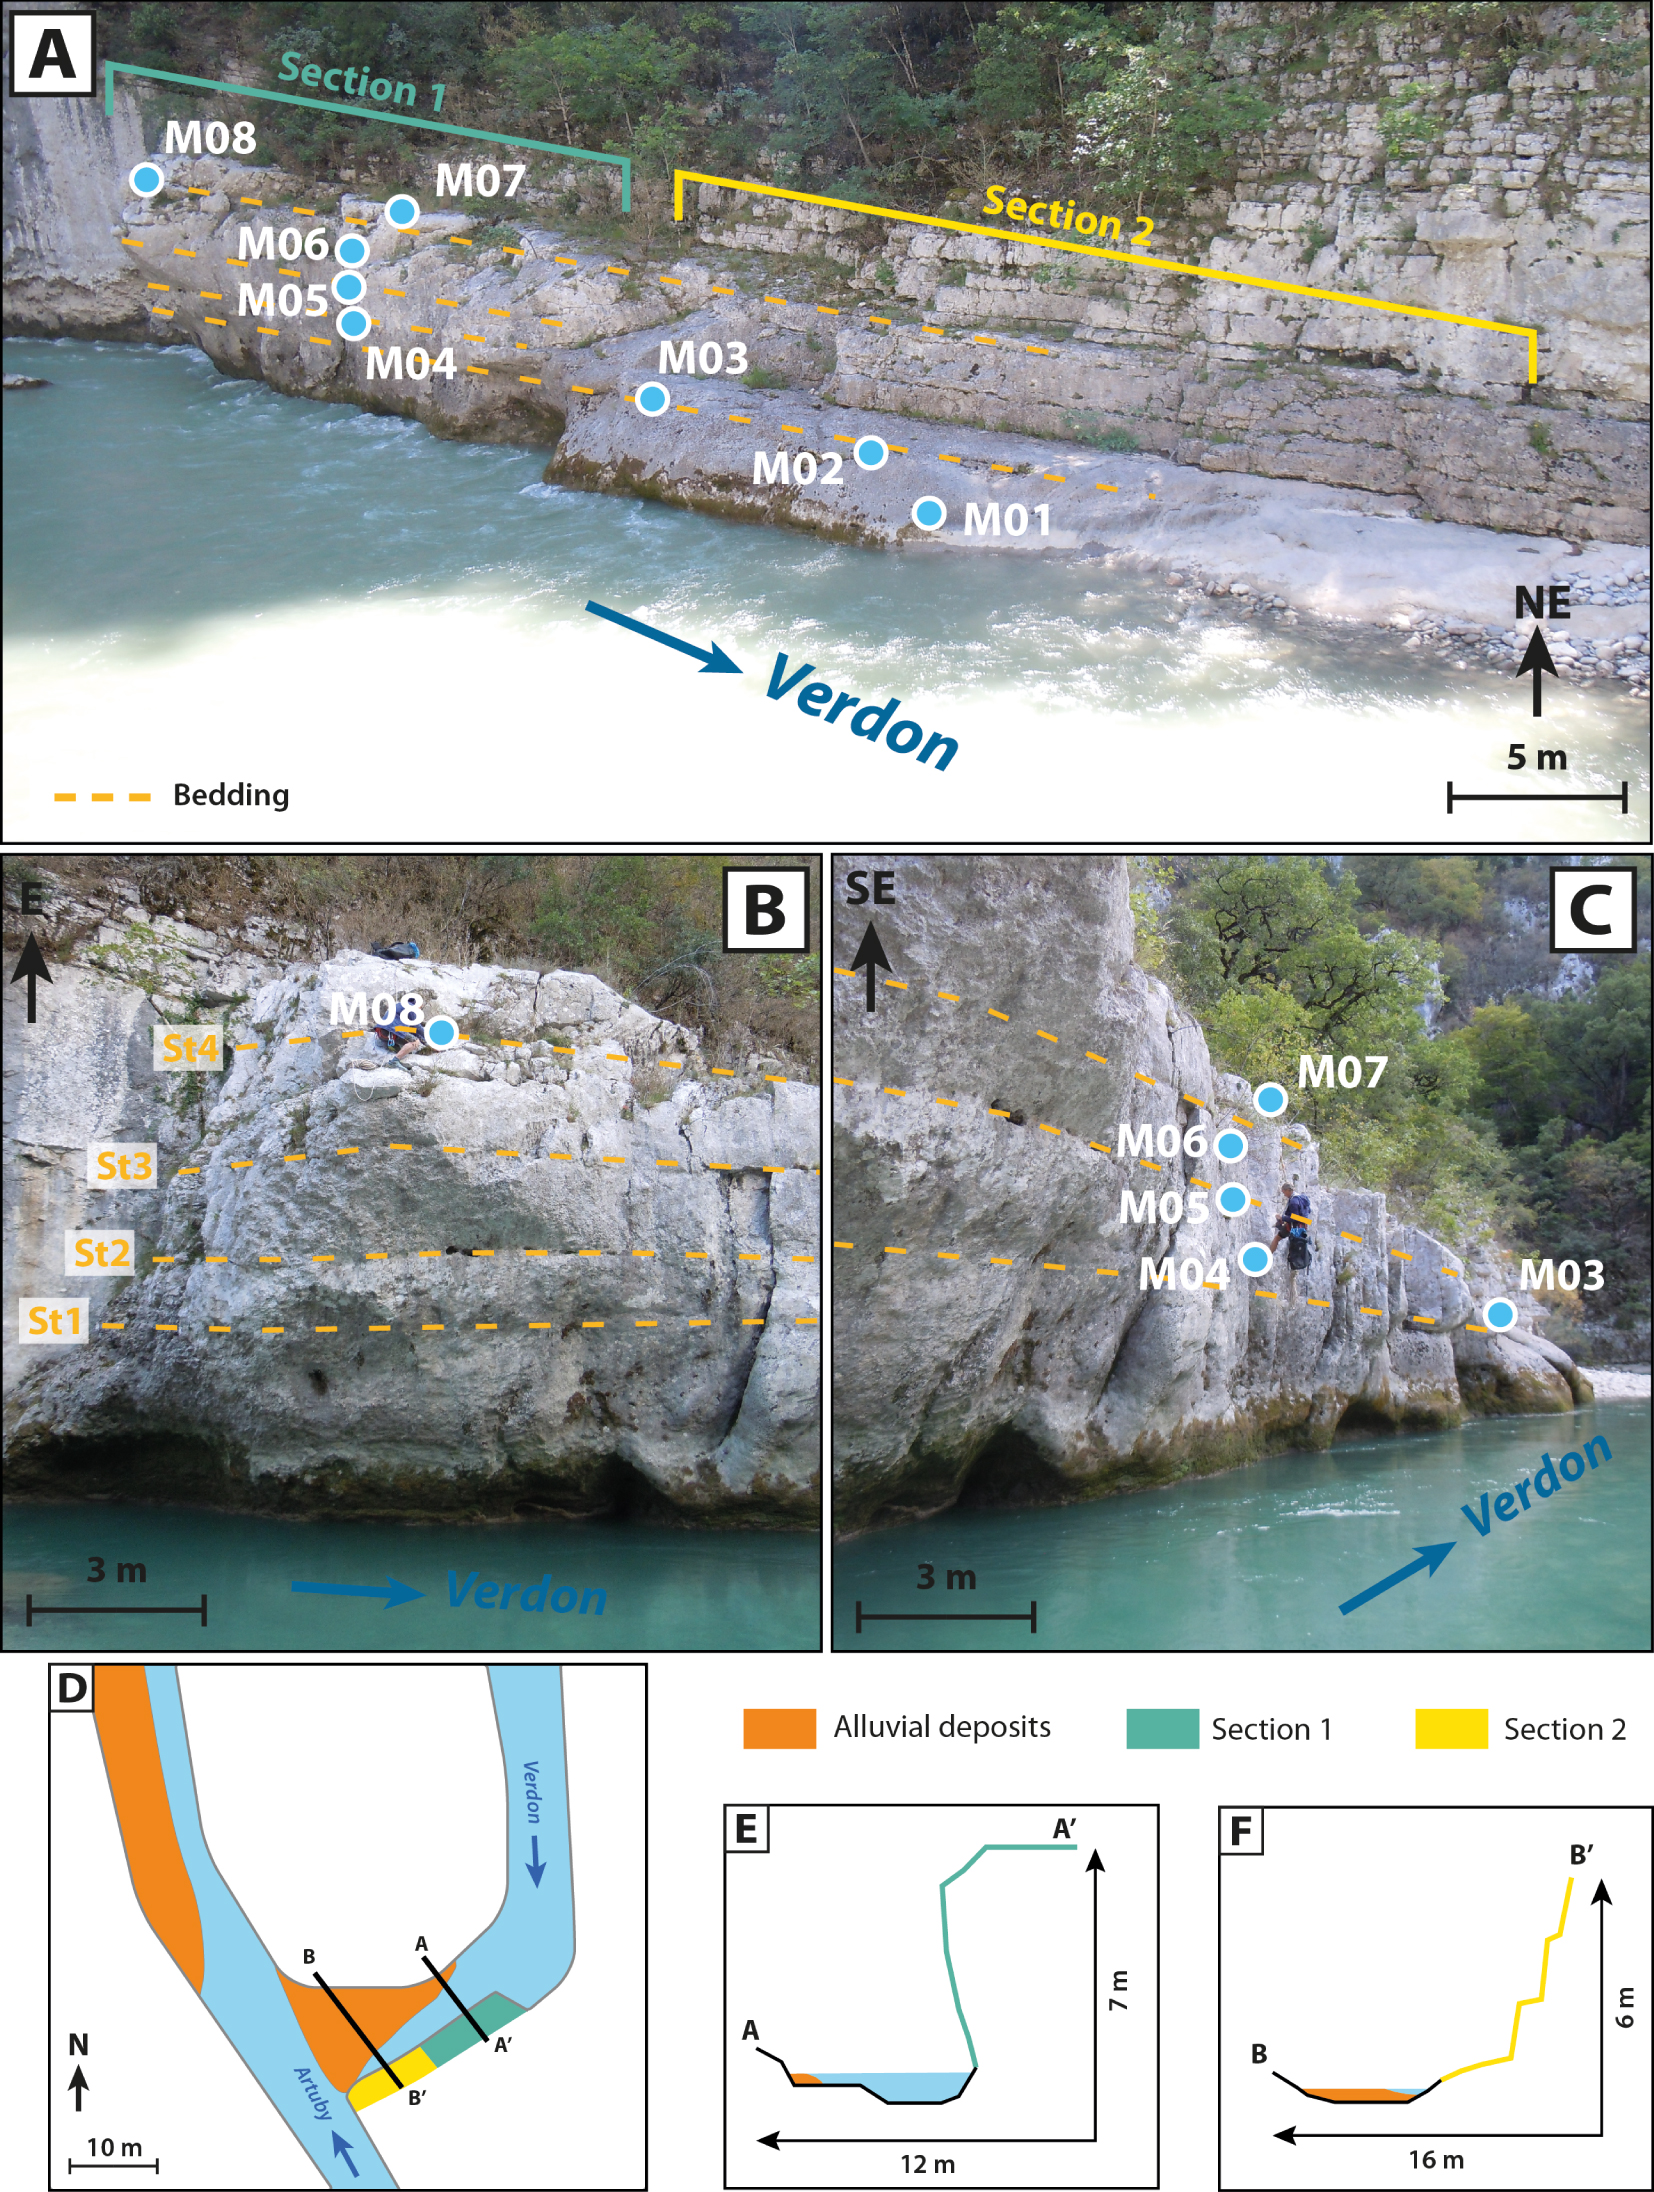
(A) Aerial image (IGN) of Galetas area and location of the three sampled river-polished surfaces. (B–D) Details of the three sampled river-polished surfaces and sample locations. Blue arrows show the river flow direction.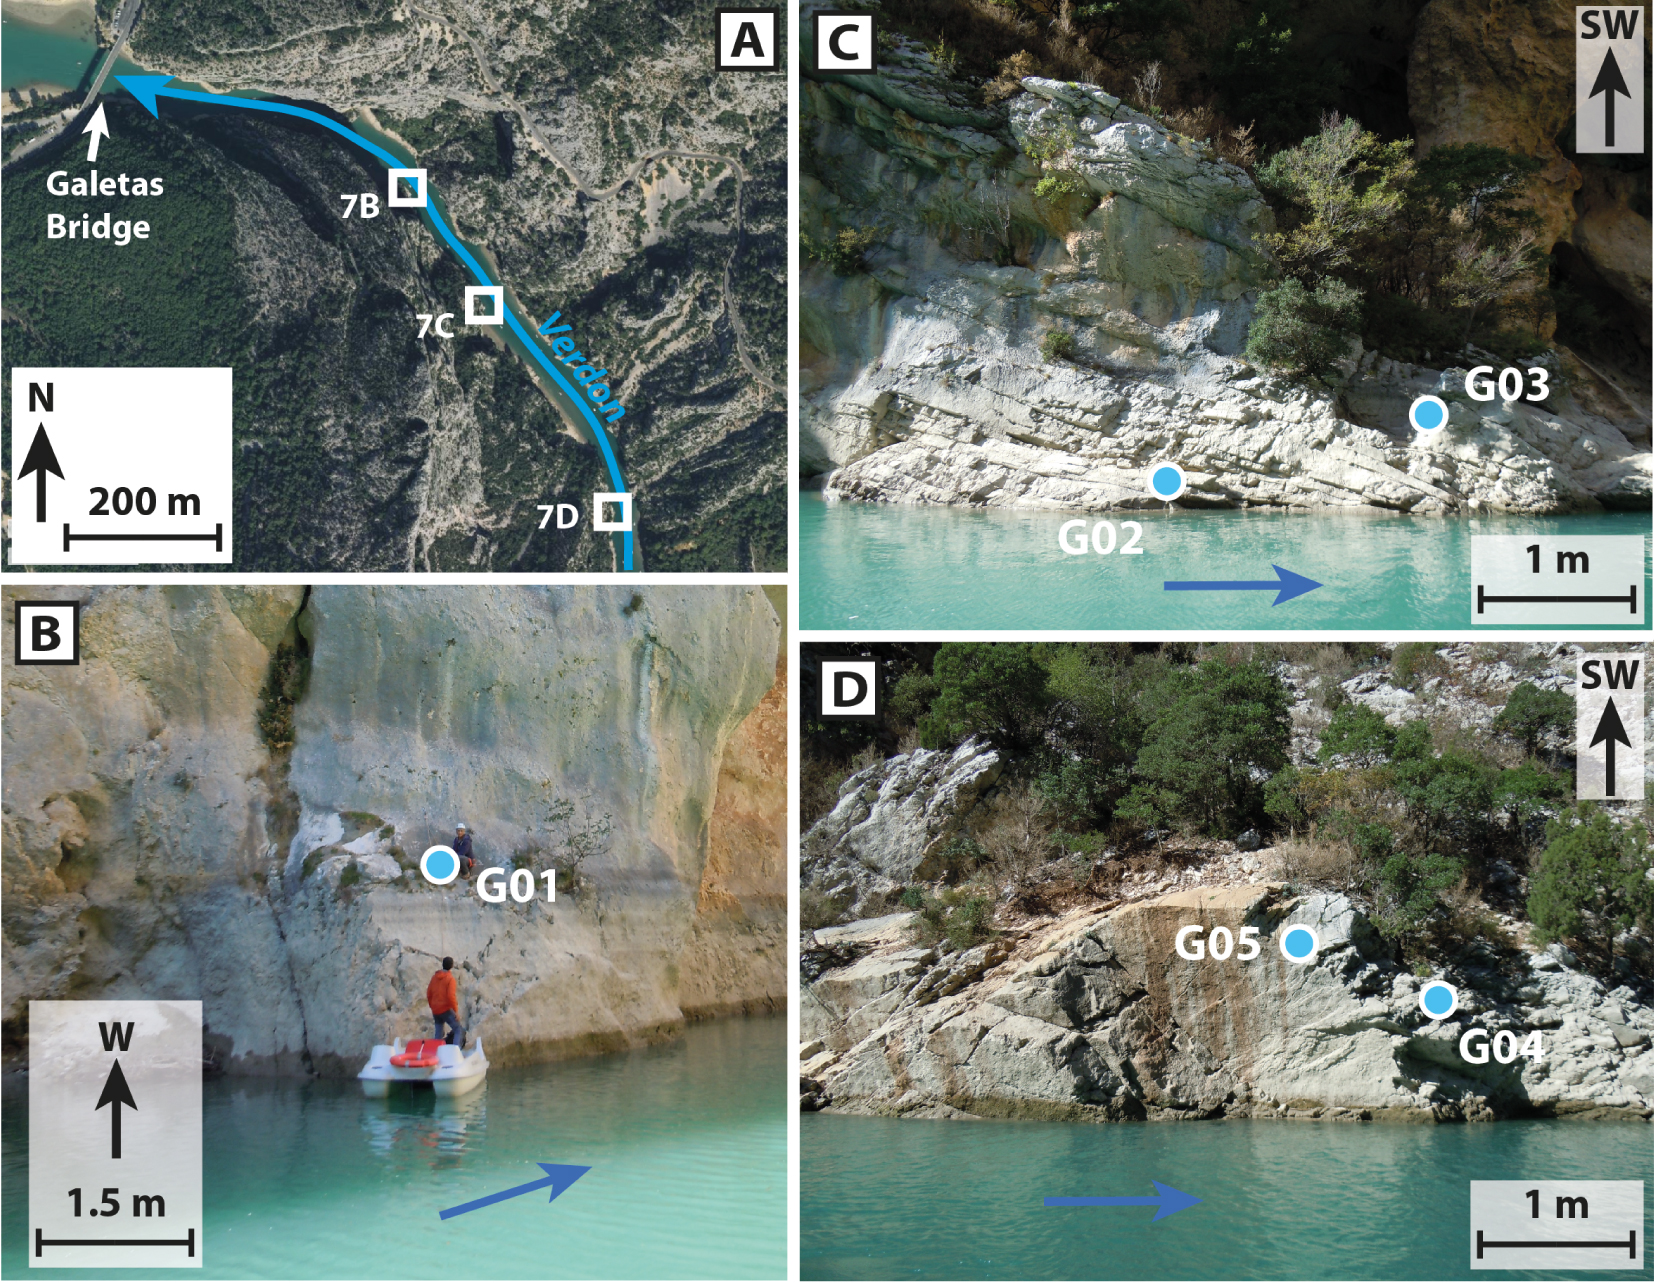
While being very narrow but well-preserved, the Samson Corridor opens up in its downstream part to a wide section of the gorge (Figure 3A), corresponding to a lithological change from massive to stratified limestone (Figure 2B). Sub-vertical polished surfaces showing good preservation with the presence of pot-holes were sampled (Figure 5).
La Mescla, is characterized by a deep meander at the junction with the Artuby River (Figure 3). Fluvial incision focused on the south flank by the tight curve of the meander has opened up this portion of the gorges and created a much wider space than in the direct surroundings, resulting in a more optimal exposure to cosmic rays. Although this portion of the gorges is characterized by thin and heavily fractured limestone beds, some river-polished features are visible in the thickest strata (Figure 6A–C). Two strikingly different polished surfaces were sampled (Figure 6). Section 1 (Green area, Figure 6A, D) is directly facing the entrance of the meander, while the second one is located slightly downstream, at the centre of the meander (yellow area, Figure 6A, D). The first section shows an overhanging profile, with pot-holes in the lower part and underwater erosion pools at the foot of the wall (Figure 6B, C, E), while the second section shows a smoother, nearly flat profile in its lower part (Figure 6A, F). The site is also characterized by considerable sediment aggradation, creating a pebble cordon growing towards the Artuby River junction (Figure 6D).
At the Galetas bridge, we were confronted with the limit of accessibility, both from above, because of the height of the gorge walls, and below, because of the river depth. Therefore, instead of a vertical profile along a single wall, we choose to sample a longitudinal profile by sampling three polished surfaces at 8–10 m above the modern riverbed along the massive Tithonian beds that form the outlet of the HVG (Figure 7). The samples were collected with a hammer and chisel and their height above the river bed was measured with a tape measure.
3.2. 36Cl CRE dating
36Cl concentrations in collected limestone samples were quantified in order to estimate Cosmic Ray Exposure (CRE) ages and unravel the exposure history of the steep (almost vertical) bedrock gorge walls that were theoretically gradually exposed through river incision [Schaller et al. 2005; Ouimet et al. 2008]. 36Cl concentrations were determined by accelerator mass spectrometry (AMS) measurements performed at ASTER, the French national AMS facility (CEREGE, Aix-en-Provence) [Arnold et al. 2010]. A sea-level and high-latitude 36Cl production rate for calcium spallation of 42.2 ± 3.4 atoms 36Cl g−1 a−1 [Schimmelpfennig et al. 2009; Braucher et al. 2011] was used and scaled following Stone [2000] and corrected for topographic shielding (TS), constrained from field measurement data and using the online tool CRONUS-Earth from Balco et al. [2008]. For more details on the dating method and the analytical protocol, the reader is referred to several previous studies [Zerathe et al. 2014; Cardinal et al. 2021, 2022]. All exposure ages are indicated according to before present (BP) nomenclature.
3.3. Incision rate computation
The numerical code developed by Glotzbach et al. [2011], originally designed for thermochronology age-elevation relationships, was used to determine temporal variations in incision rates from the CRE data. The code defines the regression segments that best fit the CRE ages data and the associated uncertainties with elevation distribution. As in Glotzbach et al. [2011], a Monte Carlo approach was used to randomly divide the data into 1, 2 or 3 successive time intervals in order to define regression segments by weighted linear regression, and to select the best-fitting ones according to their R2 value. The following criteria were applied: no negative incision rate was allowed; regression segments constrained by less than 3 data points were rejected; the intersection between two curve segments must correspond to the intersection between the two sets of data that were used to calculate them.
4. Results and local interpretations
The sample characteristics are reported in Table 1. CRE ages determined from the 36Cl concentrations are reported in the CRE age vs. height plots (Figure 8). The term “riverbed” used here refers to the bedrock, which corresponds to the bottom of the river channels. It was measured in few locations. The actual geometry of the river thalweg is therefore poorly constrained.
CRE age vs. height (left y-axis) plot and associated incision rates (right y-axis) of (A) Samson, (B) La Mescla with Section 1 (continuous line) and Section 2 (dashed line), and (C) Galetas. Black lines corresponds to linear regressions, blue lines corresponds to the incision rates inferred from those regressions and corresponding uncertainties (light grey rectangles). (D) Inferred incision rates variations over time for the studied sites, and corresponding uncertainties.
36Cl CRE sample characteristics and geochronological results
| Sample | Height above river bed (m) | Samp. thick. (cm) | TS factor | Spallation scaling | 35Cl (ppm) | Ca (%) | Atoms 36Cl (at/g) | Atoms 36Cl ± (at/g) | CRE age (ka) |
|---|---|---|---|---|---|---|---|---|---|
| Samson (lat: 43.7842°; long: 6.3936°; mean elevation: 606 masl) | |||||||||
| S01 | 2 | 1 | 0.16 | 1.67 | 37.3 | 40.7 | 83,944 | 6349 | 15.9 ± 1.2 |
| S02 | 2.4 | 1 | 0.16 | 1.67 | 29.9 | 40.7 | 89,670 | 8452 | 17.2 ± 1.6 |
| S03 | 3.3 | 1 | 0.16 | 1.67 | 32.5 | 40.8 | 91,776 | 5730 | 17.5 ± 1.1 |
| S04 | 3.7 | 1 | 0.16 | 1.67 | 35.0 | 40.7 | 118,596 | 7068 | 22.7 ± 1.4 |
| S05 | 4.6 | 1 | 0.16 | 1.67 | 31.5 | 40.6 | 136,006 | 8988 | 26.4 ± 1.7 |
| S06 | 5.8 | 2.5 | 0.16 | 1.67 | 32.0 | 41.7 | 188,287 | 9862 | 36.0 ± 1.9 |
| S07 | 6.8 | 1 | 0.16 | 1.67 | 28.1 | 40.8 | 187,869 | 9775 | 36.9 ± 1.9 |
| S08 | 7.1 | 1 | 0.16 | 1.67 | 28.6 | 40.8 | 205,363 | 13,024 | 40.4 ± 2.6 |
| S09 | 7.7 | 1.5 | 0.16 | 1.67 | 23.4 | 40.7 | 205,909 | 11,192 | 40.9 ± 2.2 |
| S10* | 8 | 1.5 | 0.16 | 1.67 | 33.1 | 40.6 | 190,457 | 16,417 | 37.3 ± 3.2 |
| S11* | 11 | 1 | 0.16 | 1.67 | 24.5 | 40.4 | 110,890 | 8575 | 21.6 ± 1.7 |
| La Mescla (lat: 43.7399°; long: 6.3794°; mean elevation: 564 masl) | |||||||||
| M01 | 1.1 | 1 | 0.39 | 1.61 | 43.1 | 40.5 | 388,057 | 38,470 | 32.5 ± 3.2 |
| M02 | 2.0 | 1 | 0.39 | 1.61 | 47.3 | 40.5 | 568,763 | 36,811 | 48.2 ± 3.1 |
| M03 | 2.8 | 1 | 0.39 | 1.61 | 33.5 | 40.6 | 677,155 | 29,949 | 59.0 ± 2.6 |
| M04 | 3.9 | 1 | 0.39 | 1.61 | 36.5 | 40.5 | 386,654 | 34,273 | 32.6 ± 2.9 |
| M05* | 4.7 | 3 | 0.39 | 1.61 | 37.8 | 41.1 | 184,681 | 13,407 | 15.0 ± 1.1 |
| M06* | 5.6 | 2.5 | 0.39 | 1.61 | 43.7 | 41.1 | 198,667 | 26,792 | 16.1 ± 2.2 |
| M07 | 6.3 | 2 | 0.39 | 1.61 | 43.0 | 40.7 | 669,682 | 32,058 | 57.4 ± 2.7 |
| M08 | 6.2 | 1.5 | 0.39 | 1.61 | 49.3 | 40.6 | 651,036 | 29,465 | 55.4 ± 2.5 |
| Galetas (lat: 43.7972°; long: 6.2576°; mean elevation: 475 masl) | |||||||||
| G01 | 10 | 1 | 0.20 | 1.49 | 16.2 | 40.5 | 288,596 | 13,927 | 53.2 ± 2.6 |
| G02 | 8.0 | 1 | 0.54 | 1.50 | 26.9 | 40.5 | 423,770 | 18,845 | 28.0 ± 1.2 |
| G03* | 10 | 1 | 0.54 | 1.50 | 19.5 | 40.6 | 308,352 | 15,745 | 20.3 ± 1.0 |
| G04 | 8.9 | 1 | 0.67 | 1.49 | 48.6 | 40.5 | 356,756 | 18,990 | 18.3 ± 1.0 |
| G05 | 9.0 | 2.5 | 0.67 | 1.49 | 49.4 | 41.1 | 596,356 | 29,548 | 31.6 ± 1.6 |
Sample field information, topographic shielding (TS) factor of the sampled surfaces, samples thickness (Samp. thick.), natural chlorine contents, calcium, cosmogenic 36Cl contents in the limestone samples, resulting 36Cl CRE ages are indicated. Samples with an asterisk correspond to CRE ages identified as outliers and discarded for incision rate computation.
4.1. Samson Corridor
A total of 11 samples were collected along a 12 m-high polished surface in the Samson Corridor, which gave CRE ages ranging from 15 to 45 ka. These data were already presented by Cardinal et al. [2022], where the authors made a conservative choice to consider only one regression line for deriving incision rates. As in the present study, to constrain more precisely the timing of incision in the HVG, the code was allowed to use three regression lines in order to obtain incision rate variations. Apart from two samples (S10 and S11) that clearly demonstrate the occurrence of rock-falls [as seen in Cardinal et al. 2021], the rest of the data shows a consistent history of progressive incision with three incision rate trends:
- 0.25 ± 0.17 mm/yr from 45 to 30 ka;
- 0.18 ± 0.03 mm/yr from 30 to 16 ka;
- 0.90 ± 0.53 mm/yr from 16 to 15 ka.
Considering the large uncertainties associated with the calculated incision rates, and relatively similar estimates, it can be concluded that the first two periods are difficult to distinguish from each other and that incision in the Samson Corridor underwent only one major incision rate change after ca. 16 ka. The lack of CRE data does not allow us to constrain an incision rate for the remaining 2 m of the surface, corresponding to the last 15 ka (Figure 8A).
4.2. La Mescla
Eight samples were collected along the two sections described above, and gave CRE ages ranging from 60 to 15 ka for Section 1 and 60 to 30 ka for Section 2. Both sections are located along the concave banks of the meander. The data collected from La Mescla indicate a much more contrasted incision history, which seems in agreement with the complex morphology of the site. Indeed, as described above, the sampled site can be seen as two distinct sections; an upstream part with an overhanging high wall, and a downstream part with a nearly flat surface. The top of each section corresponds to the top of a limestone bed: St04 for the highest portion and St01 for the lowest portion (Figure 6A). Three observations can be made:
- Samples collected at the top of each of the two sections (03: Section 1; 07 and 08, Section 2) show similar exposure ages (55–60 ka), despite different heights above river bed (2.8 m for sample 03 and 6.2–6.3 m for samples 08 and 07);
- Samples 01 and 04, collected 2 m below the highest samples of their respective portion but at different heights above river bed (1.1 m for sample 01, 3.3 m for sample 04), have a similar exposure age (32 ka);
- Intermediate samples 05 and 06 (height above river bed: 4.7 m for sample 05 and 5.6 m for sample 06) both have a very similar age of 15–16 ka, much younger than the rest of the data, despite being located in an intermediate position relative to the river bed.
To understand these contrasted CRE ages, the evolution of this specific portion of the HVG must be reconstructed. The samples 08, 07 and 03, although located at different heights above the present river bed, have similar exposure ages and could therefore represent a paleo-riverbed with a steeper slope than the present one (Figure 9A). The CRE age of samples 01 and 04 could then represent a second paleo-riverbed at ca. 30 ka, 2 m below the first one, but with a similar slope (Figure 9B). The CRE ages would therefore indicate that between 60 and 30 ka, incision occurred at a rate of 0.06–0.1 mm/yr.
Sketch (not to scale) of the proposed evolution and incision history of the La Mescla sampled site at (A) 55–60 ka, (B) 32 ka and (C) 15–16 ka. Paleo-rb: proposed slope of paleo-riverbed; Present-rb: estimated present riverbed slope; St: limestone strata. The term “riverbed” used here refers to the bedrock, which corresponds to the channel bottom.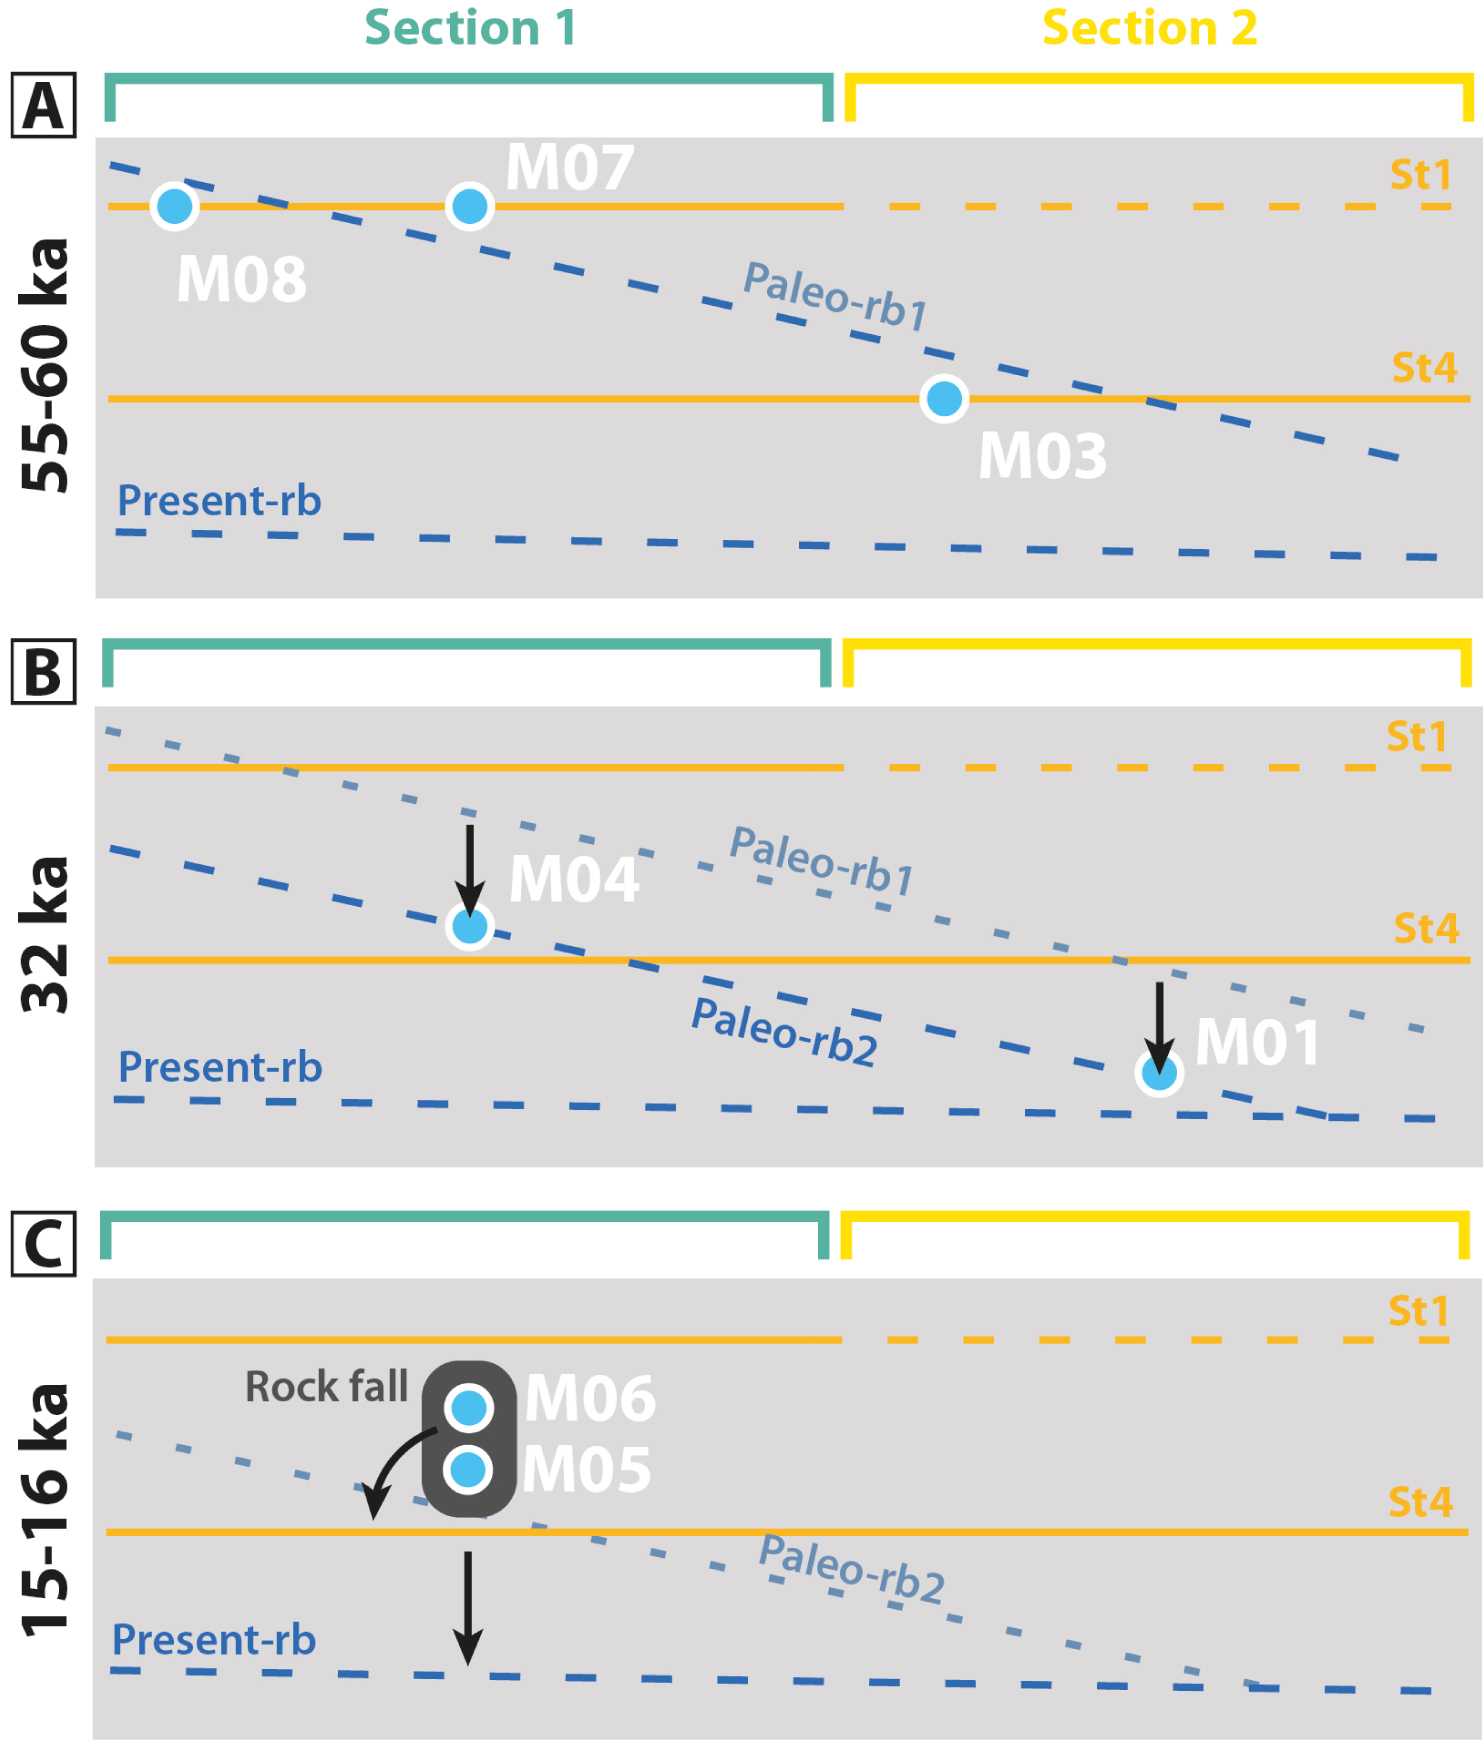
However, Section 1 of La Mescla site seems to have undergone a more focused and intense incision, since the above mentioned tilted paleo-riverbed seems to have been flattened to match the modern riverbed. Indeed, Section 1 is directly facing the upper part of the meander, while Section 2 is located more deeply in the inside of the meander curve (Figure 6D). Hence, the upstream portion is more exposed to the direct impact of the river flow, while the downstream portion may be shielded from the shear strength and turbulence of the flow, as most of it is absorbed in the upstream section of the meander. Such a focused lateral erosion could have destabilized the bedrock wall by undercutting its foot, creating an overhanging cliff. Indeed, Samples 05 and 06 show similar young exposure ages of ∼16 ka, which can be interpreted as rock falls. Indeed, although probably smoothed by dissolution, the shallow cavity scarred by a vertical fracture, in which samples 05 and 06 are located, could be indicative of a rock fall (Figure 6C) and therefore could explain the much younger CRE age of those samples compared to the surrounding ones. The CRE data agree with an acceleration of incision at the same time for the Samson area (Figure 8A), suggesting a period of enhanced incision occurring around 16 ka (age of the possible rock falls). Such an incision wave could have flattened, very locally and by a combination of vertical incision and lateral erosion, the riverbed by erasing what could have been a small lithological knickpoint at La Mescla that did not propagate upstream, as observed in other studies [Johnson et al. 2010, and references therein].
4.3. Galetas
A total of 5 samples was collected along three river polished surfaces at the outlet of the HVG. The CRE ages range between 55 and 15 ka. The compilation of these data suggest a low and yet poorly constrained incision rate of 0.07 ± 0.04 mm/yr between the 15–55 ka period.
5. Discussion
5.1. Short-term incision
The code was allowed to calculate incision rates with relatively few points, permitting to highlight rapid variations in incision rates. The disadvantage of this approach is that these incision rates are not always well constrained from the CRE data. This strategy allows us to infer an acceleration of incision from 0.2 to 0.9 mm/yr between 17 and 15 ka in the Samson Corridor (Figure 8C), but with too few points to really constrain it. At the same period, a sequence of rock falls in the La Mescla site can be inferred, suggesting a period of increased downcutting at that time. Following the regional interpretation proposed by Cardinal et al. [2022], several rivers connected to the Last Glacial Maximum (LGM) glaciation in the SW French Alps underwent a period of enhanced fluvial incision following the main glacier retreats [19–17 and 14 ka; Rolland et al. 2019]. From these results, it seems that the Verdon River may have undergone the same evolution, but since only three ages younger than 20 ka are obtained in the entire dataset, it remains difficult to infer any detailed post-glacial history of the HVG with confidence.
5.2. Long-term incision
Our results yield two ranges of slow but steady incision rates for the HVG: 0.06–0.07 mm/yr in the downstream parts of the HVG (Galetas and La Mesla Section 2), a roughly similar value of 0.1 mm/yr in the area of focused incision (La Mescla Section 1) between 60 and 15 ka (Figure 8C), and a larger value around 0.2 mm/yr on average in the upstream part (Samson Corridor) of the HVG.
Based on these estimates and on data obtained on the HVG by CRE dating, the following questions can be subsequently explored: (1) What is the onset time of HVG formation? (2) What is the main driver for the long-term incision? (3) What is the respective contribution of glacial/interglacial phases in lowering or enhancing these long-term incision rates?
5.2.1. What is the onset time of HVG formation?
From the CRE data, the long-term Verdon River incision rates can be bracketed between 0.06 and 0.2 mm/yr on scales up to several 10’s of ka (neglecting the brief, less constrained, 0.9 mm/yr incision rate ∼at 15 ka obtained in the Samson Corridor). These incision rates are lower than those inferred by Brocard et al. [2003] in the neighboring Buech river (0.8 mm/yr over the last 190 ka). If these results are extrapolated from the bottom of the gorge to the first level of terraces, up to 300 m above the present riverbed near La Mescla (Figure 10), computed first-order ages estimates range between 1.5 and 5 Ma, which would thus represent the onset of the main incision period that dug the HVG up to 300 m.
Topographic profiles drawn from the IGN DEM with corresponding surface abandonment ages. (A) across the Valensole Plateau near Moustier Sainte Marie; after Dubar et al. [1998], (B) along the lower Verdon channel; after Dubar et al. [1998] and (C) in the HVG near the La Mescla site (this study). See location profiles on Figure 1B. Note that the vertical and horizontal scales are different between each panel.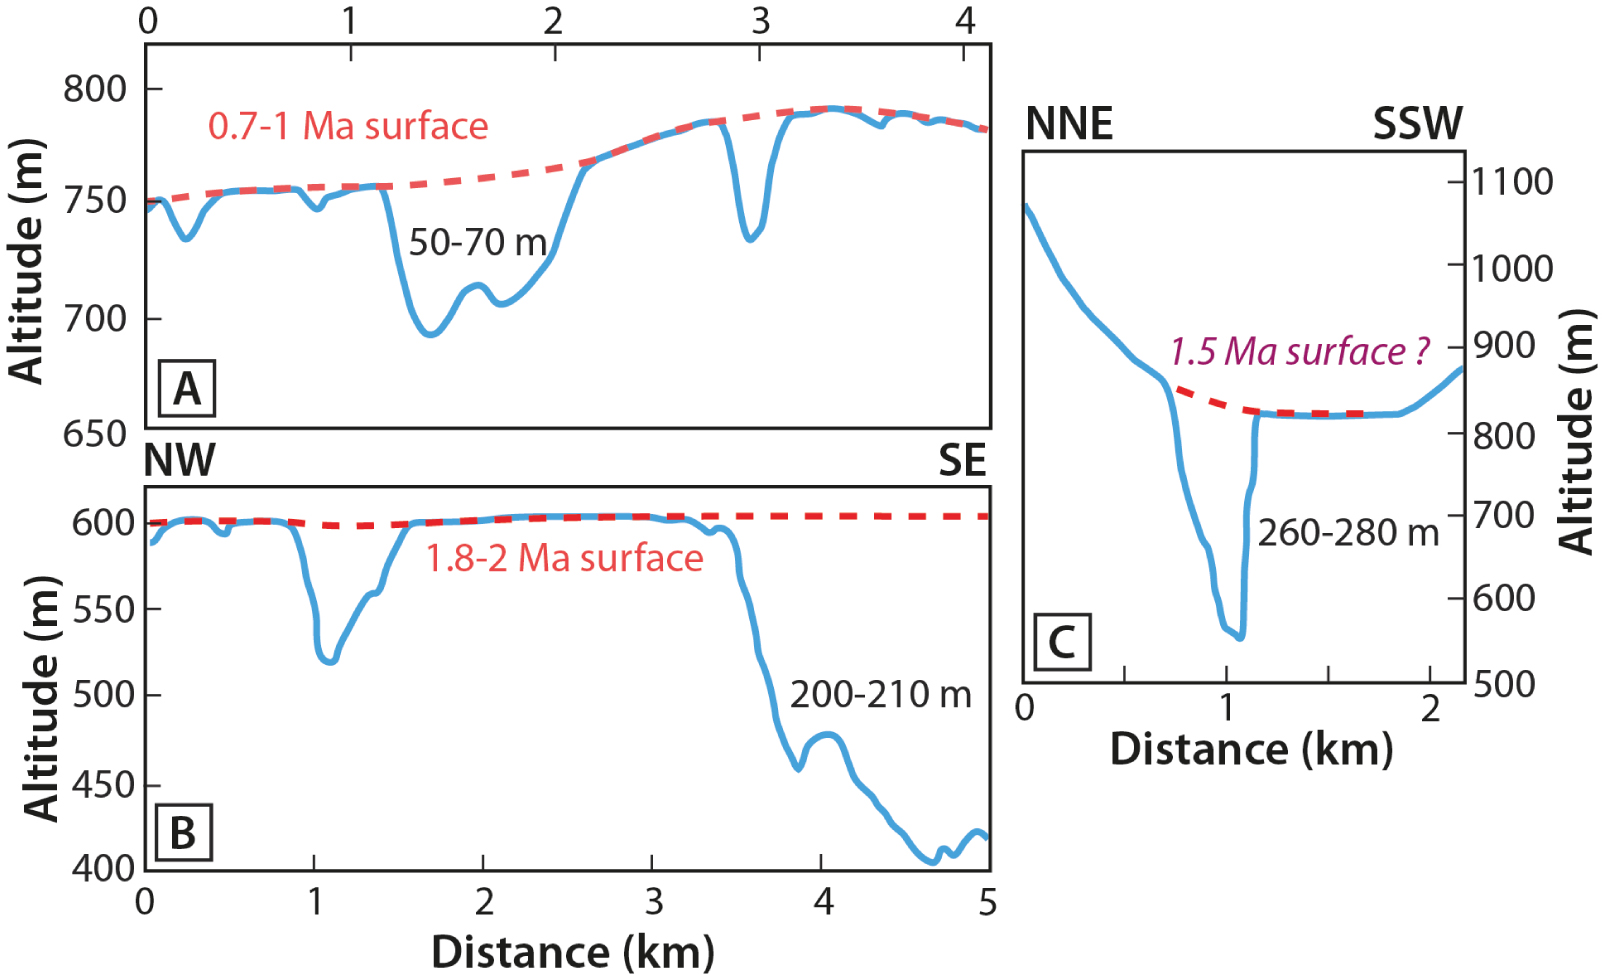
The last deposits of the Valensole basin are dated around 1.8 to 2 Ma [Dubar 1984; Dubar et al. 1998; Hippolyte et al. 2011], except for local clastic deposits of the Balene breccia formation, which are dated around 0.7 to 1 Ma [Dubar et al. 1978, 1998]. This continental formation is presently incised by tributaries of the Verdon River. The upstream position of this formation suggests that downcutting of the lower Verdon River may have started before 1 Ma [Dubar et al. 1998]. In that case, the maximum height of the HVG (∼300 m) would correspond to a long-term incision rate of 0.3 mm/yr, which is higher but of the same order of magnitude than short-term rates deduced from CRE data.
The end of sediment deposition in the Valensole basin is ascribed to Early Quaternary climate cooling, and was supposed to correspond to the onset of river network entrenchment in the Valensole plateau and its surroundings [Dubar 1984]. While global cooling started in the late Pliocene for the Northern hemisphere [Suc and Zagwijn 1983; Haug et al. 2005], evidence for increased incision and valley downcutting in the Alps seem to have occurred later, around 0.9–1 Ma [Muttoni et al. 2003; Valla et al. 2011], hence around the mid-Pleistocene transition between the glacial/interglacial cycles periodicity of 40-ka to 100-ka [Lisiecki 2010]. Therefore, the onset of the Valensole basin deposits incision can be bracketed between 1 and 2 Ma, which is consistent with the younger age estimate (ca. 1.5 Ma) of gorge entrenchment and the higher bound of incision rates (∼0.2 mm/yr) estimated from our CRE datings and extrapolation along the HVG.
5.2.2. What is the main driver for the long-term incision?
The present total incision of the Balene breccia formation, located in the Valensole Basin, is of 50 to 70 m, leading to a mean incision rate of 0.07 to 0.1 mm/yr over the last 0.7–1 Ma. Between the Valensole abandonment surface dated at 1.8 to 2 Ma and the Verdon thalweg around the Sainte Croix Lake, it can estimated that the Verdon River has incised about 220 m, which gives a mean incision rate of 0.1 mm/yr since that time. This estimate is consistent with the above mentioned estimation obtained from the Balene breccia formation (Table 2). From morphological analysis and CRE dating of the Durance terraces, Siame et al. [2004] inferred a similar incision rate for the Durance River on its eastern side, with rates of 0.1 mm/yr since 2 Ma. The value of 0.1 mm/yr can therefore be assumed to constitute a good estimate for the long-term (i.e., since 1.8 to 2 Ma) average incision rate of rivers in the Valensole plateau. Such an incision rate is possibly driven by large-scale isostatic and/or tectonic uplift [Champagnac et al. 2008], although local tectonic structures might have also played a role [Hippolyte and Dumont 2000; Siame et al. 2004].
Synthesis of incision and uplift measurements estimates in the study area
| Time interval (ka) | Uncertainty (ka) | Height (m) | Uncertainty (m) | Observation | Site name | Site number | Reference |
|---|---|---|---|---|---|---|---|
| 20 | 1 | 1.4 | 0.5 | Incision | Galetas | 1 | This study |
| 30 | 5 | 2 | 0.5 | Incision | Mescla | 2 | This study |
| 50 | 5 | 10 | 0.5 | Incision | Samson | 3 | This study |
| 850 | 150 | 60 | 10 | Incision | Balene breccia | 4 | [Dubar 1984] and this study |
| 1900 | 100 | 200 | 10 | Incision | Valensole surface | 5 | [Dubar et al. 1998] and this study |
| 2000 | 100 | 200 | 50 | Uplift | East Durance | 6 | [Siame et al. 2004] |
| 1450 | 100 | 290 | 10 | Incision | Samson | 3ext | This study (extrapolated) |
| 3000 | 400 | 345 | 5 | Uplift | Digne nappe | 7 | [Hippolyte et al. 2011] |
| 3000 | 400 | 645 | 5 | Uplift | Digne nappe | 7corr | [Hippolyte et al. 2011] (corrected) |
| 6000 | 500 | 3500 | 500 | Denudation | Velodrome | 8 | [Schwartz et al. 2017] |
Site numbers and location refer to Figure 11.
This mean incision rate of 0.1 mm/yr is roughly consistent with the higher range of incision rates inferred for the medium part of the HVG: “La Mescla” site and, considering its large uncertainties, and the Galetas site in the lower part of the HVG. It is also consistent with contemporary average denudation rates ranging between 0.04 and 0.12 mm/yr computed from topographic analysis and 10Be CRE data on the Valensole Plateau hillslopes [Godard et al. 2020]. Incision rates in the Samson Corridor (0.2 mm/yr) is twice as high, as in neighbouring catchments for the recent period covering the last ca. 40 ka [ranging from 0.15 and 0.28 mm/yr; Cardinal et al. 2022]. This can be ascribed either to differential tectonic motions (with respect to the lower Verdon Gorges and Valensole plateau) or to delayed incision of a steep, disequilibrium river profile that might have accumulated between several glacial cycles [Rolland et al. 2017]. The tectonic hypothesis argues for the role of Pliocene to Quaternary faults, accommodating Plio-Quaternary shortening along the Digne–Castellane arcs [e.g., Sanchez et al. 2010; Bauve et al. 2014]. These structures could locally consist of EW trending blind thrusts and folds responsible for the measured incision rates in the Samson Corridor. For instance, in the Samson Corridor, the Verdon River cuts across a topographic dome corresponding to an anticline axis cored by lower Jurassic limestones (the Collet-Barris anticline), instead of flowing in the neighbouring, lower-altitude syncline to the west (Figures 1C and 3B). This can be interpreted as an antecedence assisted by the network of N–S and E–W faults [Nicod 2004] and suggests a possible, very slow differential uplift between the Mesozoic sedimentary cover units of the Castellane arc and the Valensole basin of 0.1 mm/yr since the incision onset of the HVG. This value is consistent with previously obtained estimates of differential uplift rates on Quaternary canyons in the Digne Nappe, although the age of the canyons are only indirectly constrained [Hippolyte et al. 2011]. The contractional deformation is still ongoing, as shown by the seismicity observed south of the Castellane area [see Le Pichon et al. 2010; Larroque et al. 2021 for a synthesis].
To the Northwest of the HVG, thermochronology data from Miocene sediments underthrusted below the Digne Nappe yielded long-term exhumation rates of about 0.5 to 0.6 mm/yr since ca. 6 Ma [Figure 11C; Schwartz et al. 2017]. These higher values are possibly due to the activity of a crustal-scale, “thick-skin”, thrust located below the Barles half-window [Nouibat et al. 2022; Schwartz et al. 2017]. Here, NNW–SSE to NW–SE trending thrust wedges (Esclangon and Tanaron horse structures) have accommodated N70°E-trending compressional deformation and are responsible for the Plio-Quaternary uplift of Barles area [Hippolyte et al. 2011]. In addition, based on balanced and restored cross-sections through southwestern Subalpine and Central Provencal zones, Balansa et al. [2022] suggested that the relative northeastward migration of buried basement highs contributed to the observed Pliocene-Quaternary contractional deformation and uplift of the central and northern extremity of the Valensole area. It is likely that this contractional deformation continued to migrate to the NNE until reaching the Barles half-window. The above mentioned local exhumation rates are consistent with the preservation of late Pliocene to early Quaternary canyons in the Digne Nappe, as denudation can have been more focused and more intense in the Barles half-window than in the surrounding area, where the nappe is preserved and well visible today. Moreover, the late stage denudation history since 1–2 Ma is too recent and too shallow to be precisely recorded by apatite fission-track (AFT) and (U–Th)/He (AHe) thermochronology data.
Compilation of incision and uplift rates at different time scales. (A) Incision rates in the HVG from CRE dating (this study) over 20 to 50 ka. (B) Same data as on A with additional incision or uplift rate estimates from the literature (sites 4, 5, 6 and 7). Point 3ext corresponds to the extrapolation of the recent 0.2 mm/yr incision rate (site 3) to the actual gorge height measured in the Verdon canyon. Points 7corr corresponds to the uplift of the Digne Nappe in the Esquichiere canyon relative to the Valensole basin [Hippolyte et al. 2011, point 7], to which is added an uplift of 0.1 mm/yr of the Valensole basin relative to the base level, in order to allow comparison with the other points. (C) Same as B (B corresponds to the grey-dashed rectangle on the bottom left) with long-term AFT/AHe exhumation rate estimates from Schwartz et al. [2017] interpreted as uplift estimates. The Messinian Salinity Crisis (MSC) period is indicated (transparent blue rectangle). See Table 1 for details.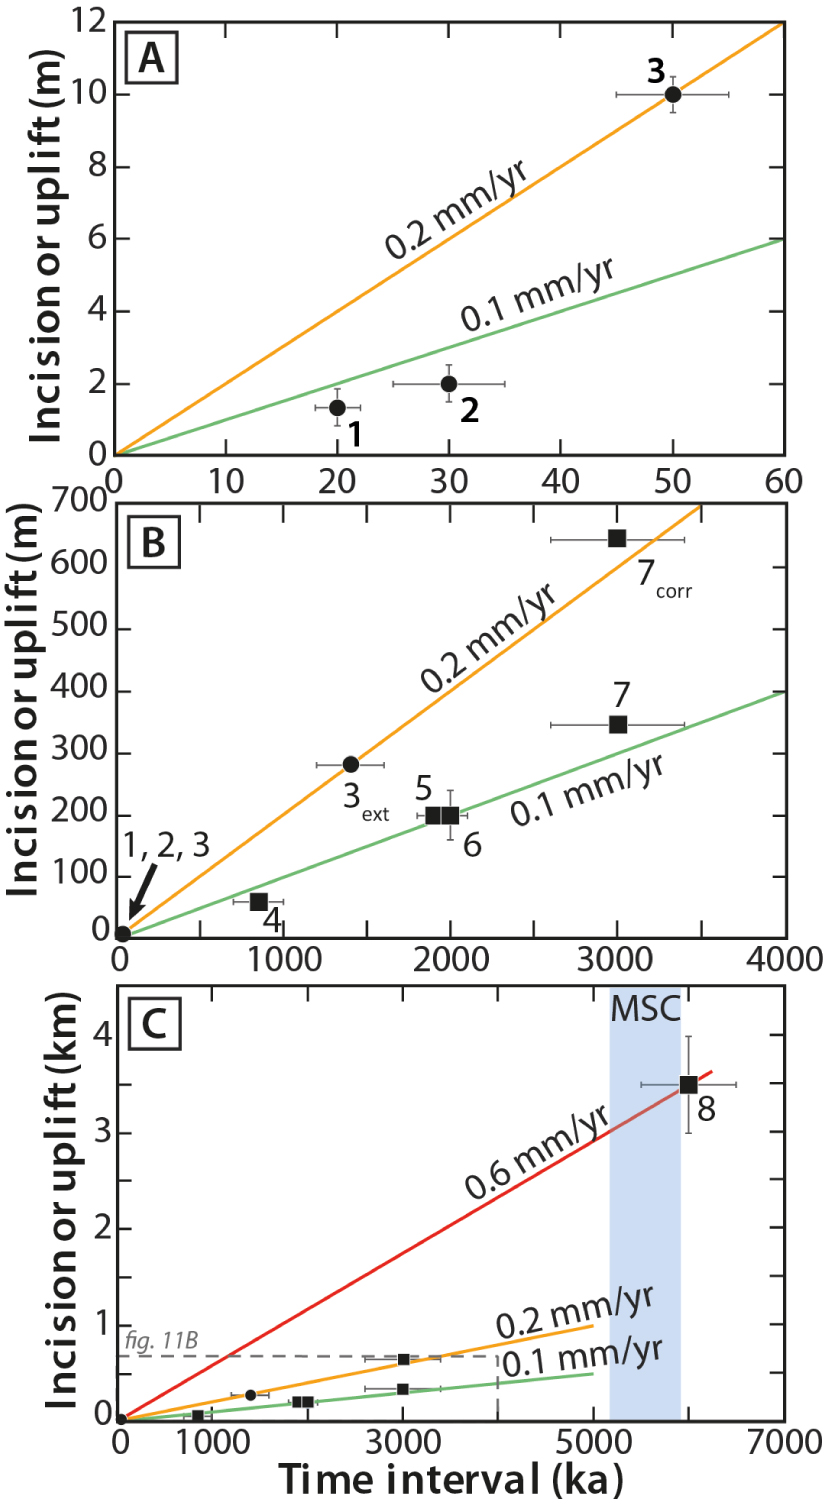
Considering all these values together, and assuming that recent (<60 ka) incision rates in the HVG can be extrapolated to the overall Quaternary period, it can be proposed that: (i) there is a very slow (0.1 mm/yr) uplift of the whole region since the last 1.5 to 2 Ma, encompassing the Valensole basin and the Digne Nappe–Castellane Arc units, which is possibly the result of late Alpine tectonics or isostatic uplift [e.g. Champagnac et al. 2008]; (ii) there might be an additional, although very slow, thin-skin deformation (0.1 mm/yr of uplift) of the sedimentary cover of the Castellane Arc relative to the Valensole basin; (iii) the situation is different in the Barles half-window, where higher rock exhumation rates occurred in the Late Miocene (ca. 6 Ma) in response to the activity of a crustal-scale thrust [recognized on crustal-scale geophysical images; Nouibat et al. 2022] and/or northeastward migration of a basement high [Schwartz et al. 2017; Balansa et al. 2022; Nouibat et al. 2022]. Whether this activity was constant during the last 6 Ma, or was initially very fast and progressively slowed down to reach the observed uplift/incision rates for the last 1.5–2 Ma further south is difficult to quantitatively assess. Vertical GPS motions in the study area are poorly constrained, with present-day uplift rates of 0.41 ± 0.58 mm/yr at the nearest station at Moustier-Saint-Marie [Sternai et al. 2019], so it is impossible to compare our long-term uplift estimates values with modern and almost instantaneous uplift rates from geodesy [e.g., Piña-Valdés et al. 2022].
5.3. What is the respective contribution of glacial/interglacial phases in lowering or enhancing incision?
In this framework, and comparing our results with long-term incision rates estimated in the Valensole Plateau and in the Verdon Gorges, the higher (up to 0.9 mm/yr at 15–16 ka, Figure 8A) incision rates obtained in the Samson Corridor can be tentatively ascribed to its upstream position in the HVG. The Samson Corridor is located at the boundary between two erosion regimes during the late-Quaternary period. Incision is mainly controlled by the influence of glaciation in the high Verdon Valley, while the lower Verdon Valley is only under a fluvial incision regime. Therefore, the higher incision rates estimated over a short period (∼0.9 mm/yr from 16 to 14 ka) could be the result of a paraglacial crisis in the Verdon River posterior to the LGM. The same timing of enhanced incision is observed in neighbouring catchments following post-LGM deglaciation [Cardinal et al. 2022]. Furthermore, increased incision after 16 ka could have triggered rock falls in the La Mescla site of the HVG (Section 4.2). However, it is also possible that rockfall might solely be related to freezing and thawing effects, as observed by Cardinal et al. [2021] in a similar periglacial gorge setting. Therefore, the enhanced incision in the higher part of HVG could result from an increased interaction with the High Verdon Valley, where glacial incision has been efficient. The effect of enhanced incision following glaciers melting could have been hindered and buffered in the rest of the gorges, due to the resistance of the Tithonian limestones to such influences.
6. Conclusions
We sampled three 10 m-high river-polished walls within the High Verdon Gorge, in order to apply the Cosmic Ray Exposure dating approach and derive incision rates. These data are used to discuss the gorge origin and both short-term and long-term dynamics. Each site shows local complexities related to the intricate course of the Verdon River and, except for the upstream boundary of the HVG (Samson corridor), no significant variations in incision rates with time are evidenced. It remains therefore difficult to relate the HVG downcutting to the post-LGM paraglacial incision crisis, as it is more likely the case in other rivers also connected to the LGM glacial extent in the region [e.g. Cardinal et al. 2022]. The relatively steady incision rates (0.06–0.2 mm/yr) obtained from our CRE data cover a time window between 60 and 15 ka and are comparable to long-term regional uplift, exhumation and denudation rate estimates. This leads us to propose that tectonic and/or isostatic uplift are the main drivers for the Late Quaternary incision of the Verdon River. Finally, this long-term incision, when extrapolated to the rest of the vertical 300 m-high gorge walls and to other estimated incision heights from the Valensole basin, is consistent with a Mid- to Early Quaternary (∼1.5 to 2 Ma) onset of incision for the HVG. This age estimate could reasonably fit with the beginning of Alpine glaciations; although the general pattern of the river network was probably already present in Late Miocene times, intense downcutting responsible for the initial entrenchment of the Verdon River can be ascribed to the Quaternary climate cooling.
Conflicts of interest
Authors have no conflict of interest to declare.
Acknowledgments
This study has been funded by the French Geological Survey (Bureau de Recherches Géologiques et Minières; BRGM) through the national program “Référentiel Géologique de France” (RGF-Alpes). This work has also been supported by the French Government, through the UCA-JEDI Investments in the Future project managed by the National Research Agency (ANR) with the reference number ANR-15-IDEX-01. The 36Cl measurements were performed at the ASTER AMS national facility (CEREGE, Aix en Provence) which is supported by the INSU/CNRS, the ANR through the “Projets thématiques d’excellence” program for the “Equipements d’excellence” ASTER-CEREGE action and IRD. This manuscript benefitted from constructive reviews by two anonymous reviewers and efficient editorial handling by O. Fabbri.