


 CC-BY 4.0
1. Introduction: climate-related risks
France, in mainland and oversea territories, is particularly exposed to the consequences of climate change, through changes in regional climate, the mountain cryosphere, the ocean as well as sea-level rise (Antoni and Joassard, 2024), themselves directly related to human-caused global climate change.
During the last decade, France mainland and oversea territories have experienced the intensification of multiple climatic impact-drivers due to human-caused climate change, providing evidence for limits to current adaptation levels, and key vulnerabilities to land and marine hot extremes, drought (with a large number of buildings exposed to clay swelling), water scarcity, wildfires, extreme rainfall and flooding, and intense tropical cyclones, leading to increasing insurance costs (Haut Conseil pour le Climat, 2024b; Haut Conseil pour le Climat, 2025) and losses, in particular for food production (Haut Conseil pour le Climat, 2024a).
In mainland France, managed forests have also been strongly affected by reduced growth and increased tree mortality resulting from heat and drought, leading to a 50% reduction of the managed forest carbon sink since around 2010 (Académie des Sciences, 2023), challenging the ability of France to meet its pledged mitigation goals and constraining the sustainable use of biomass in mitigation strategies (Haut Conseil pour le Climat, 2024b).
Worldwide, around 3.3 to 3.6 billion people live in contexts highly vulnerable to climate change, and, by 2050, around 1 billion people will be exposed to hazards resulting from sea-level rise, in low-lying islands and coasts, coastal cities, and agricultural deltas (IPCC, 2023). Vulnerable communities, who have least contributed to current global warming (M. W. Jones et al., 2023), are disproportionately affected by the escalation of losses and damages, which affect water and food security, well-being and health, critical infrastructures, livelihoods and economic activity (IPCC, 2023). Today’s young generations will face unprecedented lifetime exposure to climate extremes (Grant et al., 2025), with adverse effects of climate change hindering the full enjoyment of human rights (International Court of Justice, 2025).
Characterizing future climate impacts and risks is a critical element to inform climate action, both in terms of mitigation efforts to avoid unmanageable and intolerable risks, and in terms of adaptation pathways, adaptation limits, residual risk and risk management. Risk is defined in the IPCC AR6 as “the potential for adverse consequences for human or ecological systems, recognizing the diversity of values and objectives associated with such systems. Risks can arise from potential impacts of climate change as well as human responses to climate-related risks” (Figure 1).
Schematic of the IPCC AR6 framework for assessing future greenhouse gas emissions, climate change, risks, impacts and mitigation. (a) The integrated framework encompasses socio-economic development and policy, emissions pathways and global surface temperature responses to the five scenarios considered by WGI (SSP1-1.9, SSP1-2.6, SSP2-4.5, SSP3-7.0, and SSP5-8.5) and eight global mean temperature change categorisations (C1–C8) assessed by WGIII, and the WGII risk assessment. The dashed arrow indicates that the influence from impacts/risks to socio-economic changes is not yet considered in the scenarios assessed in the AR6. Emissions include greenhouse gases (GHGs), aerosols, and ozone precursors. CO2 emissions are shown as an example on the left. The assessed global surface temperature changes across the 21st century relative to 1850–1900 for the five GHG emissions scenarios are shown as an example in the centre. Very likely ranges are shown for SSP1-2.6 and SSP3-7.0. Projected temperature outcomes in 2100 relative to 1850–1900 are shown for C1 to C8 categories with median (line) and the combined very likely range across scenarios (bar). On the right, future risks due to increasing warming are represented by an example ‘burning ember’ figure. (b) Description and relationship of scenarios considered across AR6 Working Group reports. (c) Illustration of risk arising from the interaction of hazard (driven by changes in climatic impact-drivers) with vulnerability, exposure and response to climate change. Replicated from (IPCC, 2023).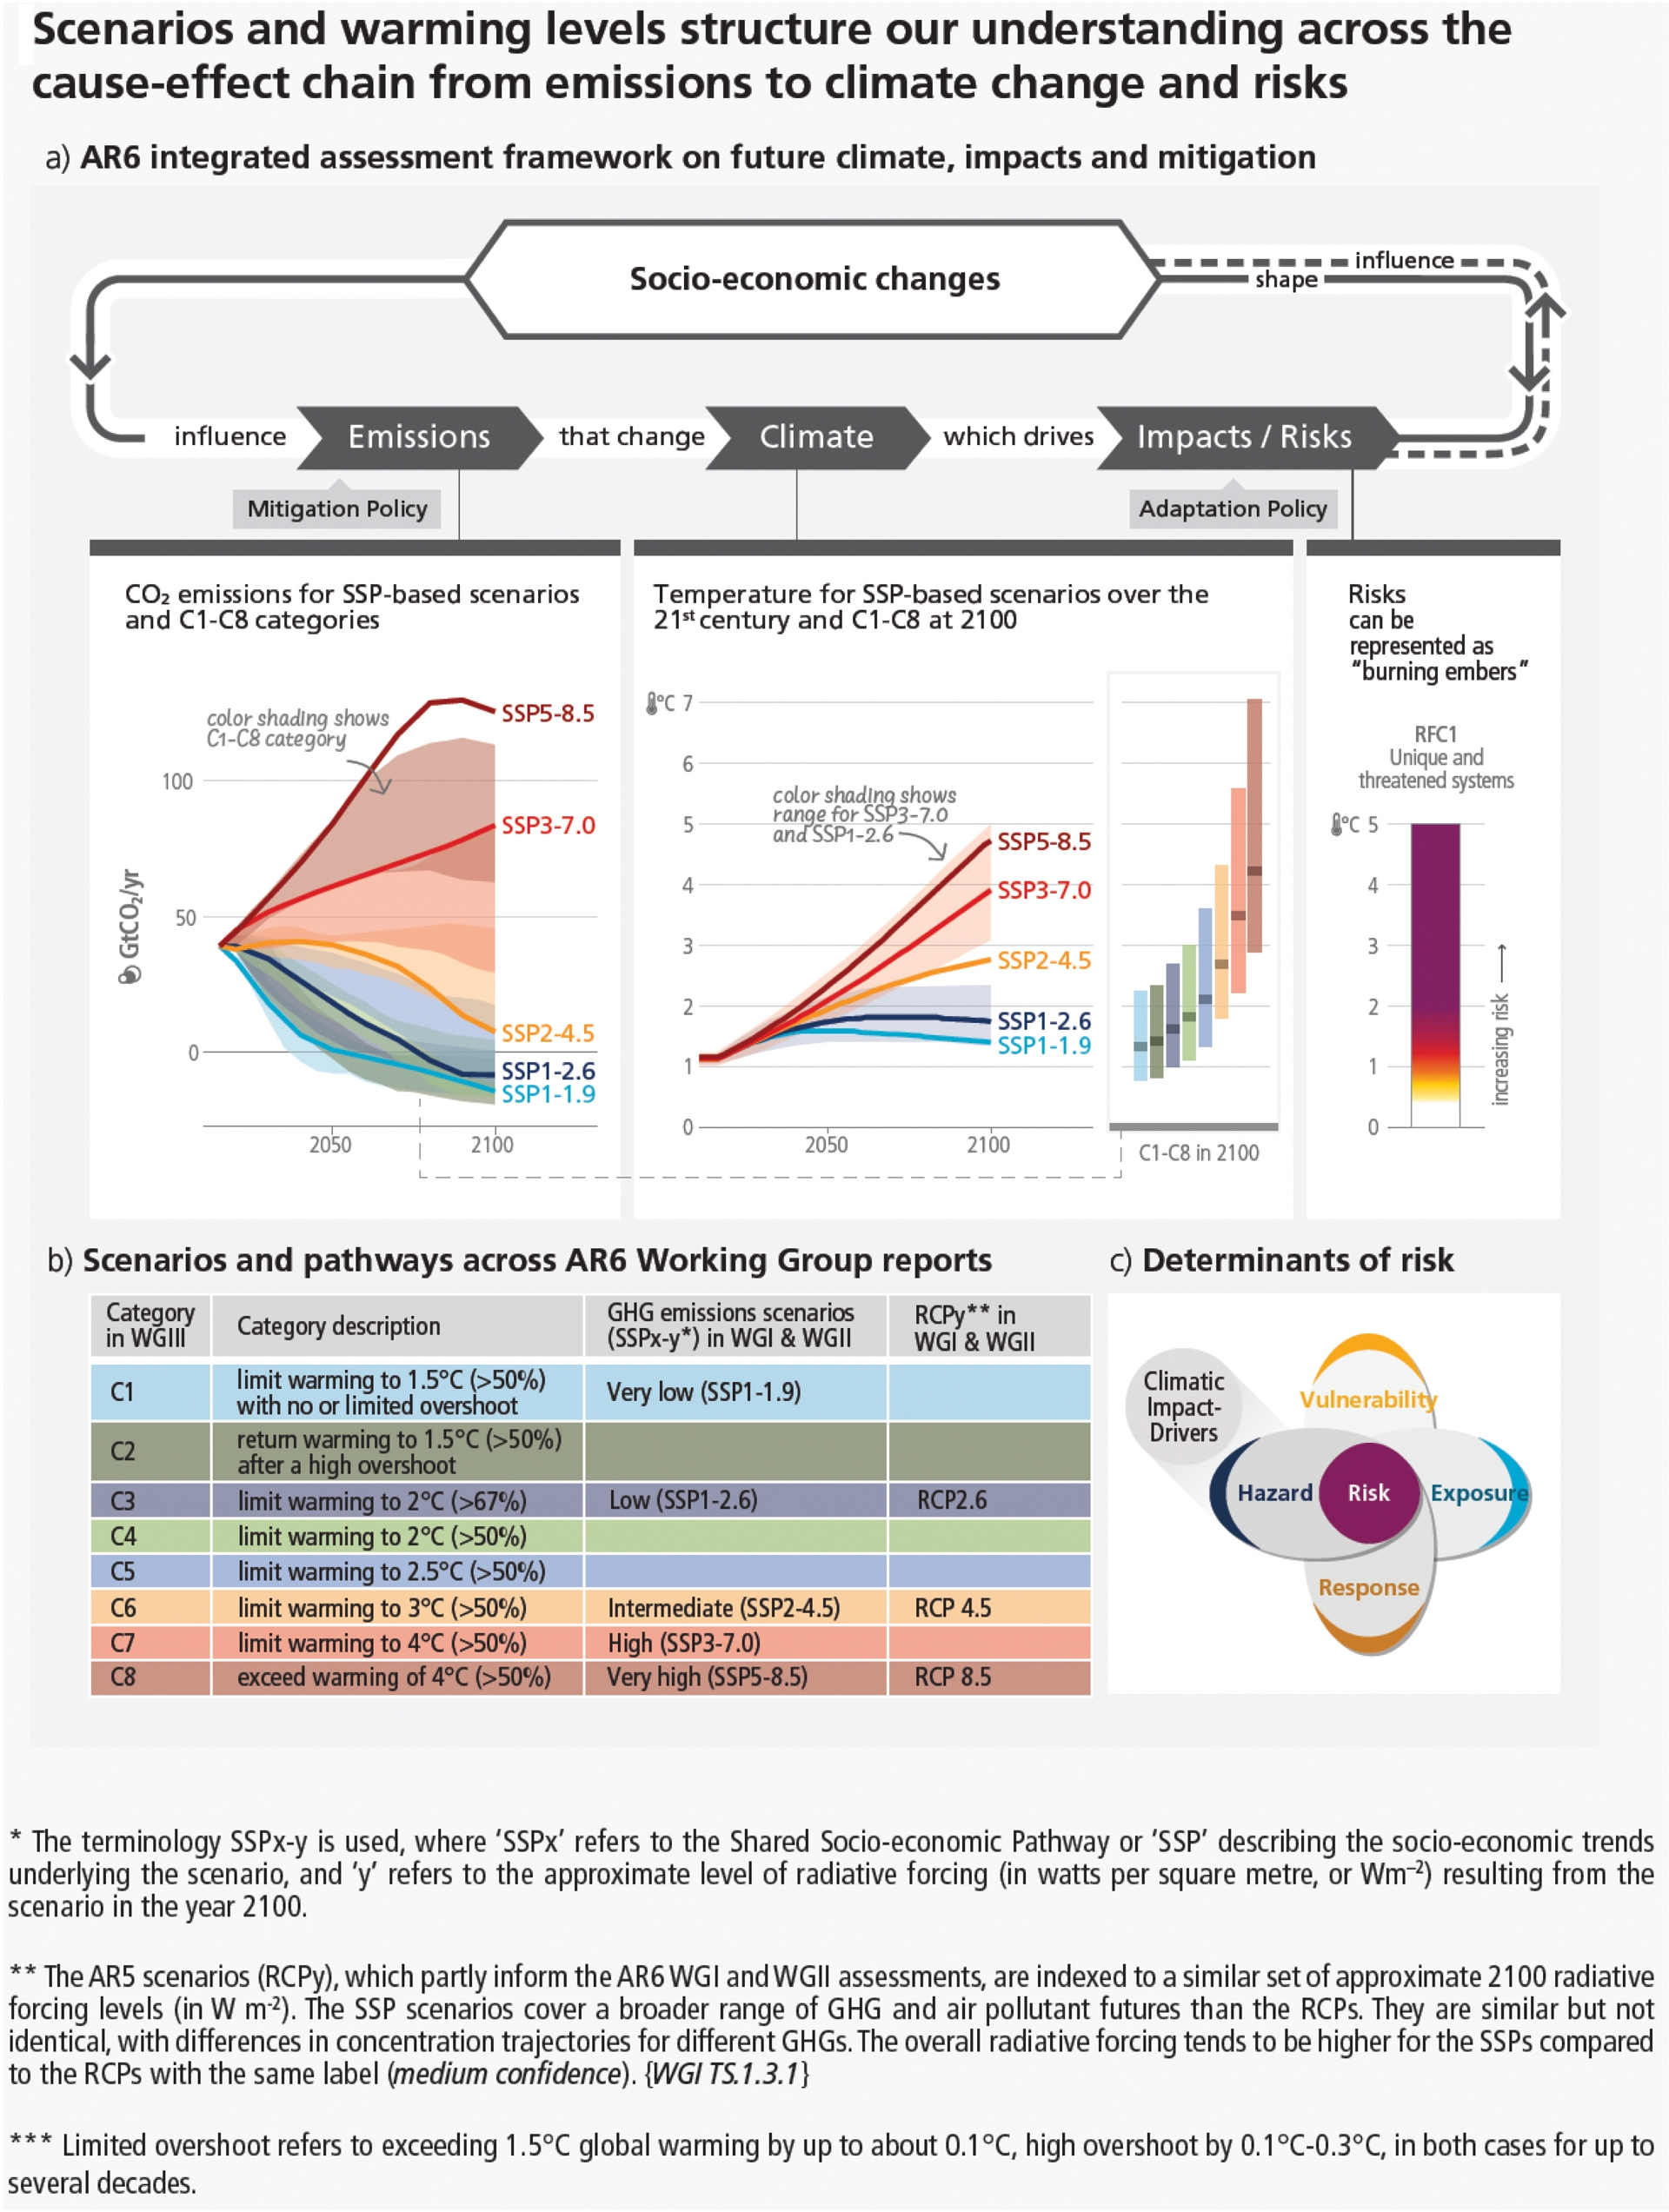
The core dimensions of integration between mitigation and adaptation efforts include global warming levels, as a result of changes in emissions and land-use driving changes in atmospheric concentrations and radiative forcing, and as a key element driving changes in climatic impact-drivers (Figure 1). The best estimate of future global warming levels over time arising from current policies can also be translated into regional warming levels, as reflected in the reference trajectory for national adaptation for mainland France (Corre et al., 2025).
As invited to the related keynote lecture presented at the French Academy of Sciences workshop on “The climate emergency, a turning point” in 2024, this manuscript provides an overview of the concepts and methodologies underpinning the Sixth Assessment Report of the Intergovernmental panel on Climate Change (IPCC) regarding the assessment of risks from the perspective of the physical science basis, and selected recent updates and discussions.
It includes a brief overview of the current state of heating of the global and regional climate (Section 2), and an overview of future warming scenarios (Section 3), spanning socio-economic scenarios (Section 3.1), and methodologies to provide constrained climate projections (Section 3.2). Within the framework of robust decision-making under deep uncertainty and risk management, I then place an emphasis on aspects related to deep uncertainty and the importance of considering low-likelihood, high-impact outcome (Section 3.3), followed by final remarks on advances in future climate scenarios (Section 4).
2. The current state of climate
2.1. Observed and attributed changes in global indicators of the state of climate
In 2024, for the first time in instrumental records, estimates of global surface temperature exceeded 1.5 °C above 1850–1900 (Figure 2), a reference period often used to characterize pre-industrial conditions (WMO, 2026). This new temperature record in both land surface air temperature and sea surface temperature reflects internal climate variability on top of the long-lasting heating of the climate system resulting from human activities (WMO, 2026; Terhaar et al., 2025). Indeed, the internal variability in any single year is estimated to be ±0.25 °C (5–95% range) based on CMIP6 climate models, and ±0.17 °C based on observations (IPCC, 2021).
Screenshot of the dashboard of key indicators of the state of climate and human influence (Forster, Smith, Walsh, Lamb, R. Lamboll, Cassou, et al., 2025). The left upper panel displays the current level of human-caused global warming (1.36 °C by 2024) and the years when specific levels of human-caused global warming are expected to be reached assuming the continuation of the rate of human-caused warming estimated during the last decade. The left middle panel displays observed annual global surface temperature anomalies up to 2024 with respect to 1850–1900 (grey) and the outcome of the assessment of human-caused global warming (orange). The left lower panel displays the observed change in global mean sea level from 1993 to 2024. The right upper panel shows annual emissions of greenhouse gases identified with different colors as indicated in the legend. The right lower panel indicates the estimated remaining carbon budget here associated with limiting global warming to 1.5 °C with a 50% likelihood, and when it is expected to be exhausted, at current emissions levels. Note that the interactive website allows us to select different global warming levels and likelihoods. Replicated from https://climatechangetracker.org/igcc.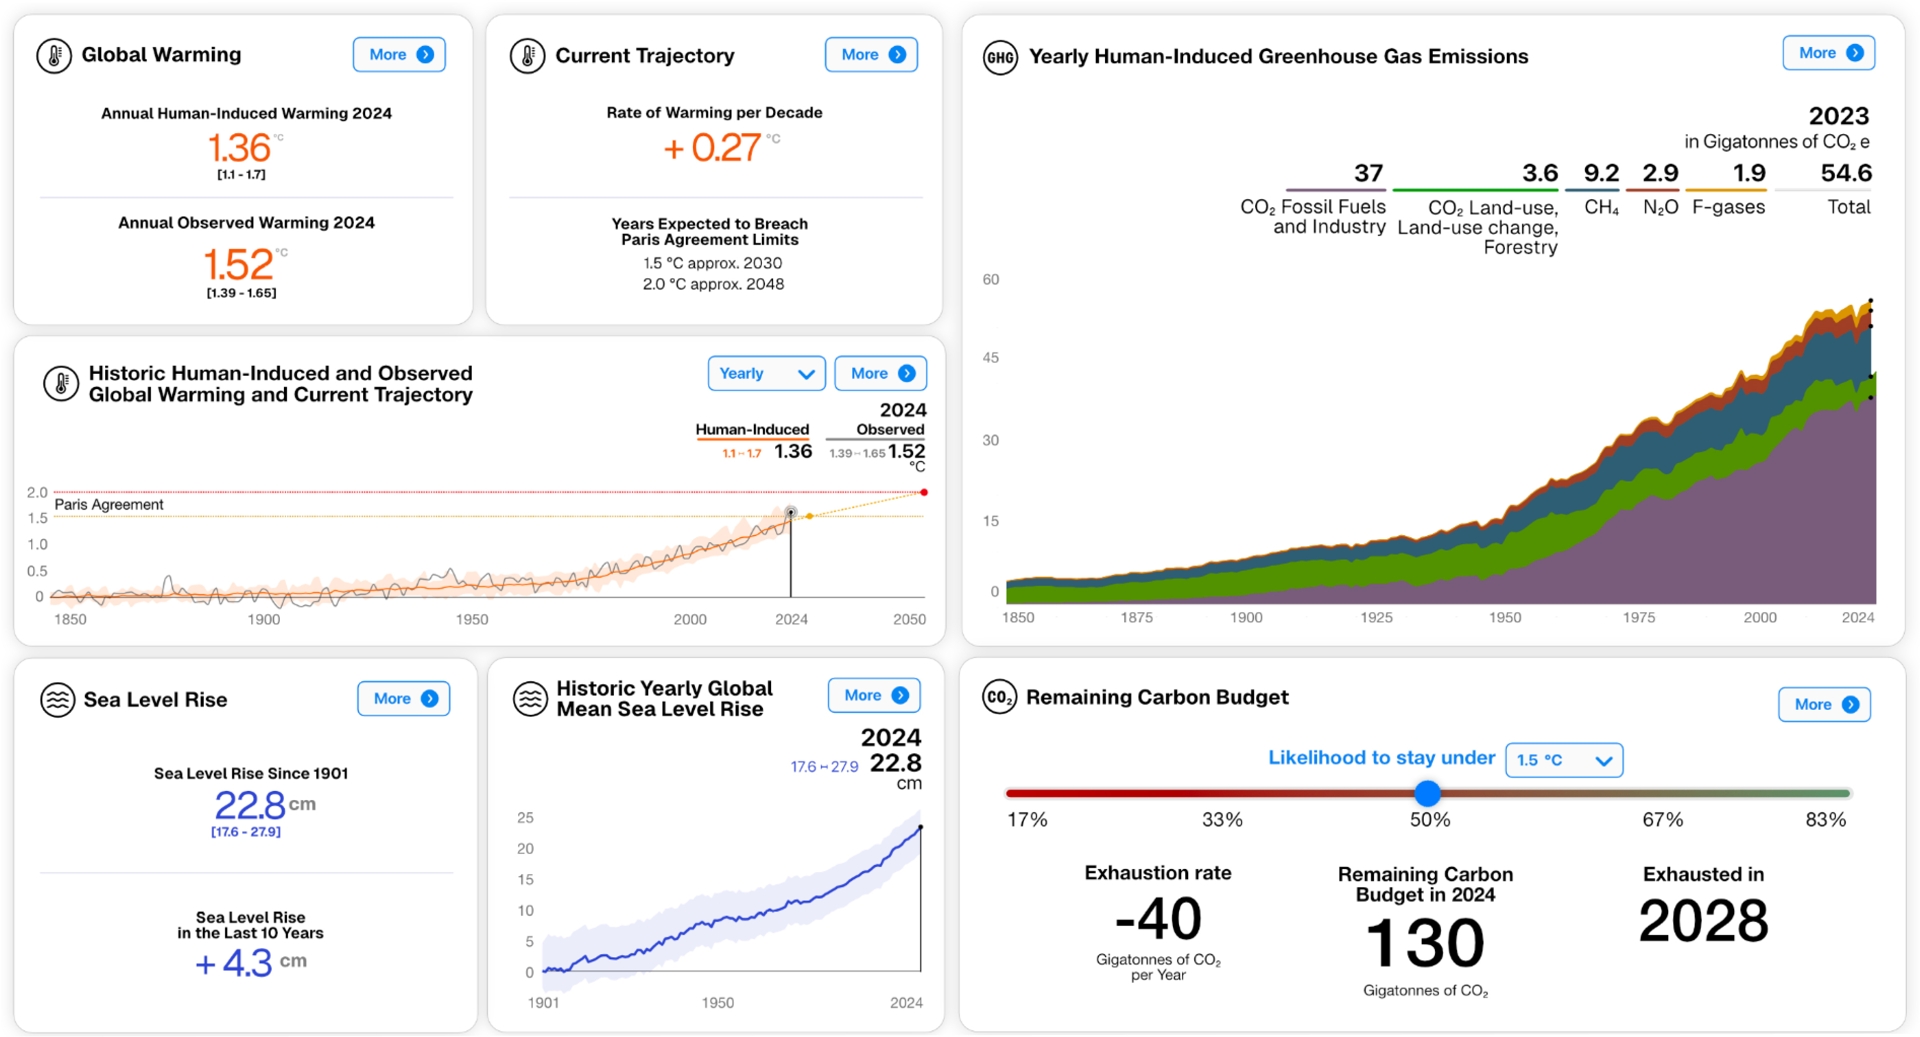
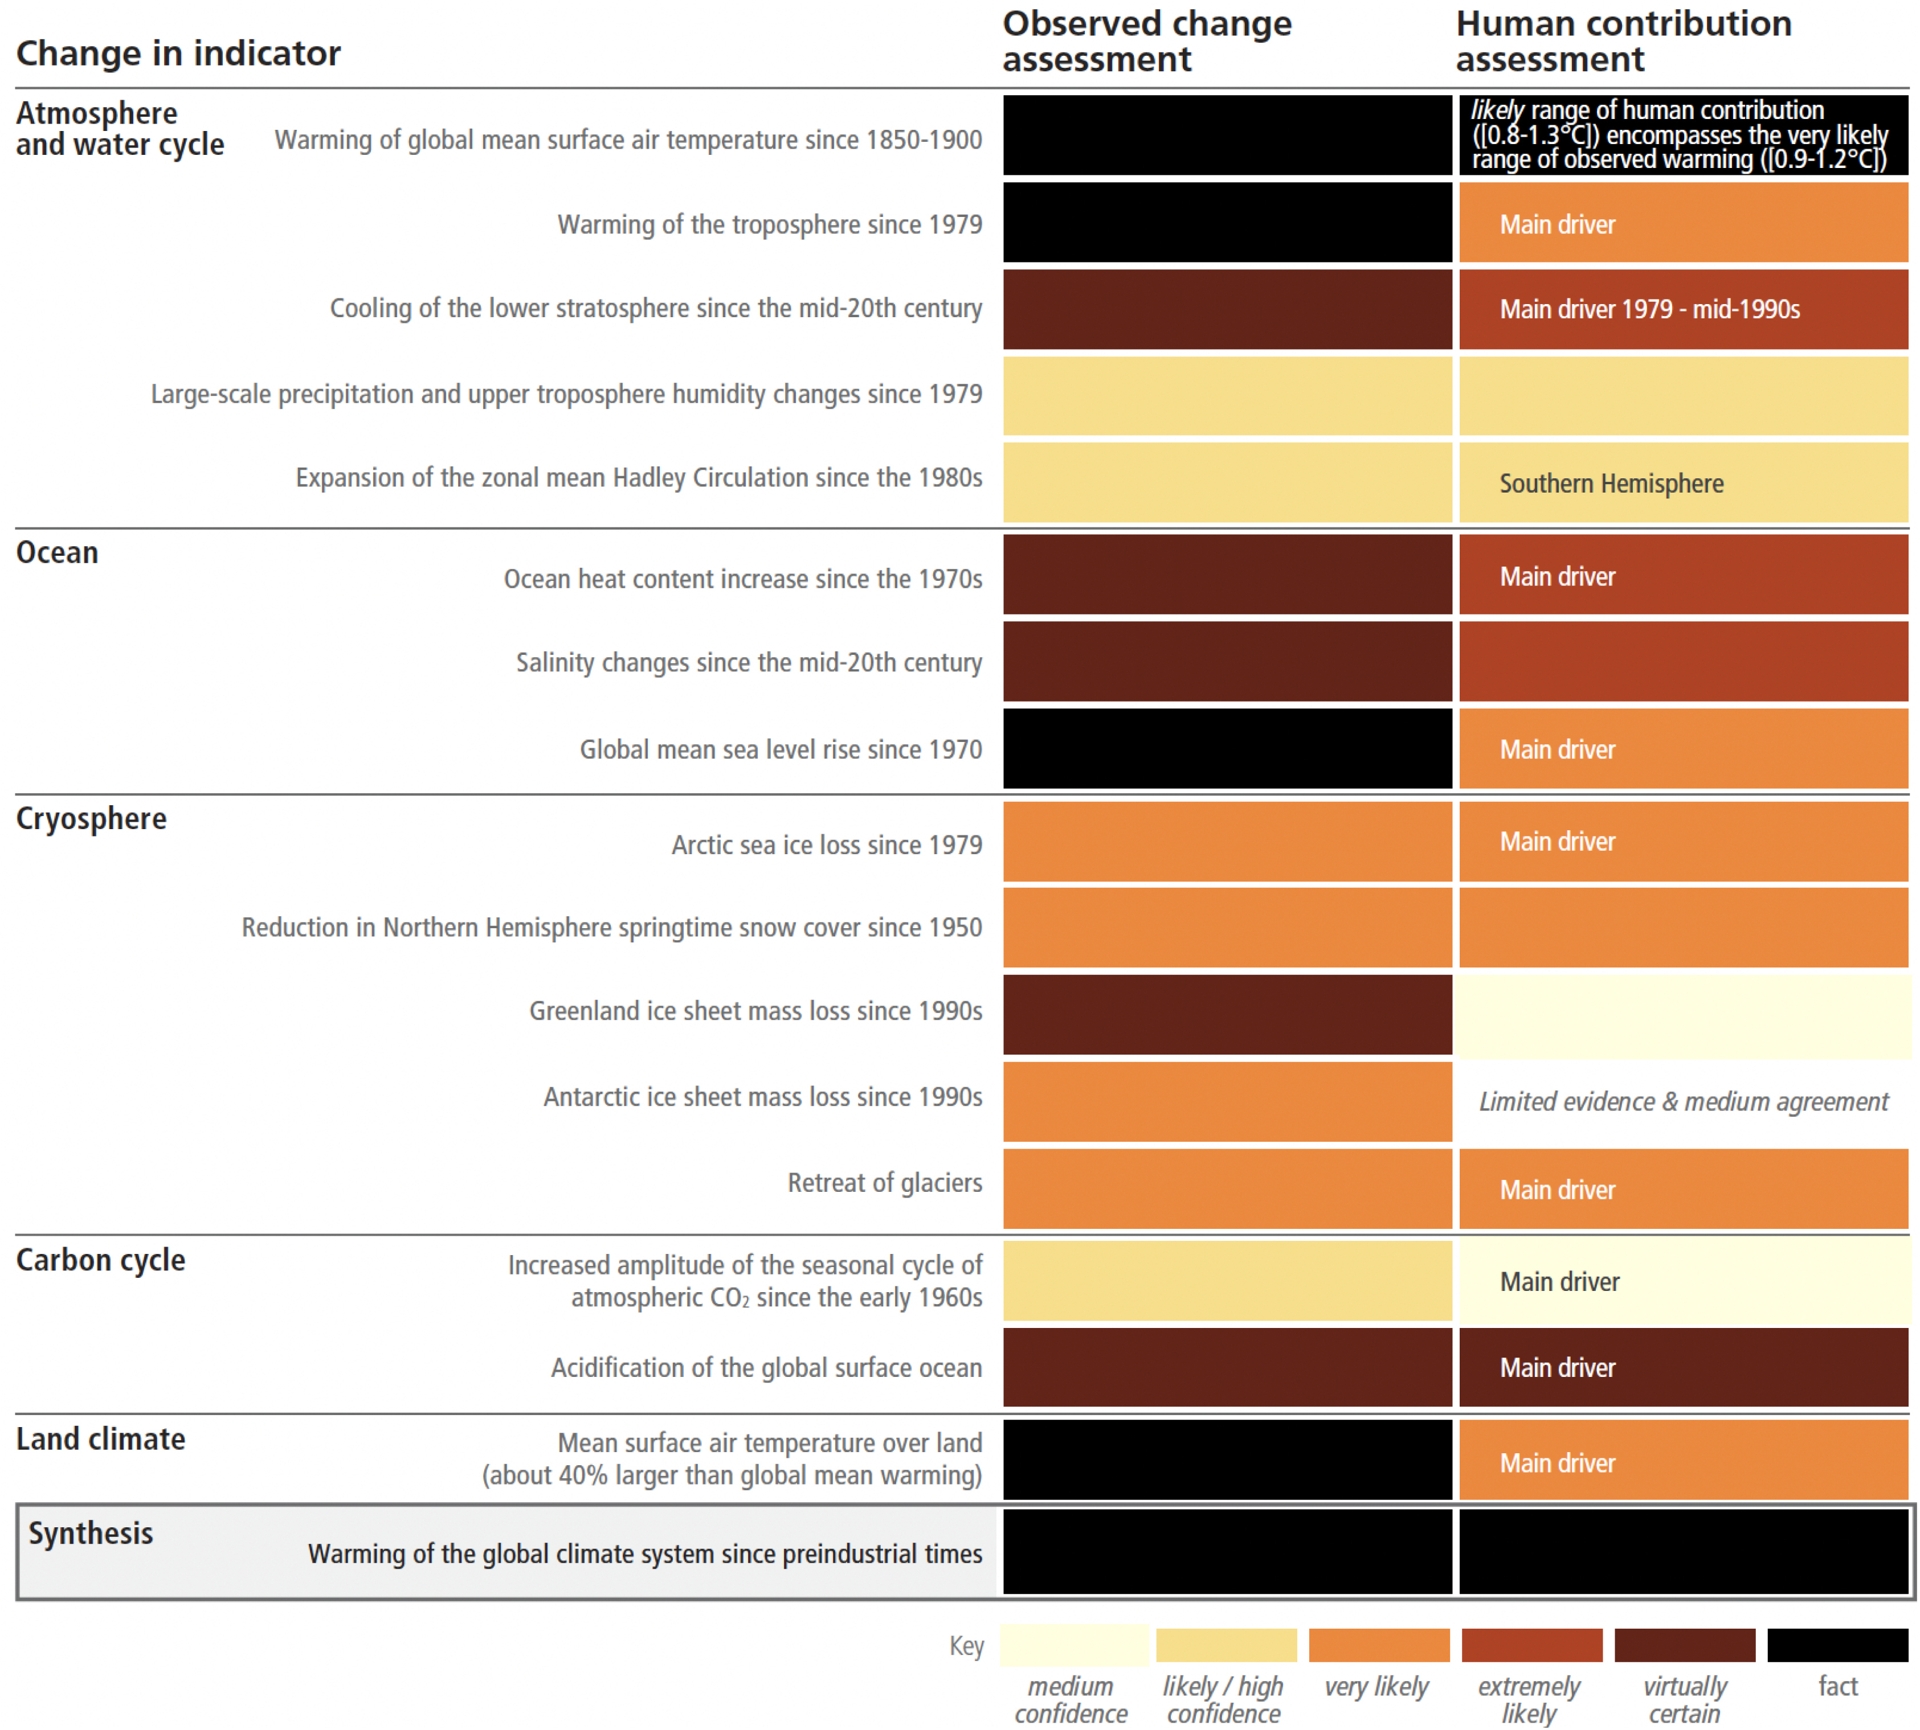
Advances in attribution methods provide a framework (Hope et al., 2021) to understand observed changes (Table 1), and to identify climatic impact-drivers: attribution of changes in atmospheric composition and resulting radiative forcing to human activities; attribution of changes in a range of variables describing the global and regional state of climate to human influence; attribution of weather and climate events to human-caused climate change (Perkins-Kirkpatrick et al., 2024); and attribution of observed impacts in various sectors, regions, natural and human systems to climatic drivers, themselves attributable to human influence. Here, we focus on indicators of global climate, and attribution outcomes.
Synthesis of the assessment of changes in large-scale indicators of the state of components of the climate system for observed changes (described in the left column) for observed changes (middle column) and their attribution to human influence up to the year 2019 (right column). The color coding indicates the assessed confidence/likelihood of the observed change, using the calibrated IPCC methodology to report confidence in findings, and the human contribution as a driver or main driver (more than 50% of observed change, as specified in the table box). Reproduced from the IPCC AR6 Synthesis Longer Report (IPCC, 2023), based on (IPCC, 2021).
 |
Based on methods and datasets assessed in the Sixth Assessment Cycle of the Intergovernmental panel on Climate Change (IPCC, 2021) (Table 1), updated until the end of year 2024, the observed level of global warming has reached 1.24 (1.11–1.34) °C above 1850–1900 in 2015–2024, of which 1.22 (1.0–1.5) °C is attributable to human influence. Human-caused global warming continued at a record pace of 0.27 (0.2–0.4) °C per decade in 2015–2024, reaching 1.36 (1.1–1.7) °C by 2024 (Forster, Smith, Walsh, Lamb, R. Lamboll, Hall, et al., 2024; Forster, Smith, Walsh, Lamb, R. Lamboll, Cassou, et al., 2025). The increased global warming rate results from increased radiative forcing. It is primarily due to anthropogenic emissions of greenhouse gases, to which is added the loss of the cooling effects resulting from reduced emissions of aerosols, which track scenarios of strong pollution control. The probability of seeing an observed temperature of 1.52 °C in 2024 considering a human-induced warming equal to 1.36 °C is about one chance out of six; the same probability but conditional on the fact that 2024 followed an El Niño year and that the Atlantic multidecadal variability (AMV) was in a positive phase rises to one chance out of two. 2024 can therefore be treated as a “normal” year, i.e. very much expected at the actual human-caused global warming level when the internal modes of variability are taken into account and when assessed from a very large number of simulations from large ensembles.
Amongst greenhouse gases, the largest contribution to the observed warming effect arises from emissions of CO2, followed by emissions of CH4 with a direct effect and an indirect effect through its role as a precursor of tropospheric ozone formation (IPCC, 2021). Combustion and fugitive emissions for fossil fuels account from around 70% of greenhouse gas—caused warming, with other sources of greenhouse gas emissions arising from land-use, agriculture, cement production, waste, and F-gas emissions (Forster, Smith, Walsh, Lamb, R. Lamboll, Cassou, et al., 2025). Around 10% of global CO2 emissions are driven by change in land-use and in particular deforestation, and 90% are driven by fossil fuel combustion and cement production (Friedlingstein et al., 2025).
In a fast changing climate, these annual updates of the key indicators of global climate change and of the global carbon budget represent a major effort in how the research community builds on the in-depth assessment of datasets and methodologies within IPCC reports to inform evidence-based decision-making with up-to-date and timely information. Annual update approaches have recently been implemented for wildfires (Kelley et al., 2025). A new methodological challenge will be to assess the contributions of carbon cycle feedbacks such as wetland methane emissions or wildfire CO2 emissions to changes in atmospheric greenhouse gas concentrations. There is also a need for annual updates of climate forcing datasets for climate simulations (Naik et al., 2025). Moreover, annual updates of forced warming can also be used to update constrained projections (Ribes, Tessiot, et al., 2025).
Human-caused heating of the climate system drives widespread and rapid changes in each component of the climate system, atmosphere, ocean, biosphere and cryosphere (Table 1) and exacerbates the frequency and intensity of extreme events such as marine and terrestrial heatwaves, agricultural (soil moisture) drought, and extreme rainfall (WMO, 2026; IPCC, 2021), leading to negative impacts and losses and damages for ecosystems and human activities (IPCC, 2022a).
Global mean sea-level rise is also a direct consequence of the Earth’s energy imbalance and heating of the climate system, with an acceleration of its pace from 2 mm/year in the 1990s to more than 4 mm/year in the recent decade, with the mass loss from Greenland and Antarctica adding to glacier retreat and increased rates of ocean heat uptake and resulting thermal expansion (WMO, 2026) (Forster, Smith, Walsh, Lamb, R. Lamboll, Cassou, et al., 2025). Due to the slow adjustment and delayed response of glaciers, ice sheets and ocean heat at depth, past greenhouse gas emissions and the current level of global warming already imply multi-centennial committed sea level rise of more than 1 meter (Mengel et al., 2018; Nauels et al., 2019). Annual updates of committed future sea-level rise resulting from past emissions to date are not yet available. However, the magnitude and rate of future sea-level rise and the timing of when 1 m of sea level rise will be exceeded depend on both future emissions and ice sheet processes associated with deep uncertainty (IPCC, 2021).
The level of human-caused global warming is related to changes in global (Table 1) and regional climate characteristics, resulting in changes in characteristics (intensity, frequency, duration, timing, and spatial extent) of multiple climatic impact-drivers, which are “physical climate system conditions (e.g., means, events, and extremes) that affect an element of society or ecosystems” (Ruane et al., 2022).
This climatic impact-driver framework is based on essential climate variables and physical thresholds, accounting for instance for the combination of extreme heat and humidity which challenges the ability to regulate body temperature (heat health index), or combined hot, dry and windy weather conditions favorable to wildfires (forest fire danger index).
Compound, sequential or simultaneous climatic impact-drivers can affect systems in ways that extend beyond individual components. This is typically the case for compound flooding, with overlapping extreme sea level resulting from storm surge and fluvial flood resulting from extreme rainfall (Hermans et al., 2024). In Europe, there is the emergence of compound events such as the co-occurrence of marine and atmospheric heatwaves, drought and fire activity (Santos et al., 2024), and the pre-conditioning of compound heavy hourly rainfall events by heatwaves. An example of a sequential ecoclimatic event consists of a warm early season, leading to an early onset of vegetation growth, followed by late frost, damaging grapevines and orchards (Bastos et al., 2023). In France, winter wheat crop yields are more severely affected by successive events, such as winter and spring drought, followed by summer heat and drought, than by each individual driver (Shan et al., 2024). Simultaneous events can be for instance concurrent extreme events affecting large crop production regions.
Depending on system tolerance, climatic impact-drivers and their changes can be detrimental, beneficial, neutral, or a mixture of each across interacting system elements and regions. Current and future impacts and climate-related risks thus depend on the interplay between response measures affecting exposure, vulnerability, and hazards resulting from climatic impact-drivers, themselves related to global warming levels (Figure 1).
2.2. Amplified warming observed in Europe and mainland France
Warming is amplified over land, compared to the ocean. Europe is the continent outside the Arctic characterized by the largest rate of regional warming (Copernicus Climate Change Service (C3S) and World Meteorological Organization (WMO), 2025). The observed increase in regional surface air temperature averaged over the last decade has already exceeded 2 °C above 1850–1900 (Heino et al., 2023)—with a similar result in mainland France (Météo France, 2025b). The enhanced Europe warming rate results from feedbacks associated with the reduced snow cover duration, in the north-east parts and in mountains, as well as feedbacks associated with agricultural drought and surface heat, with a rapid increase in heatwave frequencies.
The European “heatwave hotspot” is increasing faster in observations than in climate model simulations, due to regional trends in atmospheric circulation (Vautard et al., 2023) and aerosol emissions (Schumacher et al., 2024). Attribution methodologies have been applied to the increase in surface air temperature in mainland France (Ribes, Boé, et al., 2022). During the last decade, the observed level of warming in mainland France has already reached the level expected to be reached by 2030, for a level of human-caused global warming of 1.5 °C (Météo France, 2025a).
2.3. Systematic comparisons between observed trends and climate simulations
Systematic comparisons have been performed between observed changes in the climate system, and the expected human-caused signals depicted in simulations performed with climate or Earth system models, decades ago (Hausfather, Drake, et al., 2020; IPCC, 2021; Stouffer and Manabe, 2017), including early projections of sea-level rise (Törnqvist et al., 2025).
A recent overview (Simpson et al., 2025) highlights the success of climate models to accurately represent historical increases in global mean temperature and global column water vapour, the global increase in extreme precipitation event intensity, the decline in wintertime cold extremes in the northern hemisphere, the increased recurrence of marine heat waves, and the increased amplitude of the seasonal cycle of sea-surface temperature in the northern hemisphere. Models have also successfully captured the expansion of the Hadley cell1 edges, the weakening of the northern hemisphere jet stream and summer storm track, and the shift in the southern hemisphere mid-latitude jet in response to ozone depletion and its pause driven by ozone recovery.
Models have been successful in depicting the sign of the following changes, but could underestimate the magnitude of changes for the top-of-atmosphere radiative imbalance, for Arctic amplification and sea-ice retreat, for the weakening of the tropical overturning circulation, the increased contrasts of precipitation between tropical dry and wet regions, the increased precipitation variability; they could overestimate the magnitude of tropical troposphere warming.
Model-data discrepancies are identified for the pattern of tropical Pacific sea-surface temperature (SST) gradient, the strengthening of the wintertime North Atlantic jet, the increased in summer Greenland blocking, the exacerbated summer warming and drying in Europe (as described above), near-surface specific humidity above arid regions, and Southern Ocean SST and sea ice variations. The situation remains uncertain for the winter Eurasian temperature trend, Hadley circulation strength, southern hemisphere storm tracks and the poleward shift in the zonal mean jet streams.
Model-data discrepancies can arise from model caveats, including model representation of processes shaping climate feedbacks and/or model resolution, but also from issues related to observations, forcings used in simulations, and from internal (unforced) climate variability. Robust procedures are developed to identify and understand model-data agreement as well as sources of discrepancies. Such comparisons are embedded in diagnoses of the physical processes controlling the forced climate response to anthropogenic forcings, to advance the understanding of the physical climate response, the fitness for the purpose of models, and they inform the assessment of confidence in projections.
In the IPCC AR6 (Hausfather, Marvel, et al., 2022), the comparison between simulations and historical global temperature observations was used to apply different weights to combine projections from different climate models, further constrained by the assessment of climate sensitivity (Sherwood et al., 2020). Indeed, due to differences in observed and simulated patterns of warming, recent warming alone provides little information on climate sensitivity and future responses (Armour et al., 2024). Novel approaches are being explored to further constrain projections at global and regional scales (Y.-H. Kim et al., 2023; O’Reilly et al., 2024; Li et al., 2025), combining observations, simulations, machine learning (Nowack and Watson-Parris, 2025) and theoretical understanding (Byrne et al., 2024).
3. Future global warming scenarios
The dominant driver of current and future warming arises from anthropogenic CO2 emissions, as the responses of the climate system and carbon cycle lead to a close relationship between cumulative CO2 emissions and global warming levels (Canadell et al., 2021). This so-called transient climate response to cumulative emissions arises from counterbalancing non-linear effects, and has implications for relating a global surface temperature goal to a corresponding remaining carbon budget (R. D. Lamboll et al., 2023). If all human greenhouse gas and aerosol emissions were set to zero, the IPCC AR6 assessed uncertain but close to zero additional warming based on climate model simulations (C. D. Jones et al., 2019; IPCC, 2023; Palazzo Corner et al., 2023).
As a result, future warming will primarily depend on pathways of future emissions, primarily on global net CO2 emissions, but also on the net effect of non-CO2 anthropogenic drivers, and hence emissions of other greenhouse gases, and short-lived climate pollutants. The second most important driver of current and future warming is indeed the balance between emissions of methane and aerosols (IPCC, 2021). Future changes in drivers of climate change resulting from human activities are explored based on socio-economic emissions scenarios.
A broad range of modelled scenarios and pathways are used to explore quantitatively future emissions, climate change, climate-related impacts and risks, and mitigation and adaptation pathways. These scenarios and pathways are built on sets of assumptions regarding socio-economic aspects, to characterize socio-economic uncertainties.
3.1. Socio-economic scenarios
Socio-economic scenarios are an ensemble of opportunity, incomplete in essence, distinct from predictions. Five Shared socio-economic pathways (SSP1, sustainability; SSP2, current trends; SSP3, regional rivalry; SSP4, inequality; SSP5, fossil-fueled development) have been designed to encompass a broad range of challenges for climate change adaptation and mitigation (O’Neill et al., 2017) (Figure 3). For climate-related impacts and risks, SSPs are used to evaluate exposure, vulnerability, and adaptation challenges.
A summary of SSP elements that contribute to high or low challenges to (a) mitigation and (b) adaptation (O’Neill et al., 2017), and (c) indicative temperature evolution (left) and radiative forcing categorization (right) of the core set of scenarios used in the IPCC AR6 WGI report (SSP1-1.9, SSP1-2.6, SSP2-4.5, SSP3-7.0 and SSP5-8.5) together with four additional scenarios that are part of ScenarioMIP and previous RCP scenarios. The black stripes on the left-hand panel indicate a larger set of IAM-based SSP scenarios that span the scenario range more fully but are not used in the IPCC AR6 WGI report. Note that the descriptive labels for the five SSP narratives refer mainly to the reference scenario futures without additional climate policies (IPCC, 2021).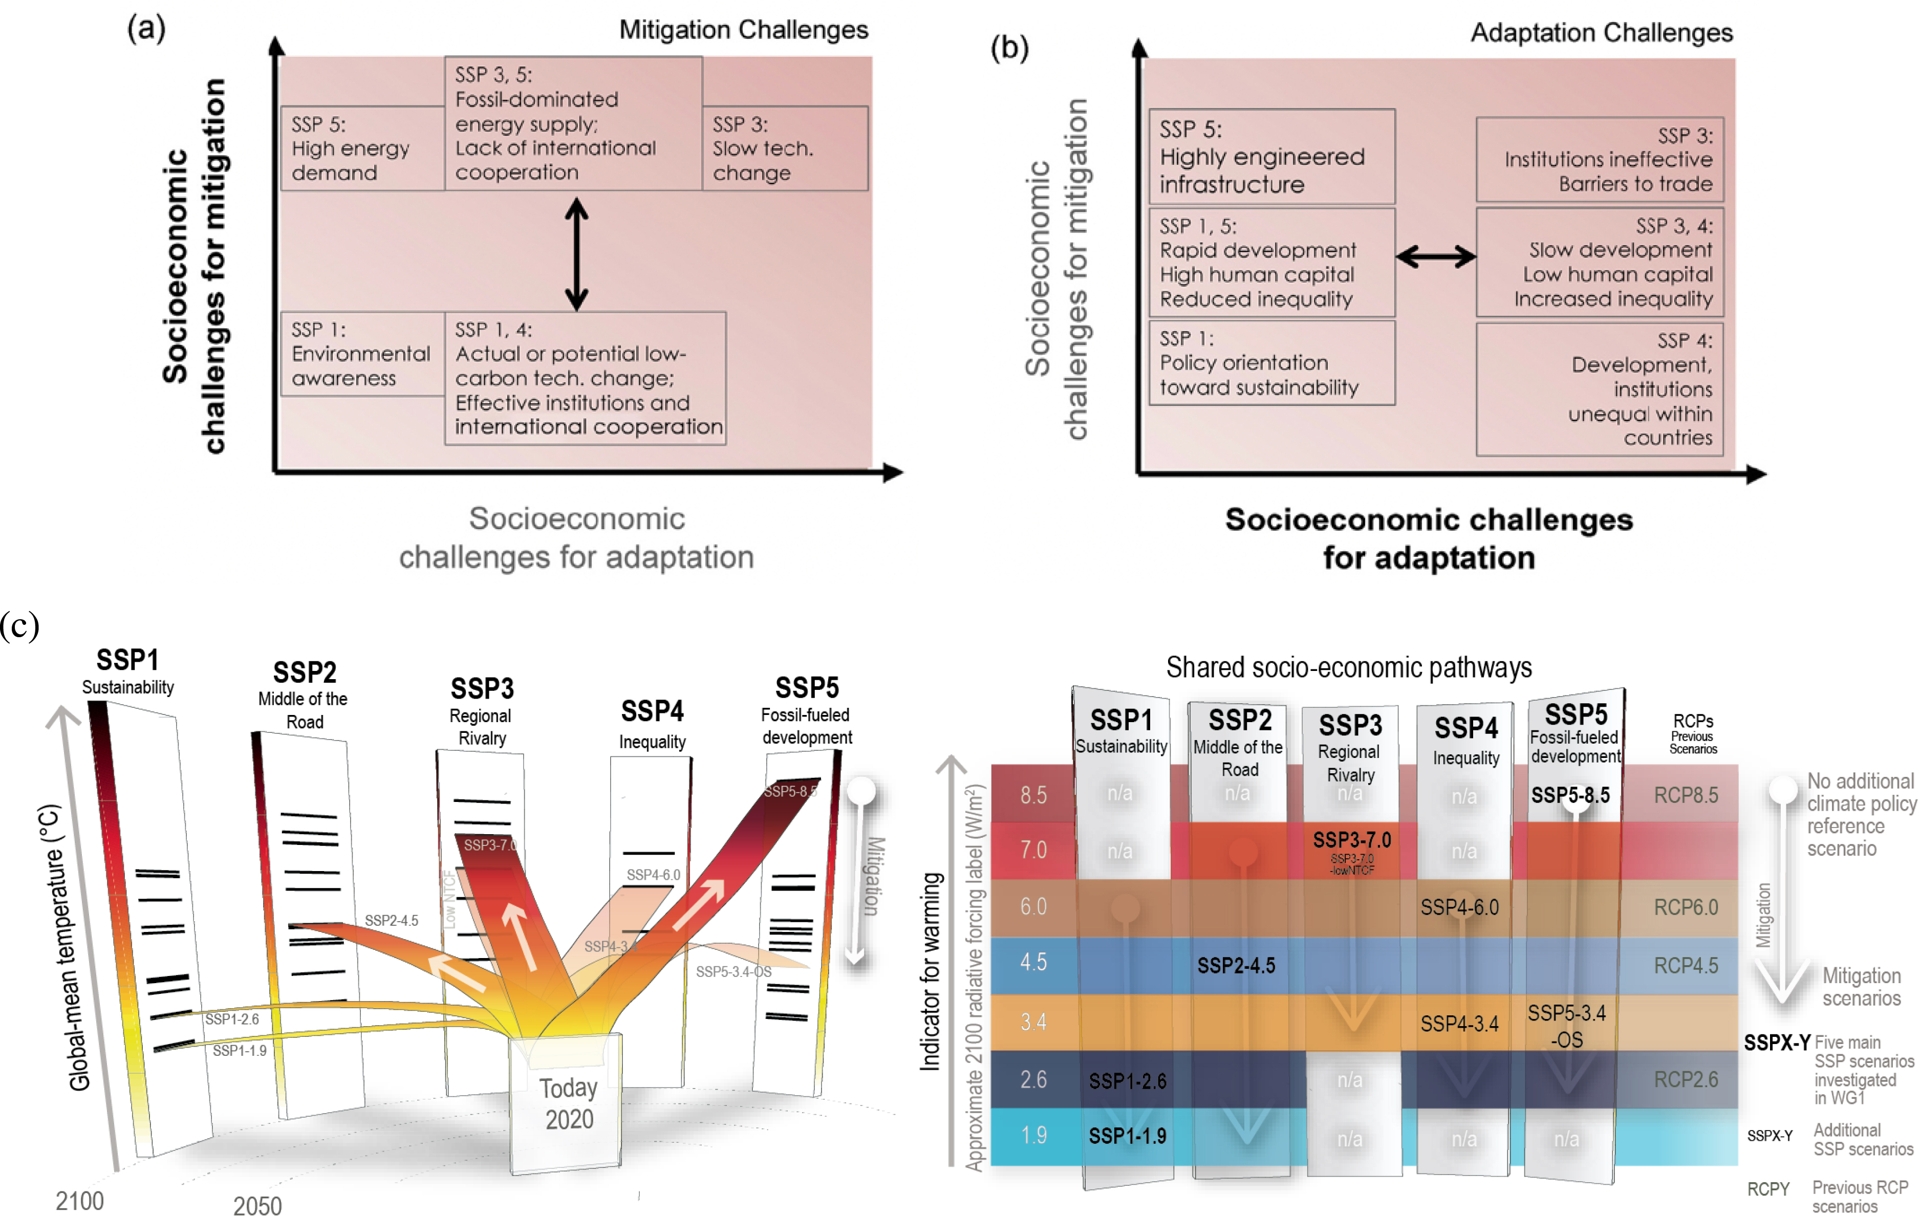
Depending on mitigation levels, modelled emissions pathways from SSPs (Riahi et al., 2017) can be consistent with different global warming levels (Figure 3).
For instance, scenario SSP3 displays high challenges for adaptation, and high challenges for mitigation—making limiting global warming well below 2 °C unfeasible. As this scenario echoes some recent geopolitical events, it deserves specific attention regarding its implication for climate change: “SSP3 explores a narrative of resurgent nationalism, concerns about competitiveness and security, and regional conflicts which push countries to increasingly focus on domestic or, at most, regional issues. This trend is reinforced by the limited number of comparatively weak global institutions, with uneven coordination and cooperation for addressing environmental and other global concerns. Policies shift over time becomes increasingly oriented toward national and regional security issues, including barriers to trade, particularly in energy resources and agricultural markets. Countries focus on achieving energy and food security goals within their own regions at the expense of broader-based development, and in several regions move toward more authoritarian forms of government with highly regulated economies. Investments in education and technological development decline. Economic development is slow, consumption is material-intensive, and inequalities persist or worsen over time, especially in developing countries. (…) Growing resource intensity and fossil fuel dependency along with difficulty in achieving international cooperation and slow technological change imply high challenges to mitigation. The limited progress on human development, slow income growth, and lack of effective institutions, especially those that can act across regions, implies high challenges to adaptation for many groups in all regions” (O’Neill et al., 2017).
While the narrative of SSP can echo some aspects of the current world context, it does not imply that model pathways based on SSP3 are closer to current trends or should be considered of higher relevance, because SSP storylines are scenarios for the medium and long term, and because the implementation of the SSP3 storyline in models may not reflect current trends, such as international trade, technological shifts towards renewables, policy momentum in many nations, climate finance and more cooperation than in the SSP3 worst case.
Different mitigation strategies can be consistent with different warming levels by 2100. SSP-based scenarios are labelled SSPx-y, where “x” refers to the shared socio-economic pathway, describing socio-economic trends, while “y” refers to the magnitude of resulting radiative forcing resulting from that scenario, in W⋅m−2 by 2100 (Figure 1). The response of the climate system was assessed (IPCC, 2021) for five illustrative pathways based on SSPs and which encompass the whole range of future anthropic forcings available from the scientific literature. These scenarios combine socio-economic assumptions, and different levels of mitigation, land use, and atmospheric pollution controls for emissions of aerosols and precursors of ozone formation. The comparison between scenarios and emission inventories requires to accounting for different accounting conventions for land-based carbon fluxes (Gidden et al., 2023).
High and very high emissions scenarios (SSP3-7.0 et SSP5-8.5) have respectively a doubling of CO2 emissions by 2100 and 2050, respectively (Figure 1). Such high emissions scenarios are less plausible owing to technological progress and mitigation policies already implemented. Indeed, more than 24 countries, including France, have passed peak CO2 emissions and started sustained emissions reductions (Lamb et al., 2022). On the global scale, CO2 emissions continue to increase, albeit at a smaller rate than one decade ago. Avoided emissions arise from mitigation policies (Stechemesser et al., 2024), such as reduced deforestation, low-carbon electricity production, gains in energy efficiency and technological innovation policies allowing for reduced costs and increased capacities for PV electricity production and batteries (IPCC, 2022b).
The intermediate emissions scenario (SSP2-4.5) is characterized by relatively stable global CO2 emissions until mid-century, followed by a slow decline (Figure 1). This is the scenario closest to the extrapolation of current mitigation policies and nationally determined contributions pledged within the Paris Agreement (UNEP, 2024).
Low of very low emissions scenarios are marked by sharp declines in global CO2 emissions reaching net zero CO2 emissions by 2050 and 2070, respectively, followed by various levels of net negative CO2 emissions (Figure 1). Both are also characterized by a rapid reduction in methane emissions.
This core set of 5 scenarios, with differences in air pollution control and mitigation stringency, cover a broader range of greenhouse gas and air pollutant futures than assessed in earlier IPCC WGI reports.
3.2. Constrained global surface temperature projections and implications for France
The uncertainty on future climate projections depends on the socio-economic uncertainties affecting future emissions (scenario uncertainty), but also on the relationship between emissions and concentrations (carbon feedback uncertainty, affecting the natural response of the land and ocean carbon sinks), and on the uncertainty of the climate response, which is related to the understanding of the physical response of the climate system to changes in atmospheric composition resulting from climate feedbacks and climate sensitivity as well as the structural uncertainties in the climate model. To that is added the irreducible and intrinsic uncertainties related to external natural forcings (solar and volcanic activity), and internal climate variability.
One first approach to explore the uncertainty of the future climate response is based on climate model results from the Sixth phase of the Climate Model Intercomparaison Project CMIP6 (Eyring, Bony, et al., 2016), and the range of simulated responses to a given atmospheric concentration or emissions scenario, which includes both large ensembles to span the range of simulated internal variability, and multi-model ensembles, to span the uncertainty of climate feedbacks and climate sensitivity (IPCC, 2021).
Earth system models which include the explicit modelling of some processes of the carbon cycle interplay with climate can be driven by emissions, or by prescribed atmospheric concentrations, based on a central estimate of the carbon cycle feedbacks. For a few Earth system models for which both emission-driven and concentration-driven simulations were available for the same scenario, the differences were small, and do not affect the assessment of global surface temperature projections by more than 0.1 °C by 2100, with a 0.1 °C larger spread (ibid.). However, this is only true for high emission scenarios, but not for overshoot scenarios, due to non-linearities and higher uncertainties of the simulated carbon cycle in response to a change from positive to negative emissions (Asaadi et al., 2024).
When comparing scenario-based, multi-model projections in CMIP5 to CMIP6 (Durack et al., 2025), about half of the increase in simulated warming in CMIP6 compared to CMIP5 arises from a higher radiative forcing in nominally-corresponding scenarios: the radiative forcing is larger in SSP5-8.5 than in the earlier RCP8.5 concentration pathway. The plausibility of such high emissions scenarios is challenged due to developments in climate policies and advances in clean technologies. However, the high atmospheric greenhouse gas concentration levels corresponding to these high emissions scenarios cannot be ruled out, due to uncertain carbon cycle feedbacks, which, in lower emissions trajectories, could result in concentrations above the central levels used to drive climate model projections. The other half of the increased simulated warming arises from a larger prevalence of high climate sensitivity within CMIP6 compared to CMIP5 climate models (IPCC, 2021).
Methodological advances (Sherwood et al., 2020) now allow to combine new evidence of the Earth’s climate sensitivity, based on the understanding and quantification of the Earth’s energy imbalance, the instrumental record of global surface temperature change, paleoclimate reconstructions, and climate feedbacks, in a holistic view (Jeevanjee et al., 2025). In particular, feedback processes are now understood to become more amplifying on multi-decadal time scales, depending on the pattern of warming (Armour et al., 2024). This has to be accounted for when using insights from historical records or past cold periods (Cooper et al., 2024). Accounting for the pattern effect provides a framework to combine lines of evidence based on paleoclimate and recent trends, and supports an updated assessment of the best estimate of equilibrium climate sensitivity of 3 °C, with a very likely range of 2 to 5 °C, and a likely range of 2.5 °C to 4 °C which is narrower than previously assessed. Clouds remain the main cause of uncertainty in climate feedback, but advances in the understanding of cloud processes have led to a narrowing of the associated uncertainty range by about 50% in the AR6 compared to the AR5 (IPCC, 2021). Uncertainties resulting from cloud processes are further evidenced by recent studies (Goessling et al., 2025).
On average, CMIP6 models have higher mean values and wider spreads than these assessed best estimates and ranges, resulting from larger cloud feedback, and some of the high-sensitivity and low-sensitivity CMIP6 models are less consistent with the observed historical warming trend and paleoclimate data (Lunt et al., 2024). The models with very high responses provide insights into low-likelihood, high-impact futures which cannot be excluded based on the current state of knowledge (IPCC, 2021).
In order to combine all available lines of evidence, and not just raw climate model results, the IPCC AR6, for the first time, explicitly combined new projections for the selected SSP-RCP scenarios with observational constraints, based on past simulated warming, as well as the updated assessment of equilibrium climate sensitivity and transient climate response. Moreover, climate predictions initialized from the observed climate state have also been used for the period 2019–2028 (ibid.). More recently, methodologies have been developed to allow for annual updates of forced warming and constrained projections (Ribes, Tessiot, et al., 2025), and remain to be implemented on a routine basis.
The outcome of these approaches is reflected in Figure 1, showing the best estimate and likely range of the assessed climate response to the five illustrative SSP-RCP scenarios. They show that the effect of emissions reductions on the slowing down of the rates of global warming would be detectable from natural climate variability within around 20 years. As a result, a level of 1.5 °C of global warming is expected to be reached (averaged over 20 years) in the coming decade across all scenarios, with the crossing time expected in the early 2030s. On other time horizons, future warming depends on the scenario. For instance, a 2 °C level of global warming is crossed under intermediate to high emissions scenarios, and is unlikely to be crossed for low and very low emissions scenarios.
The IPCC assessment does not provide guidance nor a likelihood assessment of the plausibility of climate future scenarios, but highlights that recent and future emissions trends expected from current policies are closest to an intermediate scenario. Future warming implied by current policies has also been updated annually (UNEP, 2024). However, current policies might be reversed, and a large uncertainty range is attached to the best estimate of the climate response to a given scenario: under SSP2-4.5, the very likely range (90% interval) of assessed global warming by 2081–2100 spans from 2.1 to 3.5 °C of global warming, for a best estimate of 2.7 °C.
These global constrained projections can also be used to develop consistent regional warming levels. For instance, the French reference trajectory for adaptation is based on the best estimate of the climate response to this intermediate emissions scenario, assuming a level of global warming of 2 °C by 2050 and 3 °C by 2100, and then applying similar constrained projections methodologies to translate a time horizon and level of global warming to the corresponding level of warming in mainland France (Corre et al., 2025; Ribes, Boé, et al., 2022). The reference trajectory also assumes climate stabilization at 3 °C by 2100, while net zero CO2 emissions are not expected to be reached by that time horizon from intermediate or current policies scenarios (UNEP, 2024). Such differences have implications for long-term sea-level projections consistent with different future climate scenarios.
Going back to the global scale, the assessment of the Earth system response has also been used to develop simplified climate models, or emulators (Nicholls et al., 2022). These emulators have been used to classify more than 1200 modelled emissions pathways into 8 categories (Kikstra et al., 2022) as a function of the resulting level of global warming, and to distinguish the trajectories allowing to limit global warming to 1.5 °C (with 50% probability), without overshoot (as in SSP1-1.9) or with a limited (<0.1 °C) or high (0.1 °C to 0.3 °C) overshoot, the trajectories allowing to limit global warming well below 2 °C (with 67% probability, as in SSP1-2.6 or 50% probability), below 2.5 °C or 3 °C (as in SSP2-4.5) or 4 °C with >50% probability (as in SSP3-7.0), or to exceed 4 °C by 2100 with >50% probability (as in SSP5-8.5) (Figure 1). These approaches allow to describe what are the characteristics of mitigation pathways consistent with specific warming levels, for instance in terms of phasing out fossil fuels consistent with limiting global warming to different levels (Achakulwisut et al., 2023).
For consistency, emulators consistent with constrained global surface temperature projections have been used for future projections of ocean heat content, glaciers and ice sheet contributions to sea-level rise, based on ice sheet processes associated with at least medium confidence (Figure 3, colored lines in the sea-level projection panel). As a result, global mean sea-level projections are consistent with global surface temperature projections, also allowing to relate global warming levels to future sea-level rise over the time scales of centuries to millennia. The consistency between insights from modelling and from paleoclimate evidence from past warm periods and high stands of global mean sea level provide confidence in the outcome (IPCC, 2021).
Recent studies have identified deficiencies in state-of-the-art simple climate models for the replication of physical mechanisms linking ocean heat and carbon uptake. Future work is thus needed to improve the geophysical consistency between models used in the scenario generation process and assessment (Sanderson et al., 2023; Séférian et al., 2024).
For many climatic impact-drivers, their characteristics and spatial patterns directly depend on the level of global warming, independently of the timing when this level of warming is reached, and of the emissions and land use pathway leading to that level of warming. As a result, the level of global warming is used as a dimension of integration between mitigation pathways and climate-related risks. The interactions between resulting hazards, exposure and vulnerabilities of human activities and societies, species and ecosystems, lead to climate-related risks. The assessment of regional and sectoral risks is conducted within five broad risk typologies, assessed as a function of global warming levels, and, where relevant, socio-economic scenarios (Figure 3). Mitigation and maladaptive responses can indeed also drive negative effects. For instance, land-based mitigation can exacerbate risks to land rights, water and food security, ecosystems and biodiversity (IPCC, 2023; IPCC, 2019).
Risks and projected adverse impacts and related losses and damages escalate with every increment of global warming (Figure 3). For many climate-related risks, they are assessed in the IPCC AR6 to be higher for any future global warming level than assessed in the IPCC AR5. While future changes in slow components in the climate system are unavoidable, due to their adjustment times, they can be limited by limiting future warming and thus by deep, rapid and sustained reductions in greenhouse gas emissions (IPCC, 2023).
Current mitigation efforts are insufficient to respect the Paris Agreement long-term temperature goal, limiting global warming well below 2 °C with the aspiration to limit global warming to 1.5 °C. As a result, the risk assessment also encompasses the possibility of exceeding a level of global warming, and then returning below that level of global warming through assuming the ability to reach and maintain net negative CO2 emissions (so-called “overshoot” scenarios) (Figure 1).
The plausibility of overshoot scenarios depends on the plausibility of upscaling carbon dioxide removal, with uncertainties on technologies, political and public support, business models, sustainability and equity considerations, and uncertainties associated with permanence and feedbacks (ibid.). Any mitigation delay and associated emissions leads to a higher level of peak warming, and every increment of additional peak warming leads to increased impacts with no expectation of immediate reversibility after overshoot (S.-K. Kim et al., 2022), such as continuous warming of the Southern Ocean, changes in the deep ocean, ocean and land ecosystems and biodiversity, and leads to an additional long-term sea-level commitment. A few studies indicate distinct regional climate characteristics following overshoot compared to stabilization scenarios. Long-term reversibility of climatic impact-drivers after overshoot furthermore has limited relevance for adaptation decision-making spanning the next 50 years. Finally, uncertainties resulting from uncertain climate and carbon cycle feedbacks triggered by peak warming may challenge the ability to stabilize future warming, calling for sustainable carbon dioxide removal capacity to hedge against high warming outcomes (Schleussner et al., 2024).
3.3. Deep uncertainty, storylines and low-likelihood, high-impact eventualities
The current rise in atmospheric CO2 level, mostly resulting from the combustion of fossil fuels, is unprecedented in up to 16 million years (CenCO2PIP et al., 2023). The resulting climate heating is driving the emergence of novel climate conditions, unprecedented in terms of pace and magnitude over centuries to millennia (IPCC, 2021; Osman et al., 2021), and, combined with human pressures on ecosystems and biodiversity (IPBES, 2019), the degradation of ecosystems and loss of biodiversity and nature’s contributions to people (IPCC, 2022a). As described above, future climate scenarios are associated with various types of uncertainties, both in terms of socio-economic drivers and changes, in terms of Earth system responses, and in terms of complex risks, and systems transformations, with the potential for surprises. IPCC assessment reports use risk frameworks to explore uncertainties, and have developed a calibrated language to report confidence in future projections, quantitatively (ranges of outcomes), and qualitatively.
Information on uncertainty is critical to inform risk management, and robust decision-making under uncertainty. The latter framework embraces the ideas that science-based analysis should “seek to facilitate human creativity, deliberation and judgement in solving complex problems rather than aspire to proscribe the best decisions”, and “science can help decision-makers manage deep uncertainty, not just reduce it” (Lempert et al., 2024).
Regarding future climate scenarios, the IPCC AR6 has explicitly expanded its guidance for the degrees of certainty to encompass deep uncertainty, with the following definition: “A situation of deep uncertainty exists when experts or stakeholders do not know or cannot agree on: (1) appropriate conceptual models that describe relationships among key driving forces in a system; (2) the probability distributions used to represent uncertainty about key variables and parameters; and/or (3) how to weigh and value desirable alternative outcomes”.
Two framing concepts related to deep uncertainty have been developed in climate science literature, and are thus reflected in IPCC (2021), physical climate storylines, and low-likelihood, high-impact outcomes.
Physical climate storylines provide self-consistent narratives, without a quantified probability of occurrence, of possible unfolding of a physical trajectory of the climate system. In IPCC (ibid.), this concept was used for the exploration of low-likelihood, high impact events, or cross-scale interactions for informing adaptation; to put historical events in the context of a changing climate and as an alternative approach to event attribution studies; and within climate services, as providing climate information integrated with socio-economic information. An overview of recent developments highlights the variety of approaches associated with this concept, and the causal chain that they explore, the type of evidence used, and how they incorporate value judgements (Baldissera Pacchetti et al., 2024). These storylines play a key role in the links between climate science and decision-making (Sillmann et al., 2024), but have not yet been explicitly incorporated within the French national adaptation strategy.
Low-likelihood, high impact outcomes are defined as “Outcomes/events whose probability of occurrence is low or not well known (as in the context of deep uncertainty) but whose potential impacts on society and ecosystems could be high. To better inform risk assessment and decision-making, such low-likelihood outcomes are considered if they are associated with very large consequences and may therefore constitute material risks, even though those consequences do not necessarily represent the most likely outcome” (IPCC, 2021).
Compound and current extremes contribute to the increasing probability of low-likelihood, high-impact outcomes, and will be more frequent with increasing global warming levels, which also increase the likelihood of events unprecedented in the observational record of a given region, giving a misleading perception of “surprise” as assessed in Box 11.2, in IPCC (ibid.). For instance, the occurrence of extreme heat reaching 50 °C in Paris is estimated to be implausible under the current climate, but is possible, as a very rare event, in a 2 °C warmer world (Yiou et al., 2024).
Low-likelihood, high-warming storylines describes future global warming exceeding the assessed very likely range, for a given emissions scenarios, for instance based on models with large climate sensitivities (not shown in Figure 1 for scenarios and projections). This has for instance implications for the timing when specific levels of global warming are reached and is described in Box TS.3 in IPCC (2021).
Another example of a low-likelihood, high-impact storyline refers to the possibility, consistent with paleoclimate evidence, of experience several large volcanic eruptions, which would alter the multi-decadal climate trajectory compared to scenario-based projections, as assessed in Cross-Chapter Box 4.1 in IPCC (ibid.). There is a lack of inclusion of such storylines in risk management and adaptation strategies worldwide, which only focus on human drivers of future climate change; such eventualities would have major implications for e.g. food security.
Low-likelihood, high-impact storylines have also been used to describe what would be the consequences of abrupt changes in components of the climate system. There is medium confidence that the projected decline in the Atlantic Meridional Overturning Circulation will not lead to an abrupt collapse before 2100, but such a collapse might be triggered by unexpected meltwater inflow from the Greenland ice sheet. The storyline approach allows to describe, if such a collapse were to occur, the state of knowledge on its consequences for regional changes in hydroclimate, as described in Box TS.3 in IPCC (ibid.).
Likely range sea-level rise projections (Figure 4) do not include ice-sheet processes characterized by low confidence and deep uncertainty. Higher magnitudes of sea-level rise could be driven by earlier-than-projected disintegration of marine ice shelves, the onset of uncertain ice sheet instability processes in Antarctic ice sheet sectors, or faster-than-projected melt and ice flow from the Greenland ice sheet. In the IPCC AR6, a low-likelihood, high-impact storyline was developed for the very high CO2 emissions scenario, and this worse case outcome was explicitly communicated together with sea-level projections (Figure 3, dashed line) (Kopp et al., 2023). Further research has focused on high-end sea-level rise as a function of the scenarios and time frame (Stammer, van de Wal, et al., 2019), for the purpose of informing practitioners and for stress tests in risk-intolerant contexts (van de Wal et al., 2022). Such high-end storylines, which are relevant for coastal adaptation pathways and their limits, have been incorporated in national sea-level information, for instance in the USA (Kopp et al., 2023) and the UK (Palmer et al., 2024), but are not included in the current approach to sea-level information in the French context, which is raised as a concern for potential maladaptation (Le Cozannet and Cazenave, 2024).
Subset of assessed climate outcomes and associated global and regional climate risks. The burning embers result from a literature-based expert elicitation. (a) Left—Global surface temperature changes in °C relative to 1850–1900. These changes were obtained by combining CMIP6 model simulations with observational constraints based on past simulated warming, as well as an updated assessment of equilibrium climate sensitivity. Very likely ranges are shown for the low and high GHG emissions scenarios (SSP1-2.6 and SSP3-7.0) as in Figure 1. Right—Global Reasons for Concern (RFC), comparing AR6 (thick embers) and AR5 (thin embers) assessments. Risk transitions have generally shifted towards lower temperatures with updated scientific understanding. Diagrams are shown for each RFC, assuming low to no adaptation. Lines connect the midpoints of the transitions from moderate to high risk across AR5 and AR6. (b) Selected global risks for land and ocean ecosystems, illustrating the general increase in risk with global warming levels with low to no adaptation. (c) Left—Global mean sea level change in centimetres, relative to 1900. The historical changes (black) are observed by tide gauges before 1992 and altimeters afterwards. The future changes to 2100 (coloured lines and shading) are assessed consistently with observational constraints based on the emulation of CMIP, ice sheet, and glacier models, and likely ranges are shown for SSP1-2.6 and SSP3-7.0. Right—Assessment of the combined risk of coastal flooding, erosion and salinization for four illustrative coastal geographies in 2100, due to changing mean and extreme sea levels, under two response scenarios, with respect to the baseline period 1986–2005. The assessment does not account for changes in extreme sea level beyond those directly induced by mean sea level rise; risk levels could increase if other changes in extreme sea levels were considered (e.g., due to changes in cyclone intensity). “No-to-moderate response” describes efforts as of today (i.e., no further significant action or new types of actions). “Maximum potential response” represent a combination of responses implemented to their full extent and thus significant additional efforts compared to today, assuming minimal financial, social and political barriers. (In this context, “today” refers to 2019.) The assessment criteria include exposure and vulnerability, coastal hazards, in situ responses and planned relocation. Planned relocation refers to managed retreat or resettlements. The term response is used here instead of adaptation because some responses, such as retreat, may or may not be considered to be adaptation. (d) Selected risks under different socio-economic pathways, illustrating how development strategies and challenges to adaptation influence risk. Left—Heat-sensitive human health outcomes under three scenarios of adaptation effectiveness. The diagrams are truncated at the nearest whole °C within the range of temperature change in 2100 under three SSP scenarios. Right—Risks associated with food security due to climate change and patterns of socio-economic development. Risks to food security include availability and access to food, including population at risk of hunger, food price increases and increases in disability-adjusted life years attributable to childhood underweight. Risks are assessed for two contrasted socio-economic pathways (SSP1 and SSP3) excluding the effects of targeted mitigation and adaptation policies. Replicated from the Summary for Policy Makers of (IPCC, 2023).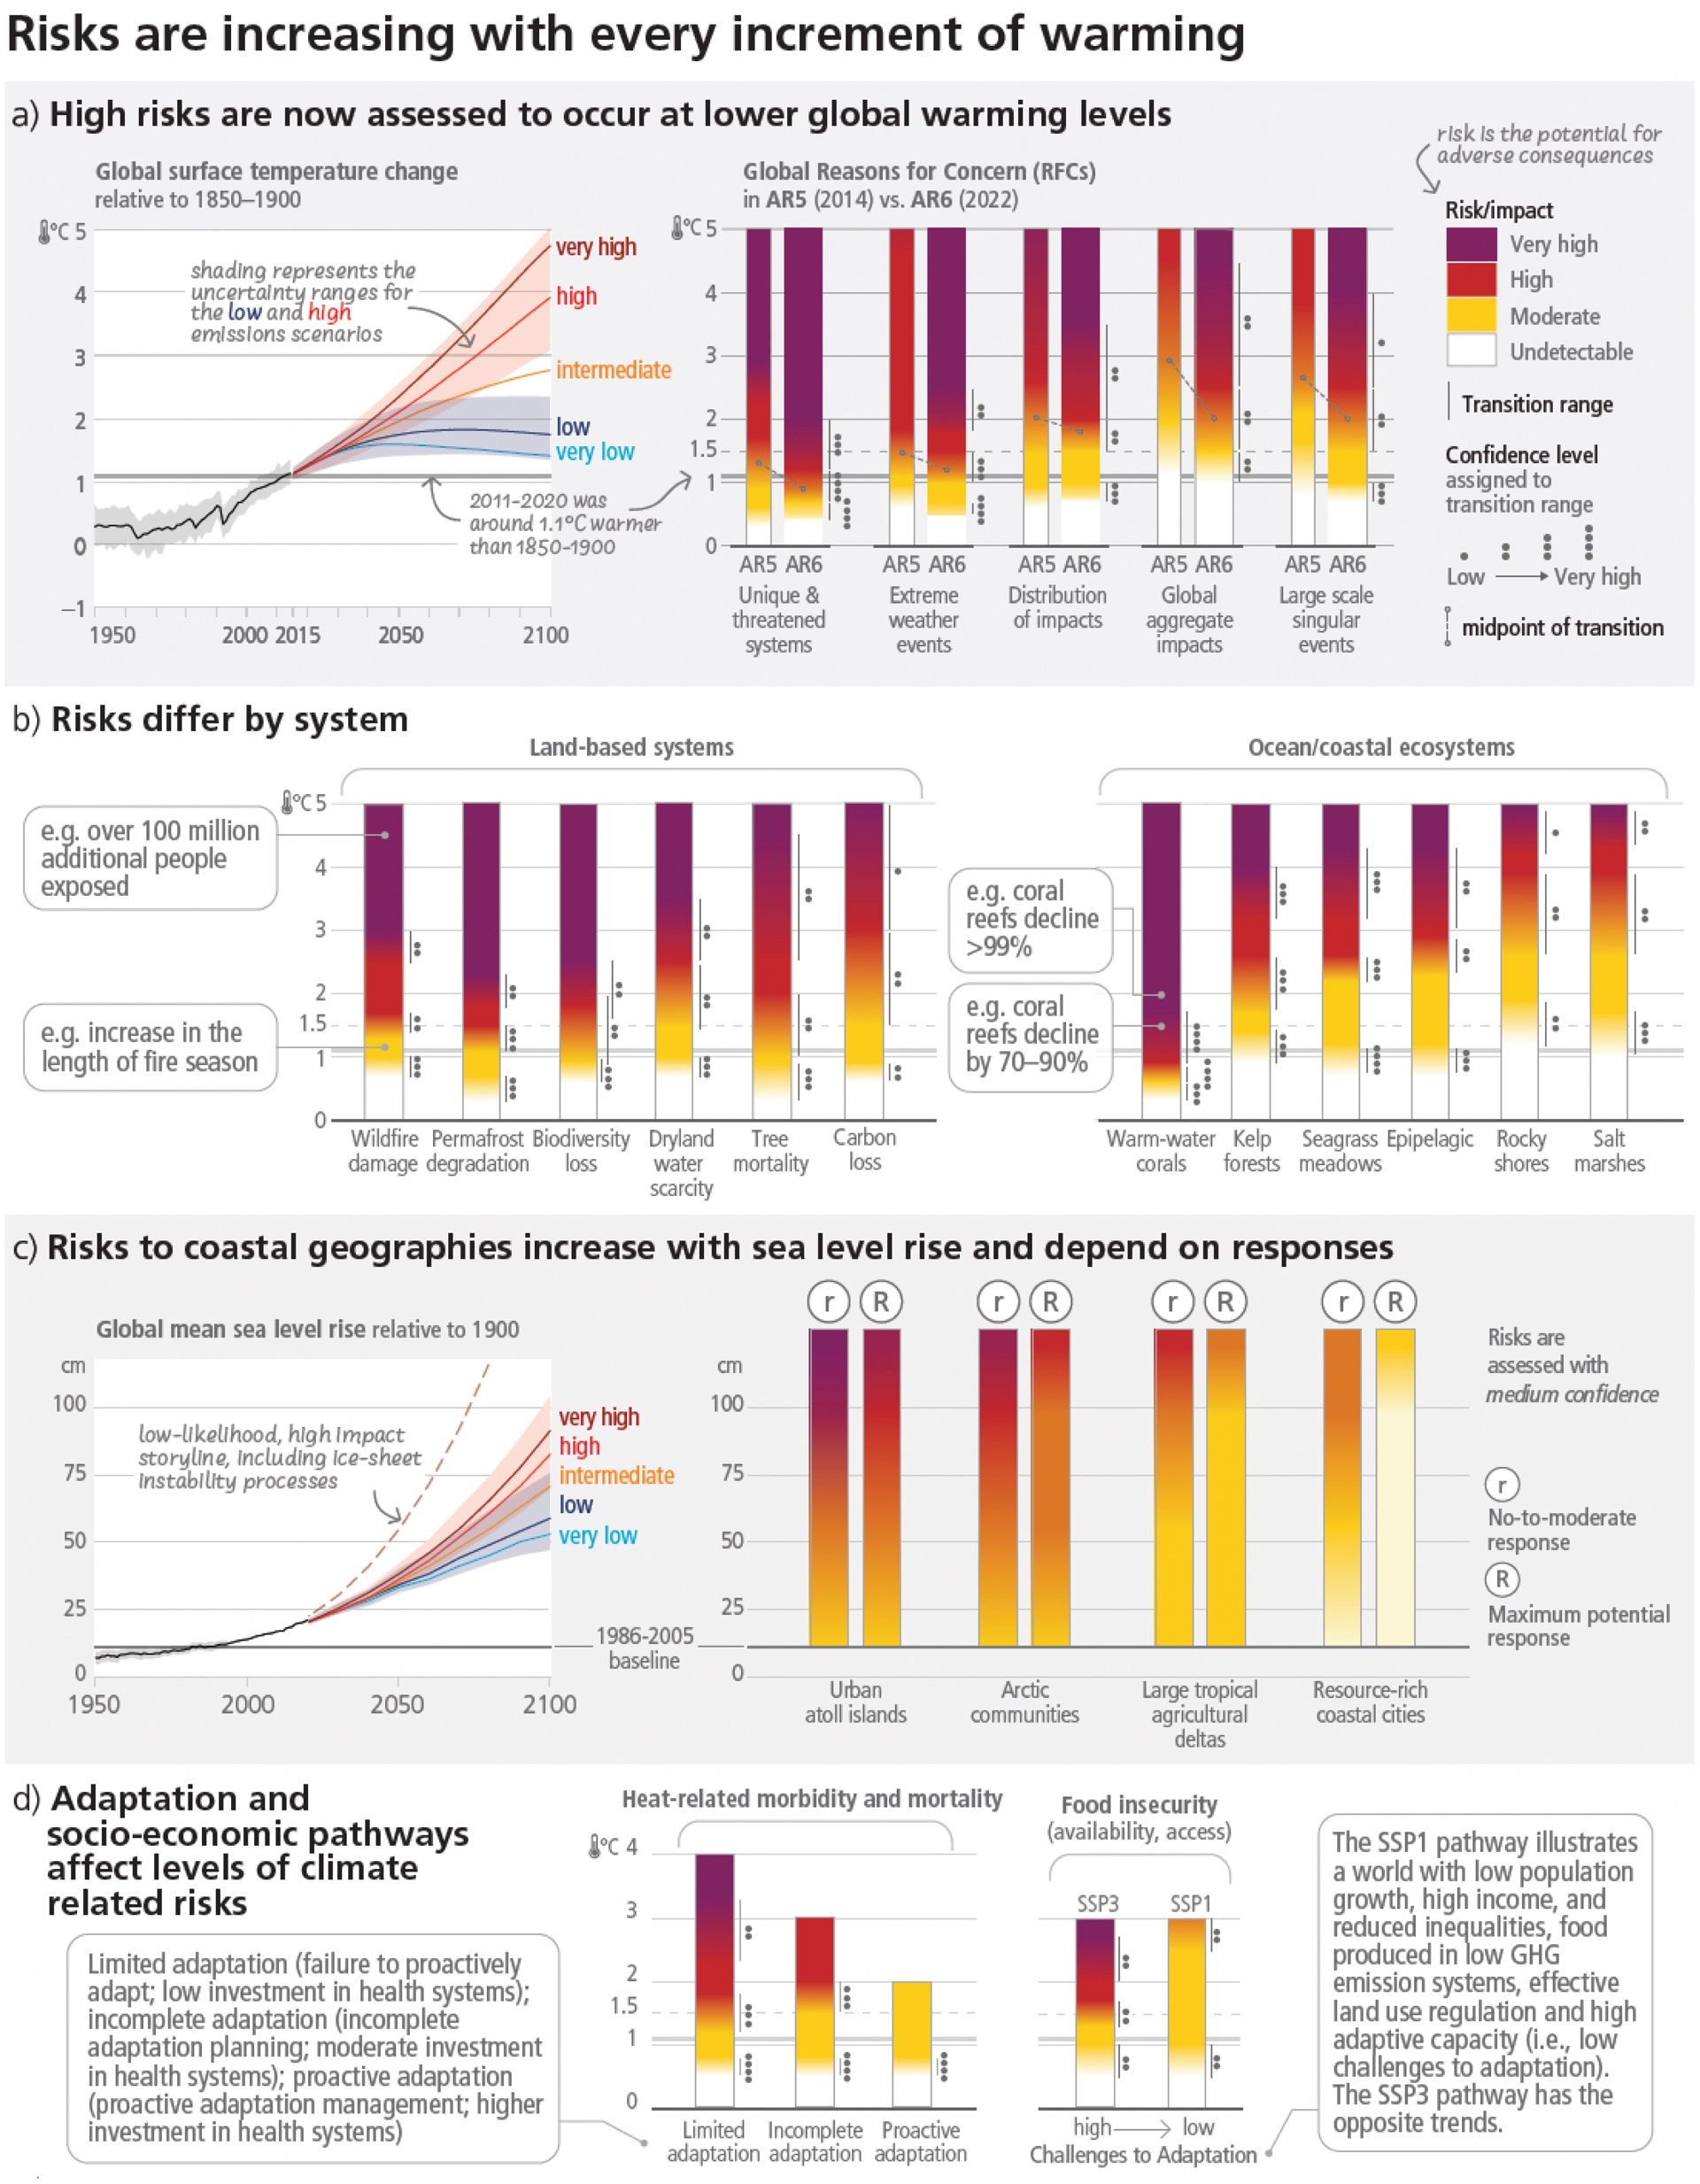
Other areas of deep uncertainty are associated with the Antarctic sea-ice, and with carbon cycle feedbacks. No specific storyline was developed within the IPCC AR6, but carbon cycle feedback processes where explicitly mentioned as a qualitative source of uncertainty for the ability to return following a period of overshoot: “Adverse impacts that occur during this period of overshoot and cause additional warming via feedback mechanisms, such as increased wildfires, mass mortality of trees, drying of peatlands, and permafrost thawing, weakening natural land carbon sinks and increasing releases of greenhouse gases would make the return more challenging”. Recently, a storyline approach combining narratives and scenarios was developed to explore future CO2 and methane emissions resulting from permafrost thaw (Schuur et al., 2022), showing that a sole focus on country-level emissions without accounting for Arctic carbon feedbacks is not likely to be enough to limit future warming.
Concerns about the loss of efficiency of natural carbon sinks have recently been enhanced by increased tree mortality, ecosystem degradation and large-scale wildfires (Friedlingstein et al., 2025), as well as the recent intensification of wetland methane feedback (Zhang et al., 2023), processes which are not fully incorporated into Earth system models. The ocean and land carbon responses to both CO2 and climate change are a major source of uncertainty for understanding the full Earth system long-term response to zero CO2 emissions, and could result in additional amounts of warming, challenging the plausibility of overshoot scenarios (Palazzo Corner et al., 2023), and the ability to limit future global warming without a carbon removal capacity suitable for buffering potential carbon cycle feedbacks (Schleussner et al., 2024). It has thus been argued that carbon-climate interactions and feedbacks are central to how the Earth system will evolve in the future, and should be central to future projections. This calls for carbon emissions and land-activity-driven simulations to be central to future climate scenarios, instead of concentration-driven simulations (Sanderson et al., 2023).
This brief overview highlights the importance of physical climate storylines to high-impact eventualities and tail risks, in addition to the best estimates and most likely climate futures and in complement of probabilistic estimates of occurrences of events and to inform robust decision-making (Lempert et al., 2024). Such storylines are important for instance for climate proofing of risk-averse infrastructure, for climate stress tests of critical infrastructure, and for cascading risk management strategies. Storyline information is not (yet) included in French adaptation strategies, possibly for fear of over-adaptation (over-investments in adaptation), a point explicitly mentioned in the National Adaptation strategy (PNACC3). However, there is a growing interest in such information to inform long-term strategic planning for energy, health and telecommunication infrastructure, calling for credible and reliable information on potential high-impact scenarios and storylines, as developed for the UK (Palmer et al., 2024; Arnell et al., 2025).
4. Final remarks on advances on future climate scenarios
As summarized in this overview, scenarios support scientific assessments of climate-related risks and the synthesis of climate change information. Scenarios, referring to the combination of climate, socio-economic and policy pathways within a coherent and internally consistent plausible future, advance the understanding of how different socio-economic choices lead to different outcomes and risks, and inform society in general, and climate policies. They need to be complemented by information on low-likelihood, high-impact outcomes to inform robust decision-making under uncertainty.
Given the fast pace of human-induced climate change, and the escalation of climate-driven impacts, the new frontier for the development of socio-economic narratives requires to explicitly account for human-caused climate change impacts and risks (Pirani et al., 2024), equity (Kanitkar et al., 2024), with new challenges for a climate research agenda grounded in ethics (Masson-Delmotte, 2024). Other challenges include better representation of economic and social dynamics such as market frictions, financial flows, as well as the inclusion of new technologies, notably information technologies.
Supporting in situ and remove observational networks is a cornerstone for all aspects of advancing climate science and for the provision of reliable, actionable information for society (Stammer and Cleugh, 2025; Thierry et al., 2025). Within a vision of climate science for 2050 (Brasseur et al., 2025), advances in the understanding of Earth system responses at global and regional scales, based on advances in model developments (C. G. Jones et al., 2024), very high resolution (kilometer scale, convection permitting) modelling (Fosser et al., 2024), theory (Byrne et al., 2024), as well as new methodologies (Eyring, Collins, et al., 2024) to build reliable climate information and constrain uncertainties (Douville, 2025) are needed, in particular for dynamical and hydroclimatic climate phenomena.
The narrow set of five SSP narrative, which is a compromise between a limited number of narratives for communication purposes, and exploring a range of possible futures, does not incorporate scenarios with a strong emphasis on sufficiency, post-growth perspectives (Hickel et al., 2021), or social equity and justice (Zimm et al., 2024). Specific developments in all these aspects are currently underway.
Scenarios assessed in the IPCC AR6 encompass a very high emissions scenario, challenged for its plausibility. However, exploring Earth system modelled responses to very high forcings and providing high signal to noise experiments is useful, and can be achieved from sensitivity studies or idealized simulations.
New scenario designs (Meinshausen et al., 2024) are needed to explore the potential climate outcome of current climate policy targets; the worse-case outcomes for current policy scenarios in terms of high-end climate sensitivity and carbon cycle feedbacks; what climate impacts can still be avoided; what are the different feasible mitigation strategies implied by the Paris Agreement temperature goals and the interlinkages of related climate action with a broader sustainability agenda; what are the consequences of delayed mitigation; what are the climate effects of different regional emissions and land use changes; what are the effects of non-CO2 mitigation; what are the risks and effectiveness of land-based carbon dioxide removal; and to what extent are climate change and the impacts of climate change time-dependent and reversible. Very high and very low emissions scenarios remain useful as benchmarks for “the world that could have been” if mitigation efforts had not existed or had been very stringent. The extension of scenarios over time is also important to explore the long-term implications, well beyond 2100. These approaches support the design of ScenarioMIP-CMIP7 (van Vuuren et al., 2026).
The biodiversity perspective is particularly important to strengthen, as no SSP scenario, including sustainability-oriented SSP1, allows to meet biodiversity targets, as highlighted in Table 18.1 of IPCC (2022a). Given the close interplays between climate change, food and energy systems, water, health and well-being, and the erosion of biodiversity and loss of ecosystem functions and nature’s contributions to people, new scenario approaches are also needed to inform response options which account for nexus interactions and support transformative changes (IPBES, 2025; MedECC, 2024).
In the context of escalating climate change impacts, it is increasingly relevant to reverse the causal chain, and focus on the end-user perspective. Starting with adaptation limits and thresholds of manageable or tolerable risks, for instance related to tolerable heat for health, fire weather for forestry, or glacier mass loss for water resources, in specific regions, can then be the starting point to infer compatible emissions and land use pathways, strengthening support for ambitious mitigation (Pfleiderer et al., 2025).
Declaration of interests
The author does not work for, advise, own shares in, or receive funds from any organization that could benefit from this article, and has declared no affiliations other than their research organization.
Financements
For the IPCC Sixth Assessment Cycle, the technical support unit of the IPCC Working Group I (of which the author was co-chair) was funded by the French government through Ministries of Research, Foreign Affairs and Ecological Transtion (through ADEME).
1 The Hadley circulation describes a direct, thermally driven overturning cell in the atmosphere consisting of poleward flow in the upper troposphere, subsiding air into the subtropical anticyclones, return flow as part of the trade winds near the surface, and with rising air near the equator in the so-called Inter-tropical Convergence Zone (definition from the IPCC Glossary, available at https://apps.ipcc.ch/glossary/).