


 CC-BY 4.0
1. Introduction
Knowledge on past earthquakes still needs to be improved. The reliability of historical earthquake characterization depends on both the number and the quality of archive documents (parish registers, press clipping …) coming from different geographical locations where the earthquakes have been felt. Such information on historical seismicity is stored in dedicated macroseismic databases like SisFrance [see Lambert et al. 2015, for more details].
Due to the nature of the historical sources used for the construction of the database, the uncertainties related to the evaluation of the intensity levels and their locations can be very large. In SisFrance database, epicentral intensities and locations are associated to quality factors that reflect the confidence in the numerical values deduced from the historical sources and testimonies. In some cases, the observations simply allow to deduce that the event was felt at a site but information is not sufficient to assign an intensity.
The models used to describe the relation between the macroseismic intensity, magnitude, and distance from the epicenter or hypocenter introduce further uncertainty [see Baumont et al. 2018; Traversa et al. 2018]. These parameters are then used in the seismicity models to assess the seismic hazard both in deterministic and probabilistic studies. In consequence, gathering the maximum amount of information on past earthquakes is crucial to get a robust estimate of the epicentral intensity and location, and eventually to give an estimate of the magnitude.
In the present paper, a Bayesian approach is applied to update the magnitudes assigned to historical earthquakes by means of observed damages and fragility characteristics of buildings and structures that have withstood the earthquake. The idea is to introduce new information such as the absence of damage, low damage, or repair of buildings and structures still existing today. Then the magnitude assigned to a historical earthquake can be updated by analyzing the consistency of the currently considered magnitude with the damage state of the structures that have experienced the historical earthquake.
Our methodology is based on the work of Ryu et al. [2009]. The approach developed here is particularly useful to assess the magnitude assigned to past earthquakes in low-seismicity regions. On the one hand, the uncertainty related to the assigned macroseismic intensities and the magnitudes deduced from this quantity can be very high. On the other hand, the resulting damage is rather small or no damage is observed. The approach allows for using such information on the absence of damage. Indeed, buildings with no damage provide a constraint on magnitude upper bound.
The use of information on structural damage combined with numerical analyses has been investigated by a couple of authors. For example, in Stirling et al. [2020] and in Benjelloun et al. [2021] the existence of fragile geological structures is exploited. However, the studies focus on qualitative comparisons; updating of initial magnitudes or intensities is not performed.
This paper is organized as follows. We first give an overview of the approach by introducing the relevant equations for updating the magnitudes of historical earthquakes. We then provide a description of the building database and show how the detailed and generic fragility curves that are required for the analysis of large building stocks are computed. For the purpose of illustration, the methodology is finally applied to the historical earthquake of La-Tour-du-Pin in France that has occurred on February 18th 1889.
2. Bayesian updating of magnitudes of historical earthquakes
2.1. Methodology
Updating of the initial probability distribution of magnitude of a historical earthquake is carried out in a Bayesian framework. This requires the knowledge of the damage state D of buildings. The initial or prior distribution of the magnitude is defined by the best estimate and the associated uncertainty of the historical magnitude given in the earthquake catalogue. Here, the data from FCAT catalogue [see Manchuel et al. 2018] is used. The posterior magnitude f(m|D) is then computed by updating the prior magnitude distribution fM(m) according to the Bayes theorem:
| (1) |
| (2) |
A large number of data can be obtained from in situ investigations. A first challenge in the methodology is the integration of the available data in a common framework in order to quantify the probability P(D|m). Different damage states are observed for different structural typologies and according to different seismic intensity measures. For the sake of simplicity and to save computational time, updating is restricted to a single IM. The choice of this IM is discussed in Section 3. For a given typology i with
| (3) |
Finally, the global probability of damage observations P(D|IM,m,r,s) is computed according to (4) to integrate all the available data.
| (4) |
2.2. Building damage database
Existing structures and buildings that have experienced the earthquake under consideration provide useful testimonies about the past event. Data regarding the impact of the earthquake on the structural state needs to be collected and analyzed. This type of information is generally collected by archeoseismologists from in situ and archive investigations [e.g. Poursoulis 2017; Benjelloun et al. 2021]. This new information is used to perform the Bayesian updating of the magnitude assigned to a historical earthquake.
Indeed, particular cracks or traces of repair work can be recorded of a past earthquake [Colombi et al. 2008]. In order to select structures that may have encountered a relatively large seismic load, a criterion of selection is considered. This criterion evaluates if the approximated fundamental period of the structure falls into the period range of maximum pseudo-acceleration obtained from regulatory spectral acceleration [CEN 2005] for the area of interest. According to the typology considered for old masonry structures, different formula extracted from the literature are considered. For the fundamental period estimation of simple regular masonry buildings, the formula from EC8 [CEN 2005] is used:
| (5) |
As regards churches in particular, the estimation of the fundamental period for bell towers is extracted from database using ambient vibration measurements [Limoge-Schraen et al. 2016; Michel et al. 2008]. An additional estimation of the main fundamental period along the transversal direction of a church can be obtained according to the work of Lopez et al. [2019]:
| (6) |
| (7) |
Figure 1 illustrates the correspondence between the period range of the fundamental periods of the structures in the database and the plateau of the spectral acceleration for soil classes B (red curve) and C (yellow curve) [CEN 2005].
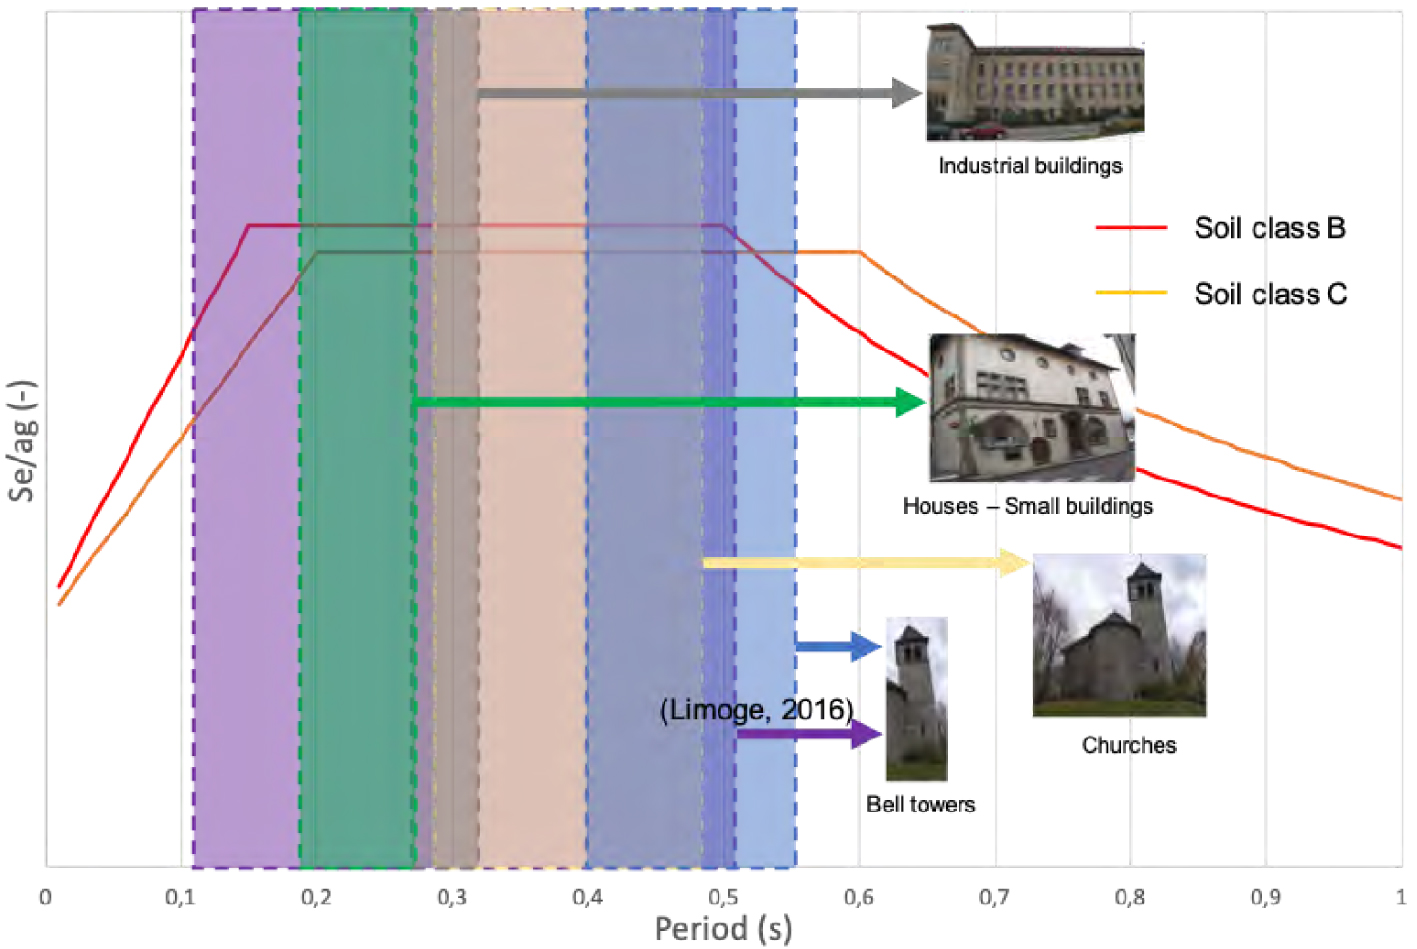
Comparison between the fundamental period of buildings and the period range of the regulatory spectral acceleration Se normalized by the peak ground acceleration ag.
In order to analyze its damage state, the vulnerability of each structure is defined by its probability of damage P(D|IM). For a first approximation of the vulnerability of the structures, global fragility curves for small masonry buildings like the ones proposed in Pitilakis et al. [2014] can be used. For specific building typologies or for complex buildings, dedicated numerical strategies can be used. For earthquakes with a “small” magnitude, the damage induced on structures is limited. More particularly, for old masonry buildings, macrocracks tend to be limited with no activation of failure mechanism. As a consequence, a numerical simulation strategy considering continuous modeling can be used for specific buildings that may not be covered by previous studies [for example, Limoge-Schraen et al. 2016; Stocchi et al. 2019, 2021]. This is described in more detail in the following section.
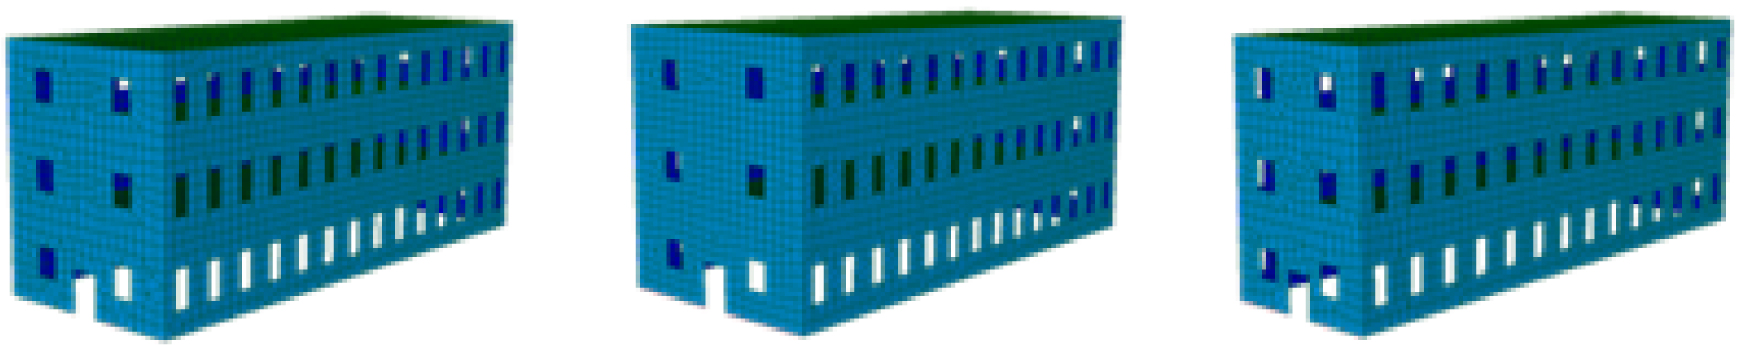
Illustration of the generation of different building samples in the same typology.
Fragility curves—log-normal distribution model
| Damage state → typology | D1 | D2 | D3 | |||
|---|---|---|---|---|---|---|
| IMD0 | 𝛽 | IMD1 | 𝛽 | IMD2 | 𝛽 | |
| Industrial buildings [Stocchi et al. 2021] | 0.23 | 0.38 | 0.43 | 0.4 | ||
| URM2-L [Pitilakis et al. 2014] | 0.057 | 0.52 | 0.105 | 0.53 | 0.166 | 0.54 |
| URM2-M [Pitilakis et al. 2014] | 0.026 | 0.475 | 0.051 | 0.4 | 0.140 | 0.43 |
| Churches [Cescatti et al. 2020] | 0.014 | 1.79 | 0.23 | 0.91 | 0.364 | 0.63 |
2.3. Vulnerability analysis of old structures
The probability of damage for the buildings is evaluated considering the Peak Ground Acceleration (PGA) as an intensity measure. With this choice, the historical structures that can be considered are restricted to the ones for which the relevant damage indicator is compatible with the PGA, such as the houses or churches. For instance, the damage or failure mechanisms (rocking, overturning,…) of rocking block systems like stones or statues tend to be correlated to different parameters and not only the PGA [see for instance Giouvanidis and Dimitrakopoulous 2018]. This is why such structures will not be considered in the following analyses but could be considered separately in further studies. Here, the log-normal distribution is used to define the fragility functions:
| (8) |
In order to derive fragility curves for old masonry buildings in a given typology, Stocchi et al. [2021] have proposed a simplified modeling strategy based on the time history analysis of representative nonlinear single degree of freedom systems (SDOF) associated to the structural modes. The parameters of the nonlinear SDOF model are obtained thanks to an identification process using the response of a pushover analysis on a 3D model of the structure.
In order to take into account the structural variability within a same typology related to material parameters and to the geometry, a large set of 3D models is considered (see Figure 2 for models generated in the same typology). Thanks to a pushover analysis, the associated nonlinear SDOF systems are identified. The nonlinearity of the mode is considered in the SDOF system with a damage variable that can be directly linked to an eigenfrequency drop off (EFDO). This indicator tends to be correlated to the overall capacity of the structure according to a study of Michel et al. [2011] on the damage evolution of masonry structures.
For structure typologies with no direct derivation of fragility curves using the method proposed in Stocchi et al. [2021], damage probability curves from the literature are used. The ones given in Pitilakis et al. [2014], based on numerical modeling using macroelements models, are considered for small masonry buildings. The ones given in Cescatti et al. [2020] are used for churches. The curves were obtained from analyses of collected data after earthquake events (Cescatti et al. [2020] have used 2016–2017 earthquakes in central Italy). Table 1 gives the parameters for the different typologies considered. These values are either obtained with the method of Stocchi et al. [2021] for industrial buildings or from literature for houses (URM2-L and URM2-M in Pitilakis et al. [2014]) and churches [Cescatti et al. 2020].
3. La-Tour-du-Pin case study
In order to illustrate the methodology, the historical earthquake of La-Tour-du-Pin in France that occurred on 18th February 1889 is analyzed. The specificity of this study is linked to the fact that this earthquake has a moderate estimated magnitude Mw = 4.4 with a large uncertainty errMw = 0.42 [Manchuel et al. 2018]. This large uncertainty is due to the fact that the intensity data points assigned to this earthquake in the 2014 SisFrance database are based on only very few testimonies. The macroseismic intensities in the database are evaluated with the Medvedev–Sponheuer–Karnik intensity scale [Medvedev and Sponheuer 1969]. The macroseismic intensity provides an empirical appraisal of the effects of an earthquake based on observed damage. The Intensity Data Points (IDP) represent earthquake effects in terms of damages and population at different locations. They are determined from the historical archives for each event. The epicentral location is determined and provided, together with the epicentral intensity value when possible. More details on the location and intensity assessment are provided in Lambert et al. [2015].
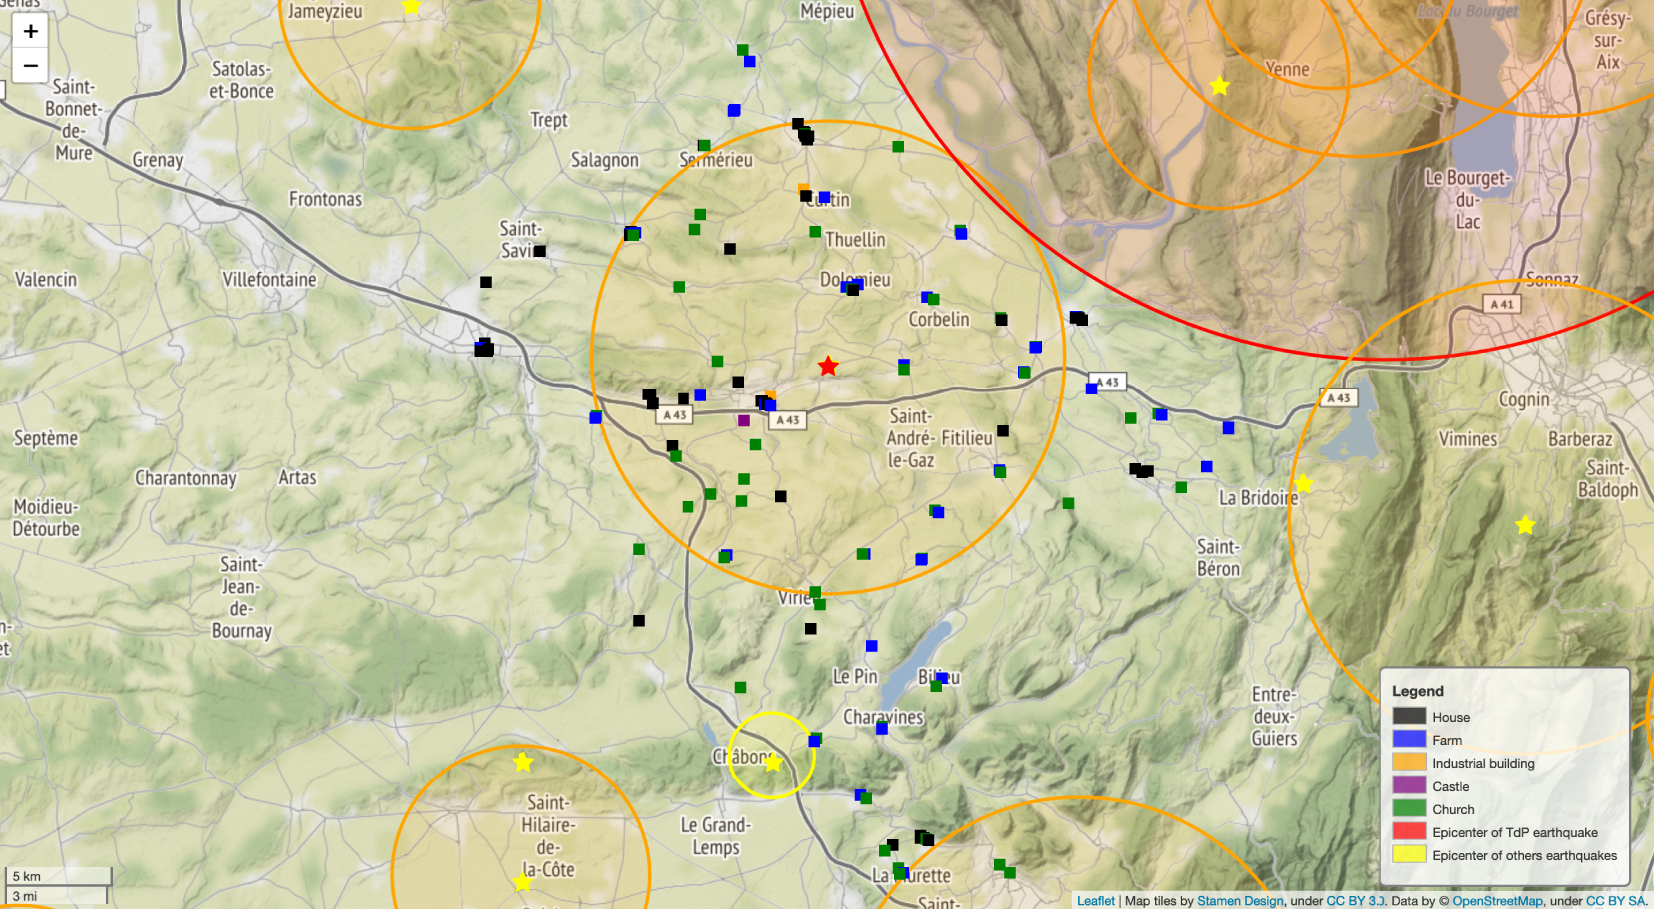
Distribution of the buildings inspected (square dots) and area of influence for historical earthquake (Intensity MSK ⩾ V) according to the attenuation model from Arroucau et al. [2006] (color of the circle according to MSK epicentral intensity I0: yellow (V–VI), orange (VI–VII), and red (VII–VIII)). Red star: epicenter location of La-Tour-du-Pin 1889 earthquake. Yellow star: epicenter location for other earthquakes.
3.1. Construction of the building database
The building database is established with the following criteria: maximum epicentral distance, age of the structure (i.e., pre-earthquake construction date), typology, and associated potential vulnerability. The first two criteria allow to restrict the study to buildings that may have been affected by the earthquake of La-Tour-du-Pin. The last criterion is used to limit the data to buildings that could have suffered damage according to the magnitude assigned in Manchuel et al. [2018]. Indeed, buildings with a large median capacity do not carry much information for updating small magnitudes.
In order to cover the epicentral region where structures may have been damaged by the historical earthquake, a set of seventy-three cities was considered for a database of building damages [Poursoulis 2017].
According to the SisFrance database, the region has experienced several historical earthquakes. This means that one particular building or structure may have experienced more than one event. The historical earthquakes that have induced observable testimonies and potential effect on structures (Intensity MSK ⩾ V) according to SisFrance are listed in Table 2. The occurrence of several earthquakes affecting the same structure may affect the damage state; in other words, the testimonies of damage observed today may be caused by another event than the one considered here.
In order to be sure that observed damage is due to the La-Tour-du-Pin earthquake, we analyze the area of influence of each historical earthquakes summarized in Table 2. For this purpose, based on historical data and the attenuation model of intensity with distance from Arroucau et al. [2006], a region of interest for La-Tour-du-Pin earthquake is determined. Figure 3 shows the isoseismal curves obtained for the events of Table 2. From these analyses it can be concluded that multiple impacts of the La-Tour-du-Pin earthquake and the other historical events of Table 2 is not expected in an area delimited by a radius of fifteen kilometers around the potential epicenter of La-Tour-du-Pin earthquake. This choice is confirmed by the data extracted from SisFrance database. Figure 4 shows the IDP associated to the historical earthquakes listed in Table 2. The IDP associated to other earthquakes than the one of La-Tour-du-Pin are small (i.e., with intensity MSK lower than the ones associated to damage) in the region of interest defined.
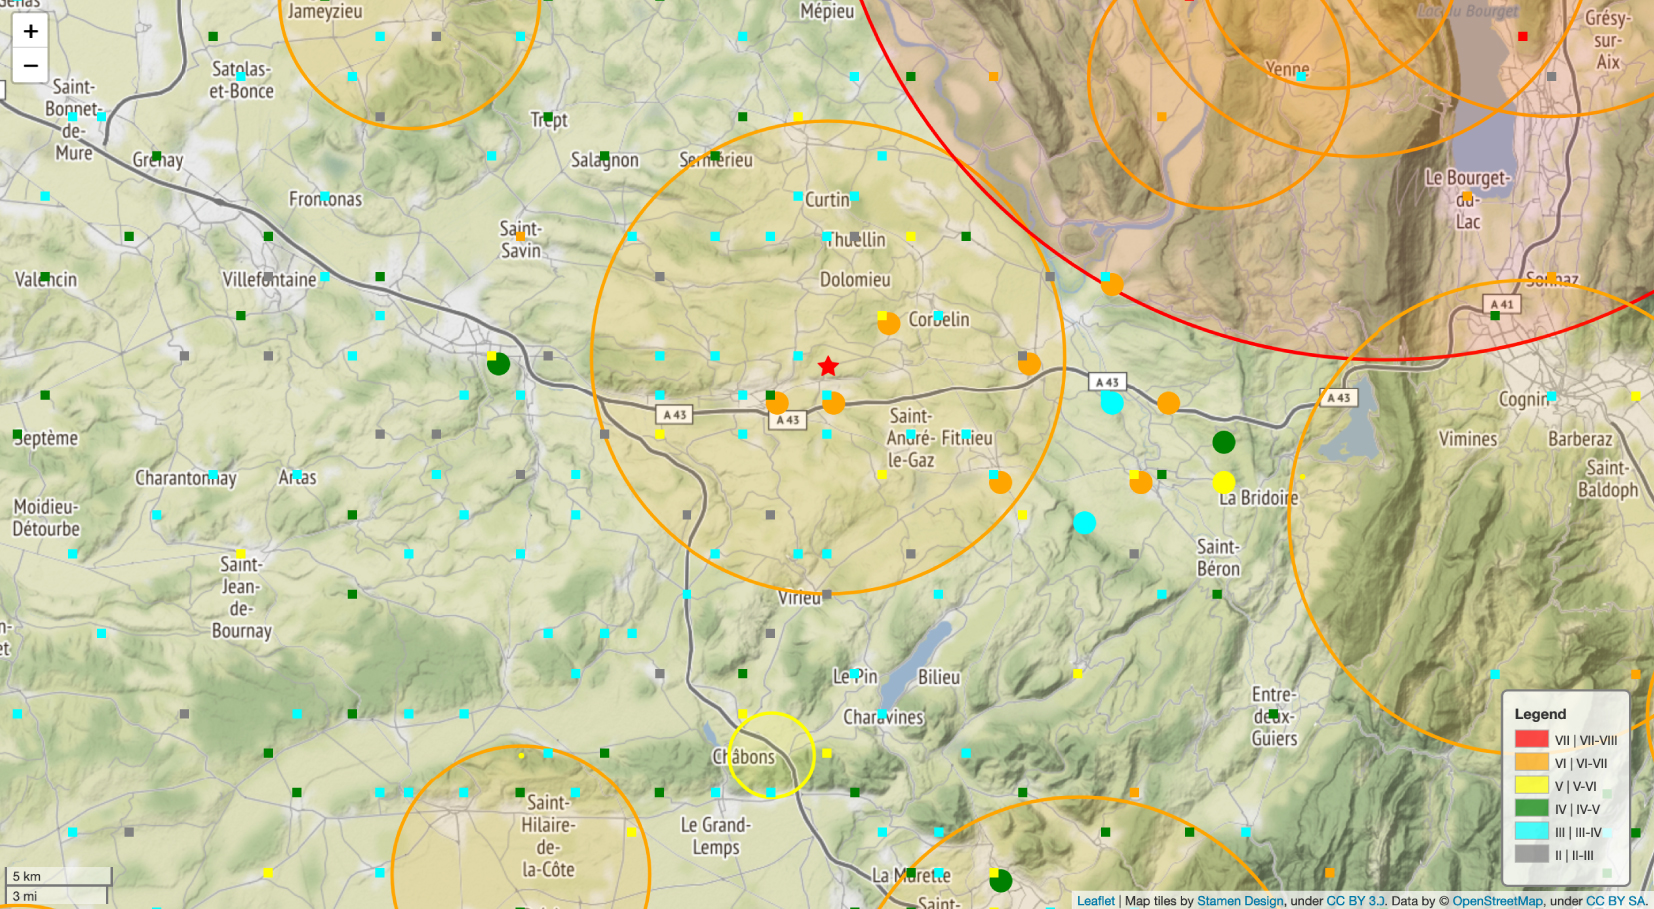
Distribution of the IDP in the region of interest (IDP associated to earthquakes with maximal epicentral intensity MSK ⩾ V) according to the SisFrance database. Circular dots: IDP for la Tour-du-Pin earthquake; square dots IDP for other earthquakes. Red star: epicenter location of La-Tour-du-Pin 1889 earthquake. Colored circles: Area of influence for historical earthquake (Intensity MSK ⩾ V) according to the attenuation model from Arroucau et al. [2006] (color of the circle according to MSK epicentral intensity I0: yellow (V–VI), orange (VI–VII), and red (VII–VIII)). Masquer
Distribution of the IDP in the region of interest (IDP associated to earthquakes with maximal epicentral intensity MSK ⩾ V) according to the SisFrance database. Circular dots: IDP for la Tour-du-Pin earthquake; square dots IDP for other earthquakes. Red star: ... Lire la suite
Historical earthquakes occurred in the region of interest (from SisFrance database)
| Date | Region | I0 | I |
|---|---|---|---|
| 15 October 1784 | Chambéry (Chartreuse) | VI–VII | VI |
| 19 February 1822 | Bugey (Bressan) | VII–VIII | VI |
| 9 September 1879 | Cremieu (Dauphiné) | VI | V |
| 23 February 1887 | Riviera di Ponente (Italia) | IX | VI–VII |
| February 1889 | La Tour-du-Pin (Dauphiné) | VI–VII | VI–VII |
| 29 April 1905 | Lac d’Emosson (Switzerland) | VII–VIII | V |
| 12 February 1942 | Le grand-lemps (Dauphiné) | V–VI | V–VI |
| 25 January 1946 | Chalais (Switzerland) | VII–VIII | VI–VII |
| 30 May 1946 | Chalais (Switzerland) | VII | V |
| 25 April 1962 | Corrençon-en-Vercors (Dauphiné) | VII–VIII | V |
I0 stands for the epicentral intensity and I for the maximum intensity among the Intensity Data Points provided in the SisFrance database for the region of interest.
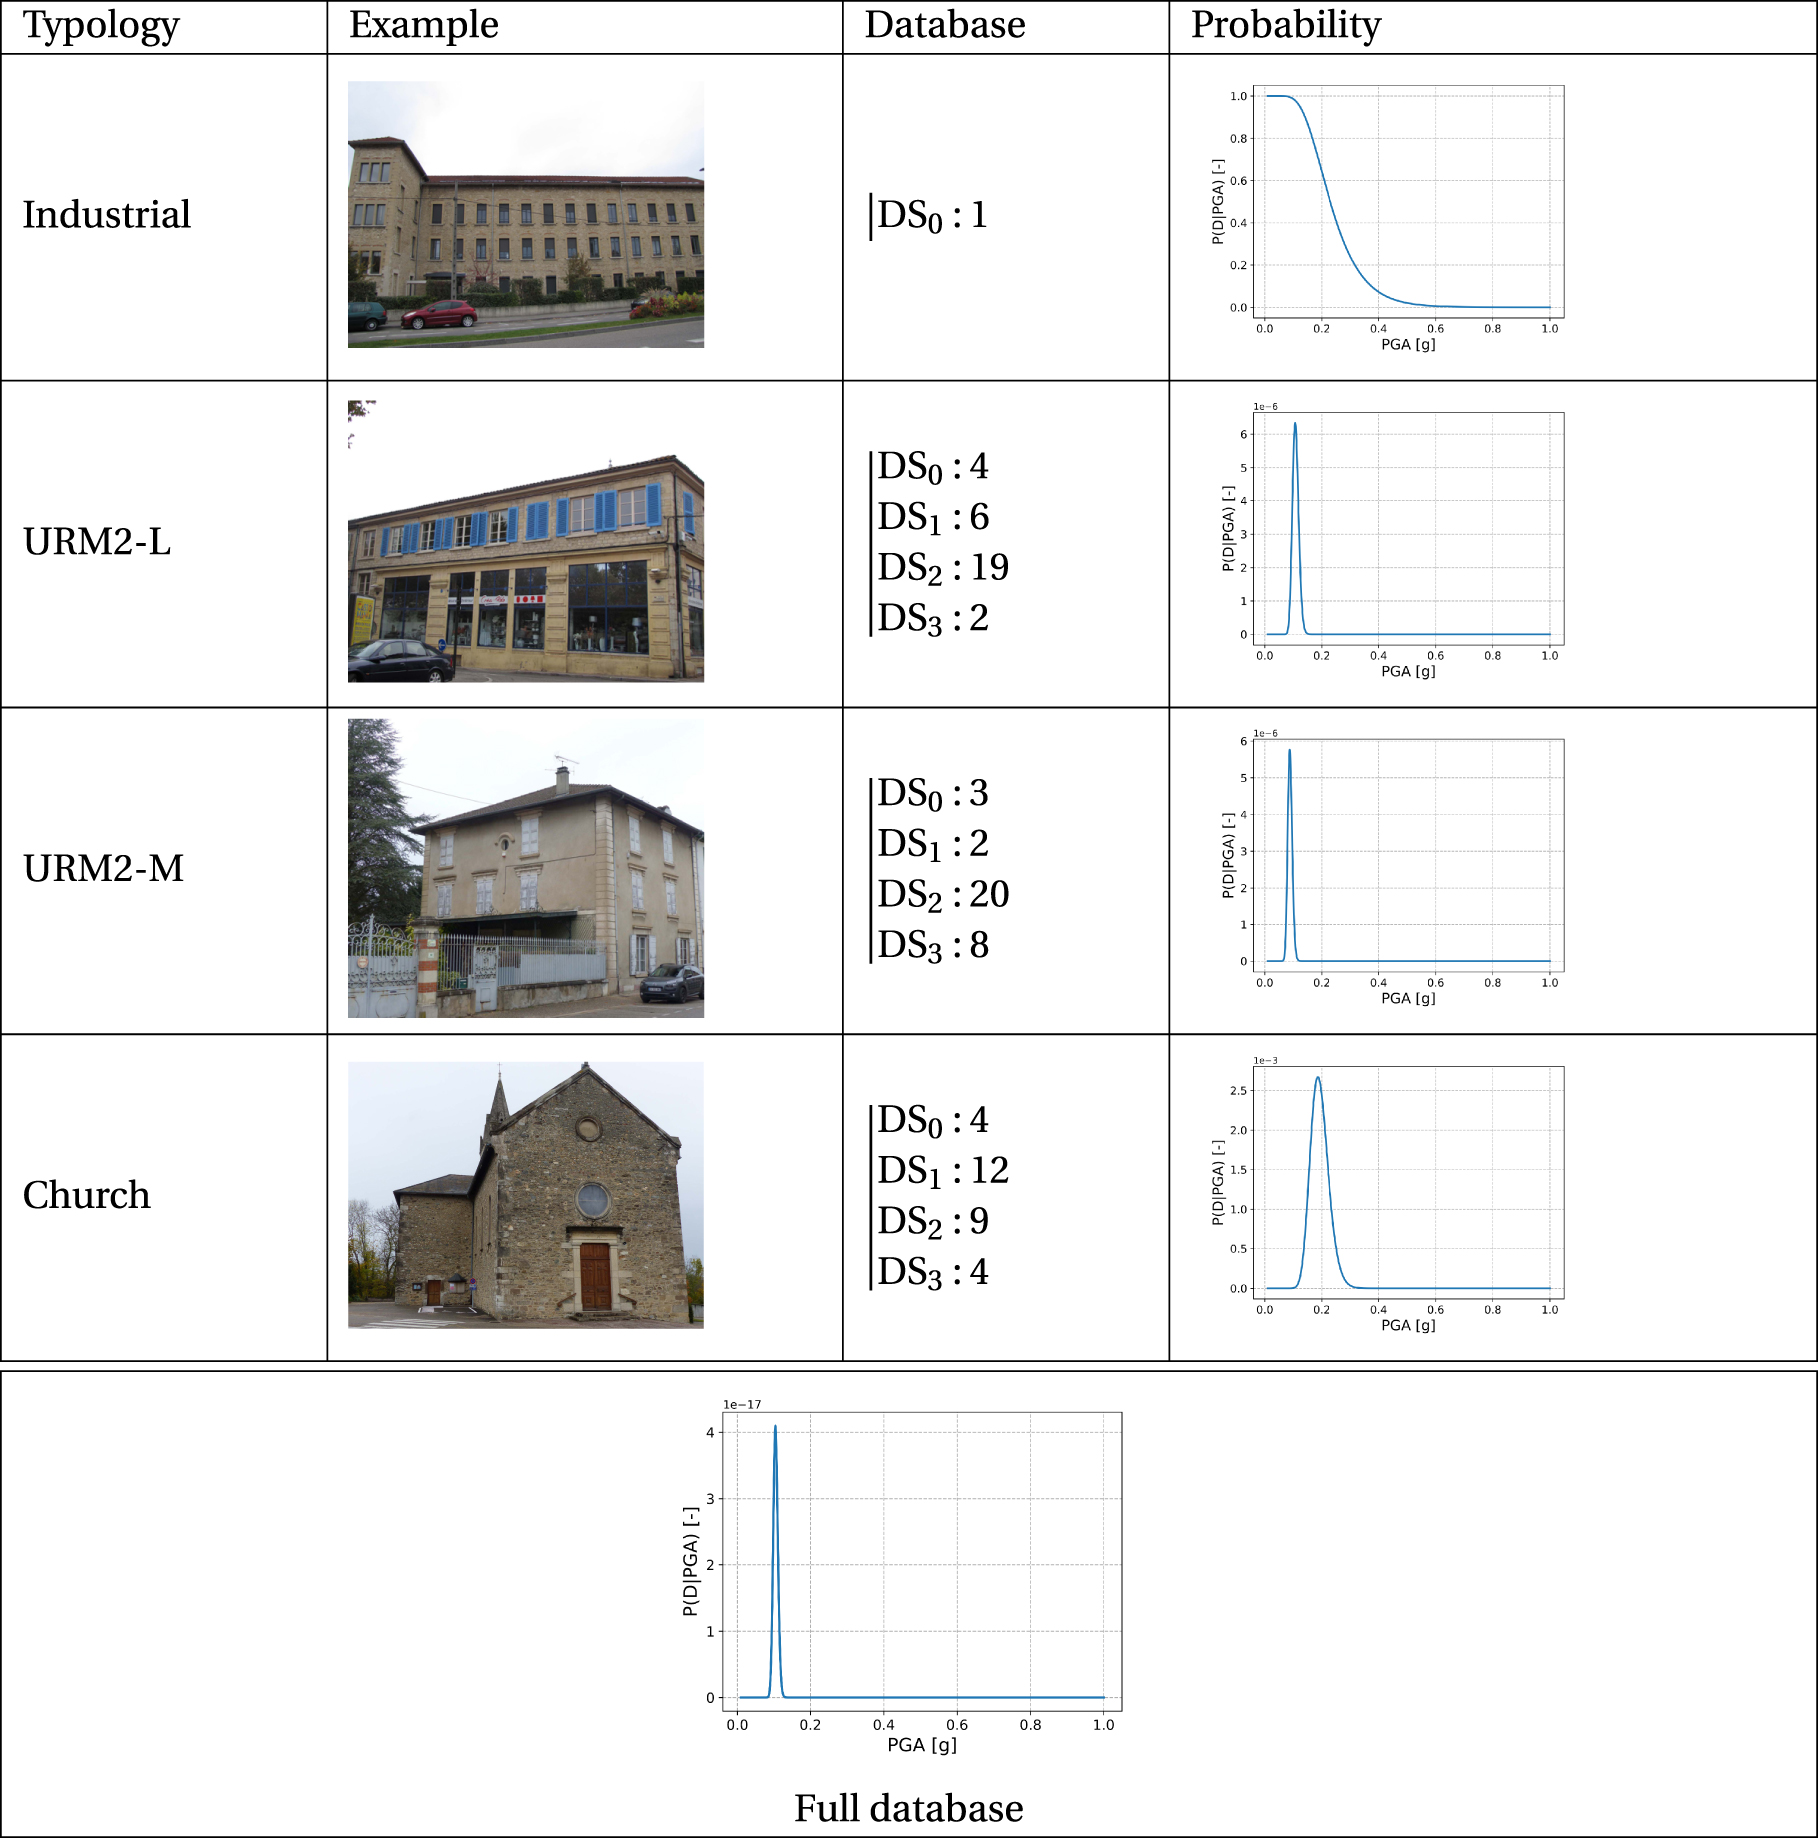
In consequence, an approximate epicentral distance of fifteen kilometers is considered for the definition of the database. This choice leads to an average intensity value of V at this distance according to the model of Arroucau et al. [2006] (i.e., for an epicentral intensity of VII). Table 3 provides the number of buildings by typology according to in situ observations in the area of interest (the data are extracted from Poursoulis [2017]). A qualitative distribution of the buildings in different damage states (DSi) has been done according to the description of the observed degradation (see Figure 5 for examples of observed degradation).
Building database from in situ observations: name of the typology, example of one building in the typology (pictures from Poursoulis [2017]), distribution of the buildings in different damage states for each building typology and associated probability computed with (3). Probability of damage for the full database computed with (4)
 |
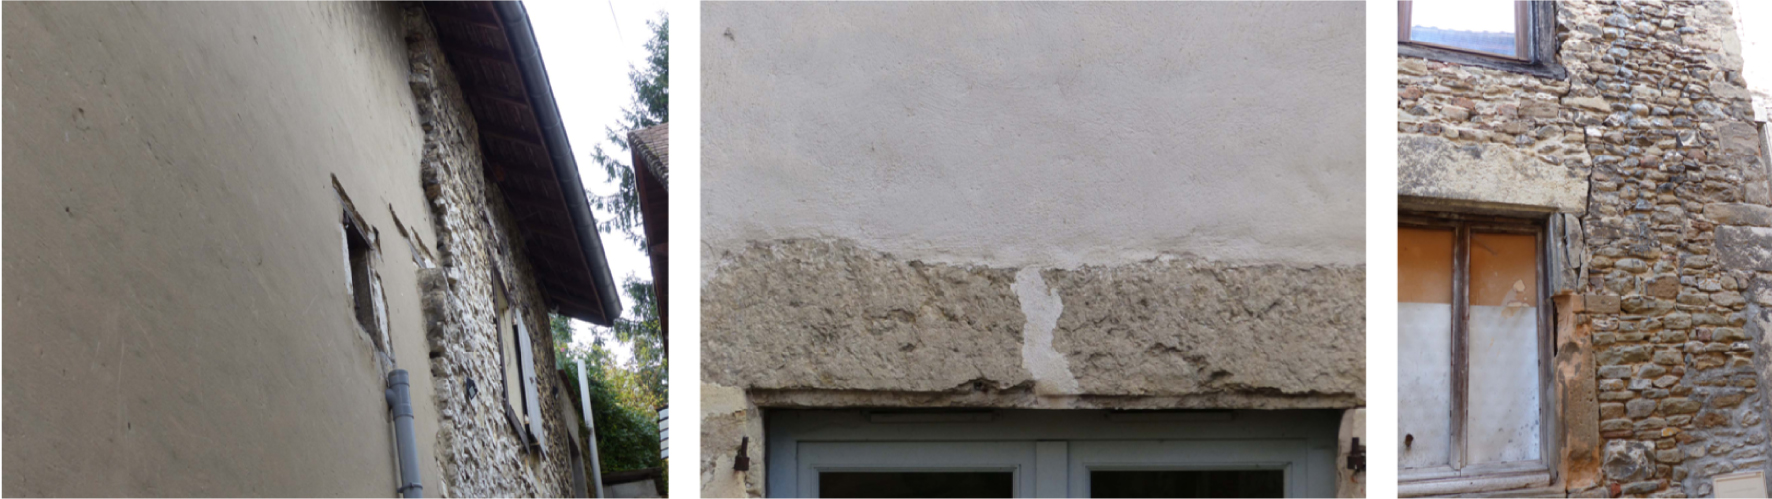
Examples of traces of damage in masonry structures: peeling of a wall, broken lintel, and crack in a wall (extracted from Poursoulis [2017]).
In order to illustrate the qualitative classification performed, an illustration for the case of a masonry house built in 1747 is given. From the archeoseismological campaign performed by Poursoulis [2017], several damages and repairs linked to an earthquake have been identified (see Figure 6). Due to the large distribution of the damages (several masonry reprisal) and the severity (crushing of the bottom corner of the masonry, modification of the openings, introduction of a tie rod), the house has been classified in damage state 3 (i.e., DS3).
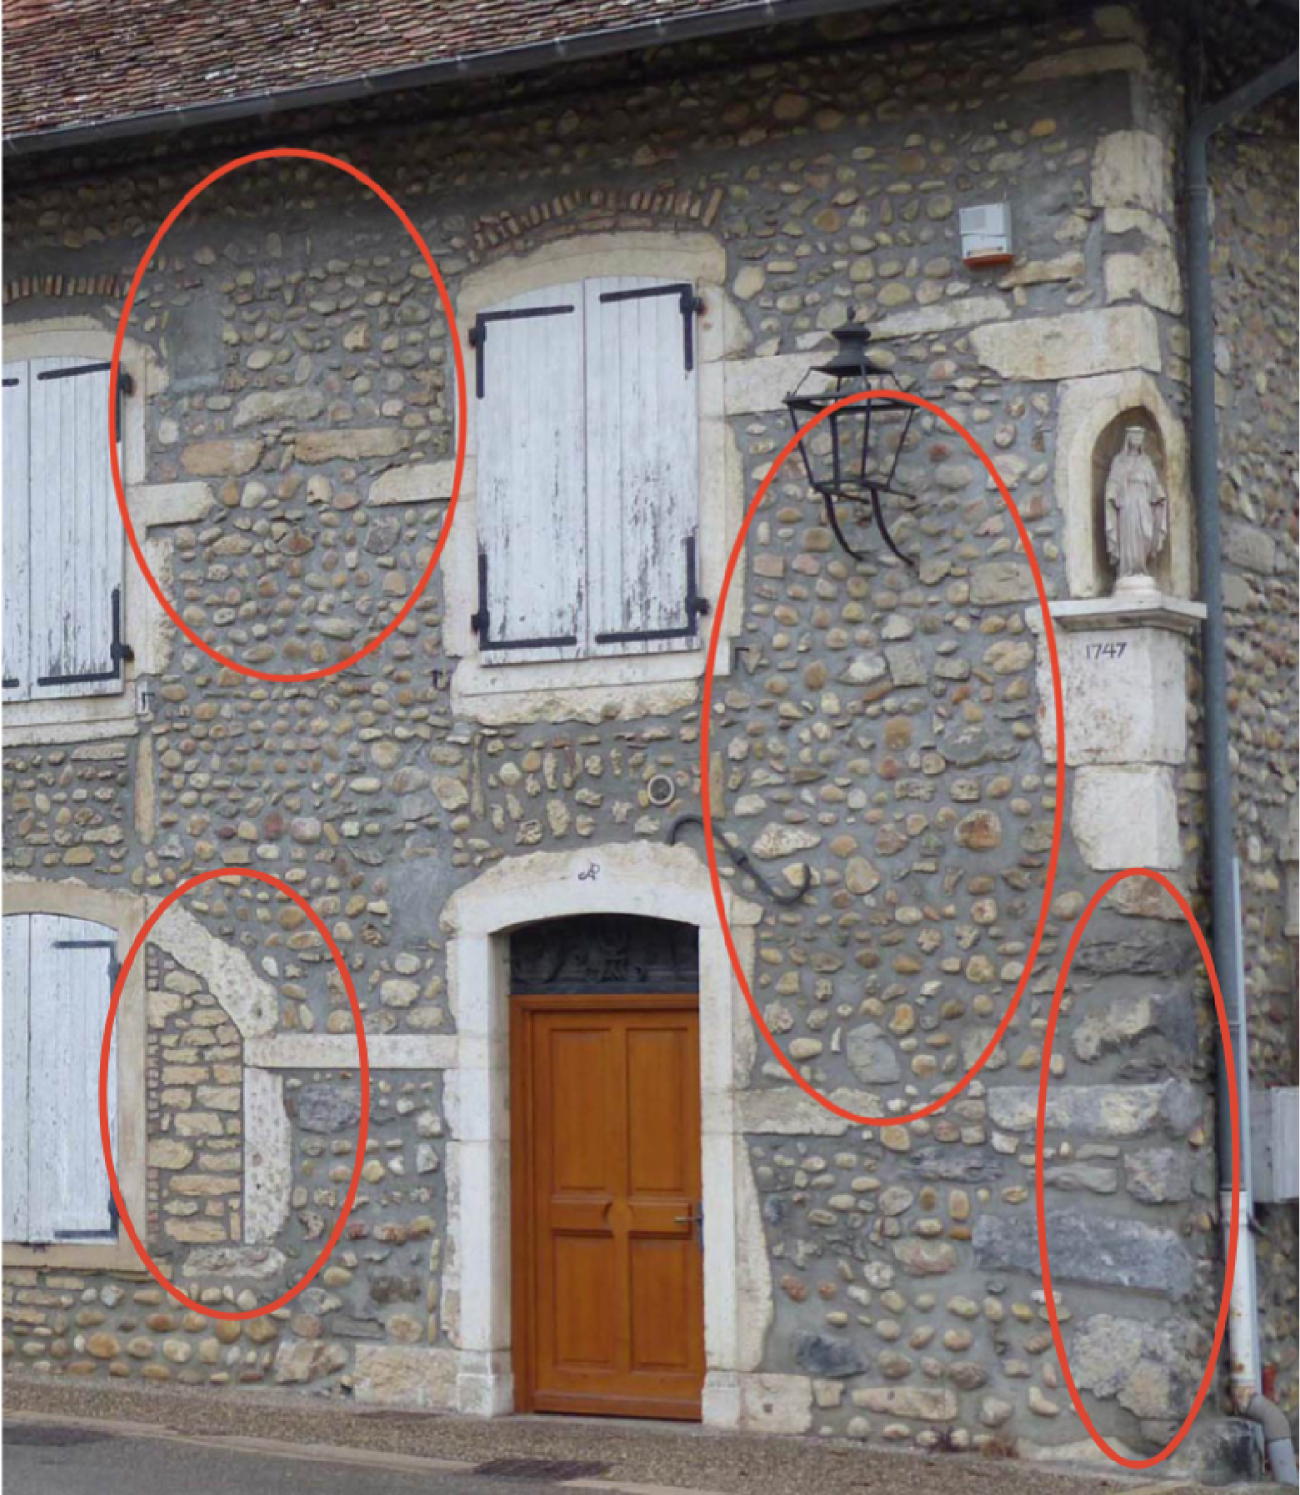
Damages and repairs observed for a masonry house (extracted from Poursoulis [2017]).
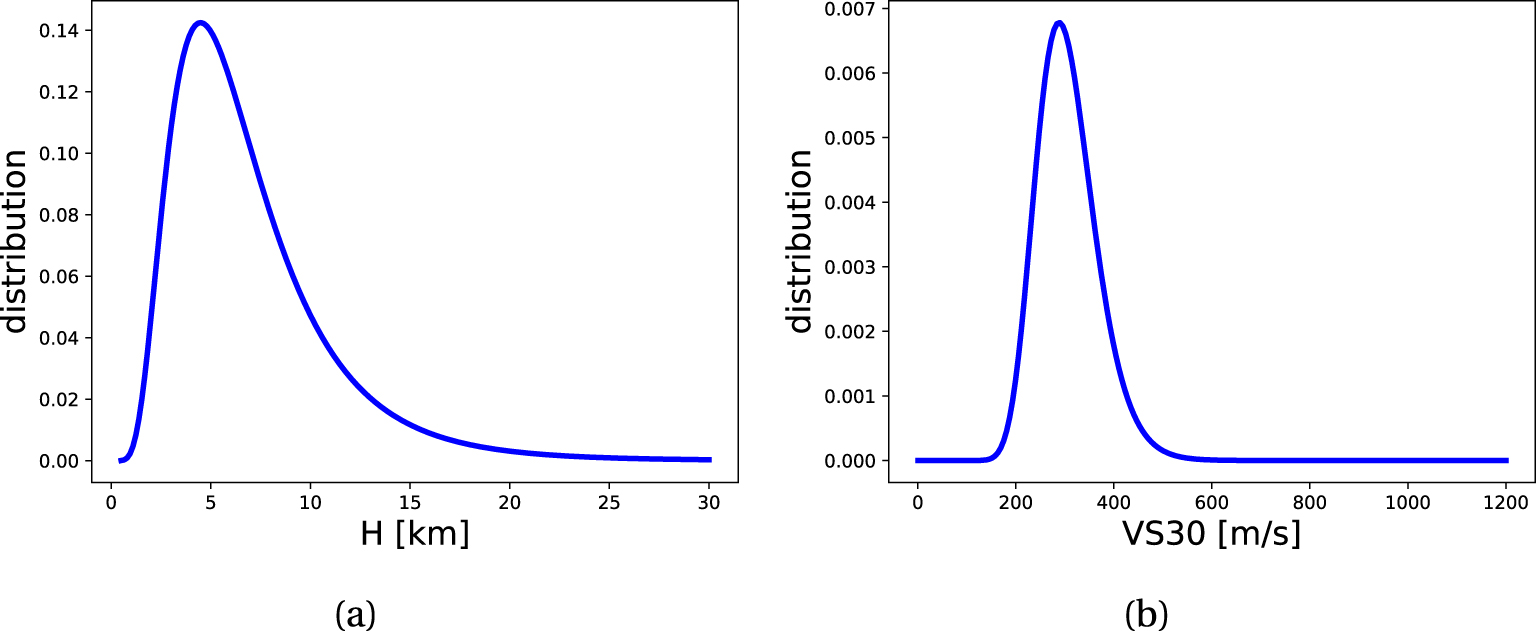
Distribution of the parameters for the GMM. (a) Uncertainty for the depth H; (b) uncertainty for the velocity VS30.
The parameters for deriving the damage probability curves for the different typologies encountered in the region of interest are defined in Table 1. The probability P(Di|IM,m,r,s) obtained for each typology i considered independently, and including every damage state (3), is given in Table 1, as well as the evaluation of the probability for the whole database P(D|IM,m,r,s) (4).
It should be mentioned that a large part of the houses in the region are made with adobe brick. As it is complex to evaluate the effect of an old earthquake on this type of structure, only stone masonry houses are used in this study.
3.2. Updating of the magnitude
GMM can be more or less complex according to the number and type of parameters used (site proxies, magnitude,…). In order to limit the choice of arbitrary values, a GMM is chosen based on a limited number of data (VS30) and with a representativeness of the region of interest [Kotha et al. 2020]. This GMM has been derived from the European Strong Motion dataset (ESM). The choice of the GMM may influence the results obtained but a comparative study is out of the scope of the present work and might be addressed in a later study. An uncertainty is considered for the soil characteristics and the focal depth. Regarding the uncertainty related to the soil, a log-normal distribution for VS30 is used with a median equal to 300 m⋅s−1 and a log-standard deviation of 0.2 (Figure 7(b)). The value of VS30 is linked to the geological context of the region of interest. For the focal depth H, a log-normal distribution with values provided in Manchuel et al. [2018] is considered, with a median value equal to 6 km and a log-standard deviation equal to 0.54 (Figure 7(a)).
A Gaussian distribution is chosen for the prior magnitude distribution assigned to the earthquake of La Tour-du-Pin, with the average magnitude Mw = 4.4 and uncertainty errMw = 0.42, according to Manchuel et al. [2018]. The choice of a log-normal distribution for the variables H, VS30, and Mw is motivated by physical considerations. Indeed, this distribution ensures that the values are always positives. In Figure 8, the update of the magnitude with the proposed methodology is performed for each building typology separately, and for the whole database. Figure 8 gives the posterior magnitude distribution including these newly available data (different typologies, damage states). One can see in this first analysis that the updating of the magnitude has only a small impact. With the data and model considered, a small effect for the updating is obtained with an average value for the magnitude Mw going from 4.4 to 4.39 and an uncertainty errMw going from 0.42 to 0.41. The impact of the choice of parameters of the GMM for this study is investigated.
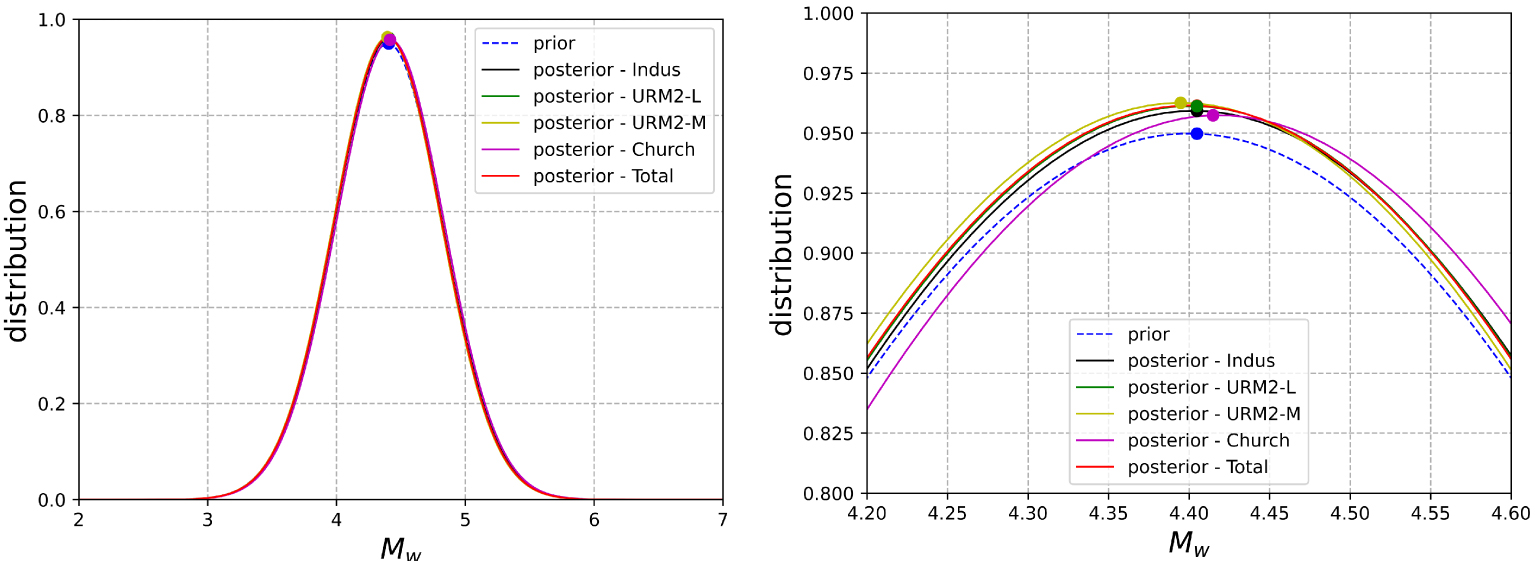
Prior and posterior distribution of the magnitude with an updating process using a single typology and the whole database.
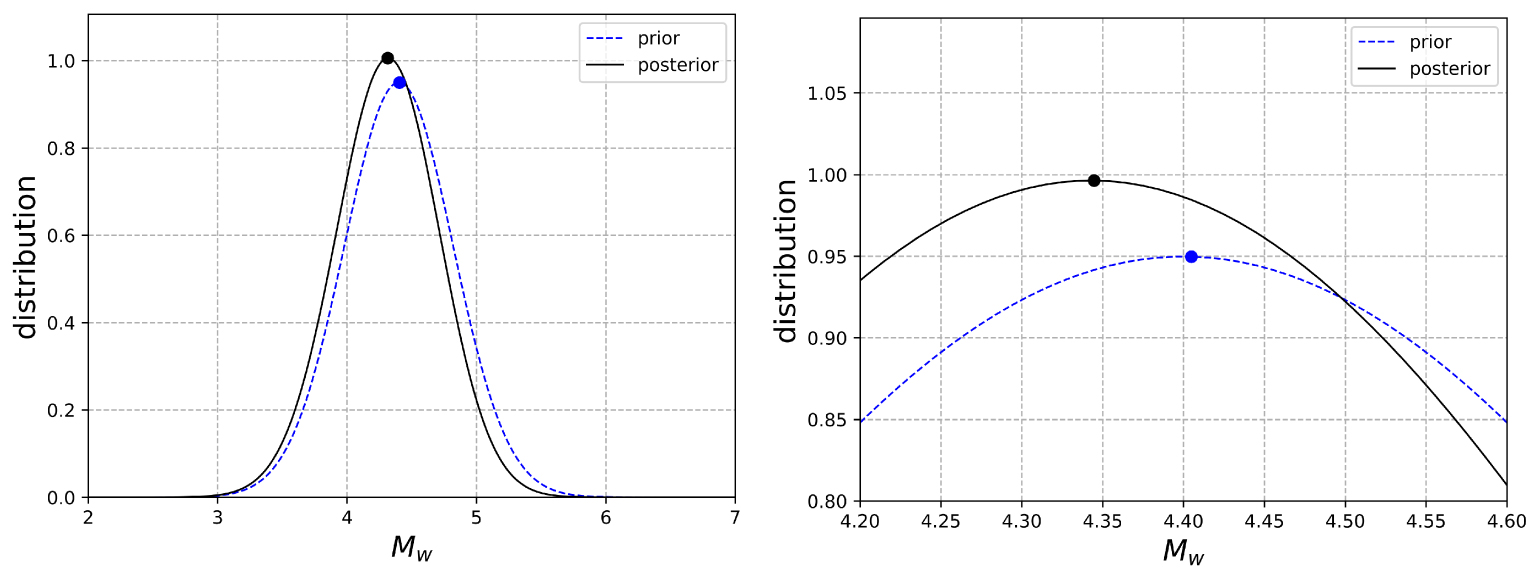
Prior and posterior distribution of the magnitude for a fictitious case.
3.2.0.1. Virtual case study
In order to analyze the capacity of the methodology and the influence of different parameters on the updating process, we define a virtual case study, corresponding to a better knowledge of the site parameters. A value for PGA at the bedrock (VS30 = 800 m∕s) is obtained from the GMM of Kotha et al. [2020] using rJB = 7 km and the distribution used previously for the hypocentral depth. A fictitious site amplification due to alluvial deposits is considered with a constant amplification factor for the PGA taken equal to 5. The 𝜎 value is reduced to 0.3 in order to simulate a better knowledge of the site. This configuration could correspond to a case where a nonergodic site-specific GMM and more detailed site response analyses are available. The same database for buildings and observed damages is considered for this example. Figure 9 provides the posterior distribution obtained from this virtual case study. One can observe an evolution of the mean value
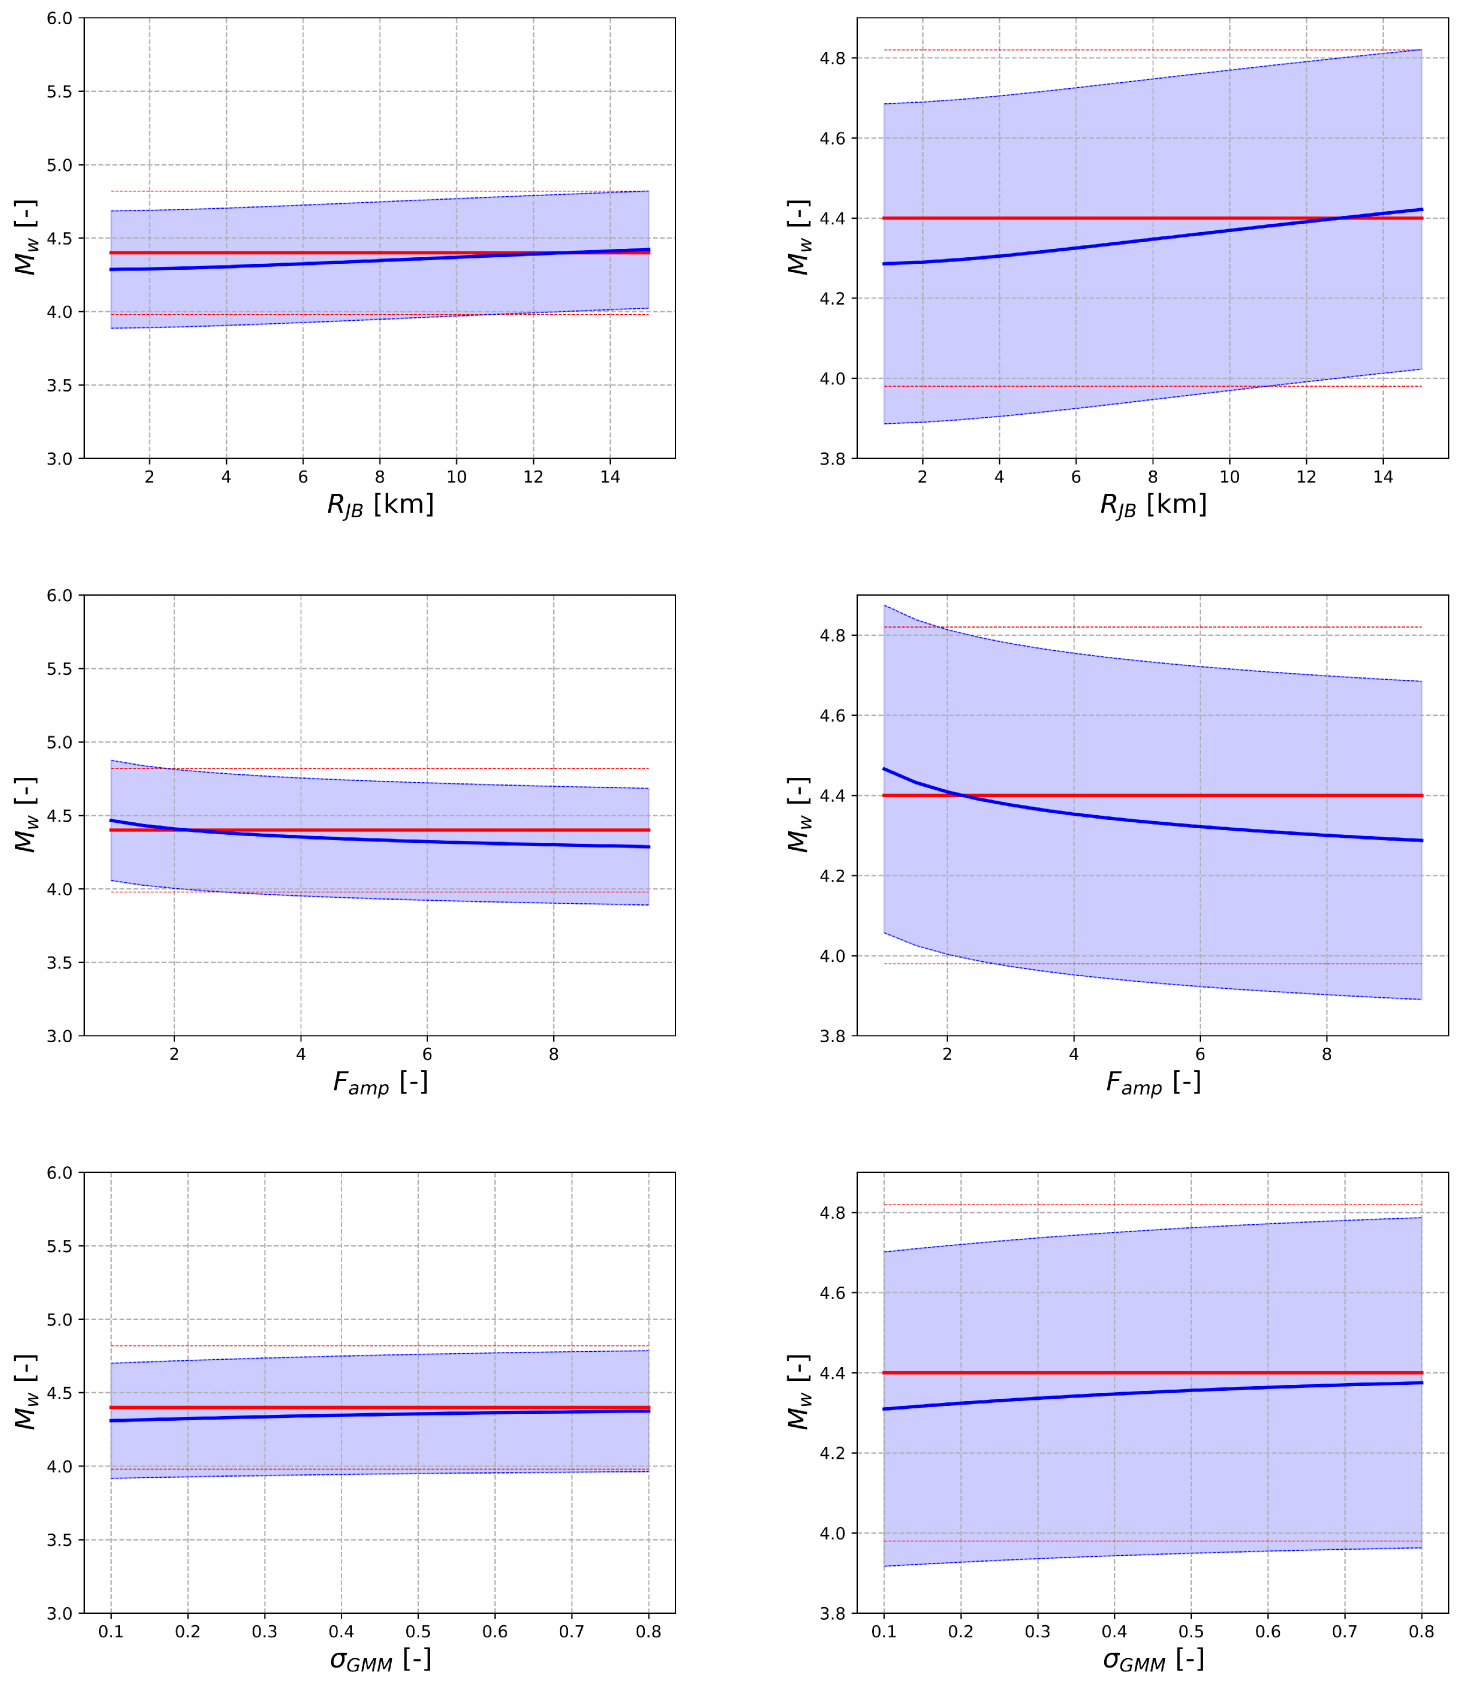
Influence of rJB, 𝜎GMM, and Famp on the actualization (red: mean prior distribution ±𝜎, blue: mean posterior distribution ±𝜎).
As it could have been expected, the increase of the distance RJB associated to the average location of the database leads to an increase of the mean magnitude of the posterior distribution (
The last results obtained concern the influence of 𝜎GMM over the standard deviation obtained for the posterior distribution. For the set of parameters considered in this study, one can see that the standard deviation obtained for the posterior distribution is reduced with respect to the prior distribution, even for large values (
4. Summary and concluding remarks
A method to update the magnitude assigned to historical earthquakes has been proposed. It is based on the comparison of the probability of damage models to observed the damage of historical buildings collected from an archeoseismological in situ campaign. The classification of the buildings in different structural typologies and damage state classes (including no damage) provides valuable information that allows for a reduction of the uncertainty in the assessment of magnitudes of historical earthquakes. It has been observed that the method allows for reducing the standard deviation of the updated magnitude even with a large 𝜎 value of the GMM, and taking into account the uncertainty for parameters associated to the historical earthquake like the hypocentral depth. It should also be mentioned that the damage probability functions considered in this study have large standard deviation of the log-normal distribution. Finally, it has to be pointed out that the methodology proposed is efficient to update magnitude as soon as the historical earthquakes considered can produce damages to structures. As a consequence, if no damage is observed, the method tends to be limited to earthquakes with maximum intensity degree larger than MSK V–VI approximatively.
As a perspective, other typologies of structures (e.g., castel,…), for which a history of the damage may have been kept, are potential sources of additional data. Besides, more specific fragility curves could be produced to better correlate the observed damage state to the intensity measure with lower standard deviation of the log-normal distribution. Furthermore, the 𝜎GMM can also be reduced by introducing a site-specific model. As discussed before, the epicenter location may be uncertain for historical earthquakes. As a consequence, to fully improve the definition of a historical earthquake, an updating of both magnitude and location may also be considered as further developments of the proposed methodology. Finally, combination of different intensity measures (e.g., PGV, IA,…) through fragility surfaces may allow to consider additional data links to specific damages (e.g., overturning of rigid blocks).
5. Data and resources
The city boundaries that have been used to define the area of interest were collected at: https://www.data.gouv.fr/fr/datasets/ (last access: February 2020). The report related to the survey on the area of interest to observe cracks, traces of repair work was provided by EDF and is proprietary. The data are collected in an internal report (G. Poursoulis, Rapport de mission réponse à la demande concernant: Etude architecturale, amélioration de la connaissance du séisme de 1889, localization supposée à la Tour-du-Pin, Archéosismicité—La mémoire des lieux (2017)). They cannot be released to the public. The data in SisFrance can be obtained at http://www.sisfrance.net (last access: December 2020).
Acknowledgments
This study was part of SIGMA-2 project and was funded by EDF.
Vous devez vous connecter pour continuer.
S'authentifier