


 CC-BY 4.0
1. Introduction
Accurate numerical modelling of multiphase flow processes in unconsolidated porous media plays a fundamental role in addressing environmental challenges such as groundwater contamination, soil remediation, and sustainable water resource management. Reliable predictions of subsurface flow are crucial for practical applications including pollutant transport, remediation of contaminated aquifers, and CO2 sequestration in geological formations (Helmig et al., 2013; Celia et al., 2015; Mao et al., 2020; Benisch et al., 2020). Effective numerical simulation of these processes requires well-defined constitutive relationships, notably the water relative permeability (krw) and capillary pressure–saturation (Pc–Sw) curves (Schäfer, Di Chiara Roupert, et al., 2020). These relationships directly link fluid pressures and saturations, governing fluid distribution and mobility in porous media, thus playing a critical role in the accurate modelling of fluid displacement in soils and aquifers.
Capillary pressure (Pc) represents the pressure difference across the interface between two immiscible fluids in a porous medium, and is defined by the relationship Pc = Pnw − Pw (Morrow, 1976), where Pnw is the pressure of the non-wetting fluid and Pw is the pressure of the wetting fluid. In hydrological applications, this relationship between water and air is commonly described as the water retention curve. Drainage corresponds to a decrease in the saturation of the wetting fluid (in our case, water), whereas imbibition refers to the increase in the saturation of this wetting phase. As found in the early 1960s, water retention curves may also depend on the direction and on the “displacement history” of the water–air front, further referred to as hysteresis effects (Poulovassilis, 1962; Mualem, 1984; Parker et al., 1987; Stauffer and Kinzelbach, 2001). Later studies have demonstrated that hysteresis effects are not the only additional influence on this relationship and they show that there are considerable dynamic effects on the measured capillary pressure curves (Hassanizadeh and Gray, 1987; Bourgeat and Panfilov, 1998; Hassanizadeh, Celia, et al., 2002; Dahle et al., 2005; Løvoll et al., 2011). Laboratory measurement of Pc–Sw relationships traditionally involves macroscopic methods, including the widely used hanging water column technique (Haines, 1930; Faybishenko, 1995; Klute, 2018). Although effective, these methods inherently assume global equilibrium conditions, averaging saturation across samples, thus neglecting local saturation heterogeneities and potentially introducing substantial uncertainty into measured data (Moura et al., 2015; Ayaz et al., 2020).
The relative two-phase permeability of a porous medium can be determined using various techniques, including methods based, for example, on mathematical modelling of the two-phase flow or experimentally in the laboratory by measuring the permeability of the porous medium in controlled one-dimensional two-phase flows. Constitutive relationships for water relative permeability (krw) are often derived indirectly from capillary pressure–saturation data using empirical models such as those of Van Genuchten (1980) and Brooks and Corey (1964). Alternatively, krw curves can be obtained experimentally. Laboratory methods for determining relative permeability include flow tests in one-dimensional columns of porous media, centrifugal methods and analogue methods with capillary pressure measurements (Esmaeili et al., 2019). Direct hydraulic conductivity measurements are based on steady-state as well as transient flow tests. The focus of this work is on steady-state flow tests, where water is the only moving fluid phase and the air present is considered immobile. During vertical steady-state water flow through an unsaturated porous medium, the measurement of relative water permeability, as shown by Dury et al. (1998) and Fischer et al. (1996), is based on bulk-averaged measurements of water content and a fixed hydraulic gradient of one (dimensionless, expressed as Δh/ΔL in m/m), which is equivalent to the assumption of a uniform vertical water pressure distribution in the porous medium. These assumptions, however, limit spatial resolution and introduce significant uncertainties.
Historically, multiphase flow characterization has relied on separate experiments for obtaining retention and permeability data. Such an approach is experimentally intensive and may introduce inconsistencies due to differences in boundary conditions and sample preparations between tests (Dury et al., 1999; Fischer et al., 1996). Some studies, highlight the importance of capturing local heterogeneities and dynamic effects influencing capillary pressures and relative permeabilities, as these parameters significantly affect flow simulations (Hassanizadeh, Celia, et al., 2002; Dahle et al., 2005; Løvoll et al., 2011; Toussaint et al., 2012).
In response to these methodological challenges, this study introduces a novel experimental setup designed explicitly to measure simultaneously and precisely both the relative permeability and water retention curves. We employ a column system integrating in situ water content measurements through a Time Domain Reflectometry (PICO TDR) probe, combined with direct, continuous monitoring of local pressure gradients via dual pressure transducers interfaced through semi-permeable porous ceramic cups. This integrated approach allows simultaneous, spatially resolved characterization of both retention curves (Pc–Sw) and relative permeability (krw–Sw), thereby addressing limitations identified in previous studies (Dury et al., 1998; Fischer et al., 1996).
The innovation of this experimental setup lies in its ability to concurrently measure the hydraulic relationships under realistic subsurface conditions. By combining in situ measurement technology (PICO TDR and pressure transducers) with rigorous experimental protocols (primary and secondary drainage and imbibition cycles), we provide high-quality, reproducible datasets suitable for reliable model calibration. Moreover, each experiment was independently replicated under identical conditions to rigorously validate reproducibility and minimize uncertainty.
2. Experimental setup
2.1. Column design
The experimental setup consists of a vertical transparent acrylic glass column, 20 cm in height and 3 cm in internal diameter, which allowed visual inspection of the wetting and drainage fronts. A semi-permeable fritted glass porous membrane (DURAN®, sintered borosilicate glass 3.3, Ø 40 mm, thickness 3 mm, edge not fused) is placed at the base to ensure uniform outflow and support the granular material. Two porosity grades were used depending on the sand: Por. 3 (pore size 16–40 μm, ISO 4793) for the finer P100 sand, and Por. 2 (pore size 40–100 μm, ISO 4793) for the coarser P2040 sand. The column is filled with an unconsolidated porous medium, which can be either a fine sand (P100) or a coarse sand (P2040). Although the sands are described in detail later (Section 2.3), their mention here is necessary to provide context for the packing and instrumentation.
The granular material is compacted in uniform layers to minimize preferential flow and ensure consistent packing. To ensure compatibility with the hydraulic properties of each sand, porous membranes with different air-entry pressures were selected. For the finer P100 sand, a less permeable membrane with an air-entry pressure of approximately 100 mbar was used to sustain capillary forces and prevent premature air intrusion. Alternatively, for the coarser P2040 sand, a more permeable membrane with an air-entry pressure of approximately 50 mbar was chosen, ensuring adequate drainage that is compatible with its larger pore structure.
To replicate realistic hydraulic boundary conditions, a constant mechanical overload was applied at the top of the column using small stainless-steel spheres. These spheres, open to atmospheric pressure, effectively mimicked natural stress conditions and maintained consistent boundary conditions at both ends of the column. A perforated PVC plate placed directly beneath the spheres allowed water to enter uniformly while ensuring even distribution of the mechanical load across the surface. This configuration also limited grain displacement during upward imbibition, preventing free movement of particles visible to the eye.
Water flow is imposed at the top of the column using two types of pumps, selected based on the desired flow rate range. This choice was made to ensure a stable and uniform inflow boundary condition under steady-state flow. The columns were first saturated by upward imbibition, which minimized air entrapment and guaranteed full saturation. Once the porous medium was fully saturated, subsequent injection from the top did not generate fingering, as the pore space was already water-filled and flow simply displaced water downward under gravity, capillary forces and imposed boundary conditions toward the outlet. For standard flow conditions, a precision-controlled peristaltic pump is employed. For experiments requiring lower flow rates (less than 1 mL/min), a two-piston Pharmacia P-500 high-precision pump is utilized. This pump offers a flow rate range of 1–499 mL/h with the accuracy of ±1.5% of the set value.
At the base of the column, water exits through the porous membrane into a small outflow reservoir, which allows precise control of the outlet pressure. By raising or lowering the reservoir, the pressure at the base of the column can be actively adjusted, allowing the imposition of drainage or imbibition conditions as needed. From the reservoir, water is channeled through tubing to a second collection reservoir, which is placed in an analytical balance connected to a computer. The balance transmits its signal via the RS232 protocol, which is converted to USB using a RS232-USB interface for computer reading. The balance records the cumulative mass of discharged water at 10-second intervals, allowing real-time calculation of the flow rate. This approach improves accuracy by accounting for potential discrepancies between the programmed and actual flow rates, which may result from tubing elasticity, head loss, or pump calibration drift.
To measure the pressure gradient across the porous medium, two high-precision Keller Series PR-41X piezoresistive pressure transducers are embedded in the side wall of the column at fixed heights (5 cm and 10 cm above the base). These sensors, with a total error band of 0.2% of the full scale: ±0.4 mbar or ±40 Pa and a measurement range of −100 to +100 mbar, are well suited to capturing the low-pressure differentials typical of unsaturated flow in granular media. The sensors measure relative pressure, meaning all readings are referenced to atmospheric pressure, allowing for accurate tracking of both suction and positive pressure conditions within the column. Each sensor is connected to a fully saturated, semi-permeable, ceramic porous cup (Soil Moisture: 0652X03-B01M3, outside diameter = 6 mm, total length = 27 mm, length in the porous medium = 20 mm, ceramic Type: 1 bar High flow), which establishes hydraulic continuity with the pore water and prevents direct contact between air and the sensor diaphragm. This configuration ensures that only the pore water pressure is recorded. The air phase was open to the atmosphere at the column inlet, so the air pressure remained constant at atmospheric conditions throughout the experiments. This setup is therefore ideal for capturing capillary-driven processes in unsaturated conditions. The numerical signal from the piezoresistive pressure transmitter is transmitted via the RS485 communication protocol, allowing it to be read by a computer.
The system is allowed to equilibrate at each experimental step until the pressure gradient displays steady-state behaviour, ensuring signal stability. This high temporal resolution and sensitivity enable the calculation of the hydraulic gradient across the soil column and, in combination with the measured flow rate, allow for the precise estimation of hydraulic conductivity (Kw) and water relative permeabilities (krw).
To monitor the volumetric water content within the soil column, a TRIME®-PICO TDR soil moisture probe is installed horizontally at the mid-height of the column. According to the manufacturer, the TRIME®-PICO probe has a small measurement volume (on the order of a few cubic centimeters surrounding the probe rods), which provides high spatial resolution and makes it particularly suitable for laboratory column experiments (IMKO, 2022). Moreover, the probe was positioned at the mid-height of the column, where spatial variations in water content were expected to be minimal under steady-state flow. This probe uses the IMP-Bus, a specific communication protocol developed by IMKO, to transmit data. The USB-Interface IMP-Bus converts the IMP-Bus signal to USB, making it compatible with a PC. This sensor operates on Time Domain Reflectometry (TDR) technology, emitting high-frequency electromagnetic pulses (∼1 GHz) to measure the dielectric permittivity of the surrounding medium and infer the volumetric water content. Its measurements are minimally affected by temperature or salinity, making it reliable across various soil types. The total sensor rod length is 50 mm; however, to minimize disturbance within the packed column, only 20 mm of the probe is inserted into the soil. We highlight that the reproducibility observed across replicate experiments suggests that the disturbance was limited. To accommodate this configuration, two hollow PVC extensions were attached to the exterior of the column to securely hold the sensor while preserving the integrity of the soil structure. Data from the TDR sensor are logged concurrently with pressure and flow measurements, providing spatially and temporally resolved insights into the column’s hydraulic behaviour. A Python script on the computer reads all the USB inputs and converts them into numerical values representing the data.
A schematic representation of the experimental column setup is provided in Figure 1, illustrating the positioning of the sensors, flow path, and water recovery system. During the initial imbibition stage, we observed that the water front progressed through the column in a uniform manner. Minor irregularities were visible, particularly in the coarser P2040 sand, but no fingers were developed, which is consistent with the stabilizing effect of capillary forces in well-sorted sands, and of gravity with the denser fluid injected from the bottom. Once the column was fully saturated, direct observation of flow behavior was no longer possible, although desaturation fronts could still be seen during subsequent drainage steps. These observations are consistent with the measured pressure and water content dynamics, supporting that fingering did not influence the experiments.
Schematic diagram of the experimental column setup used for the measurement of water retention and relative permeability curves. The system includes a vertical PVC column filled with sand, equipped with two lateral pressure sensors, a PICO TDR probe at mid-height, a fritted glass porous membrane at the base, and a mechanical surcharge at the top applied via stainless-steel spheres. Prior to the flow experiments, the column was saturated from the bottom by upward imbibition to ensure homogeneous initial conditions and minimize air entrapment. Water then enters from the top through a peristaltic pump during the measurement stage of hydraulic conductivity (Kw) at successive saturation states, and exits into a water recovery reservoir connected to an analytical balance for flow rate monitoring.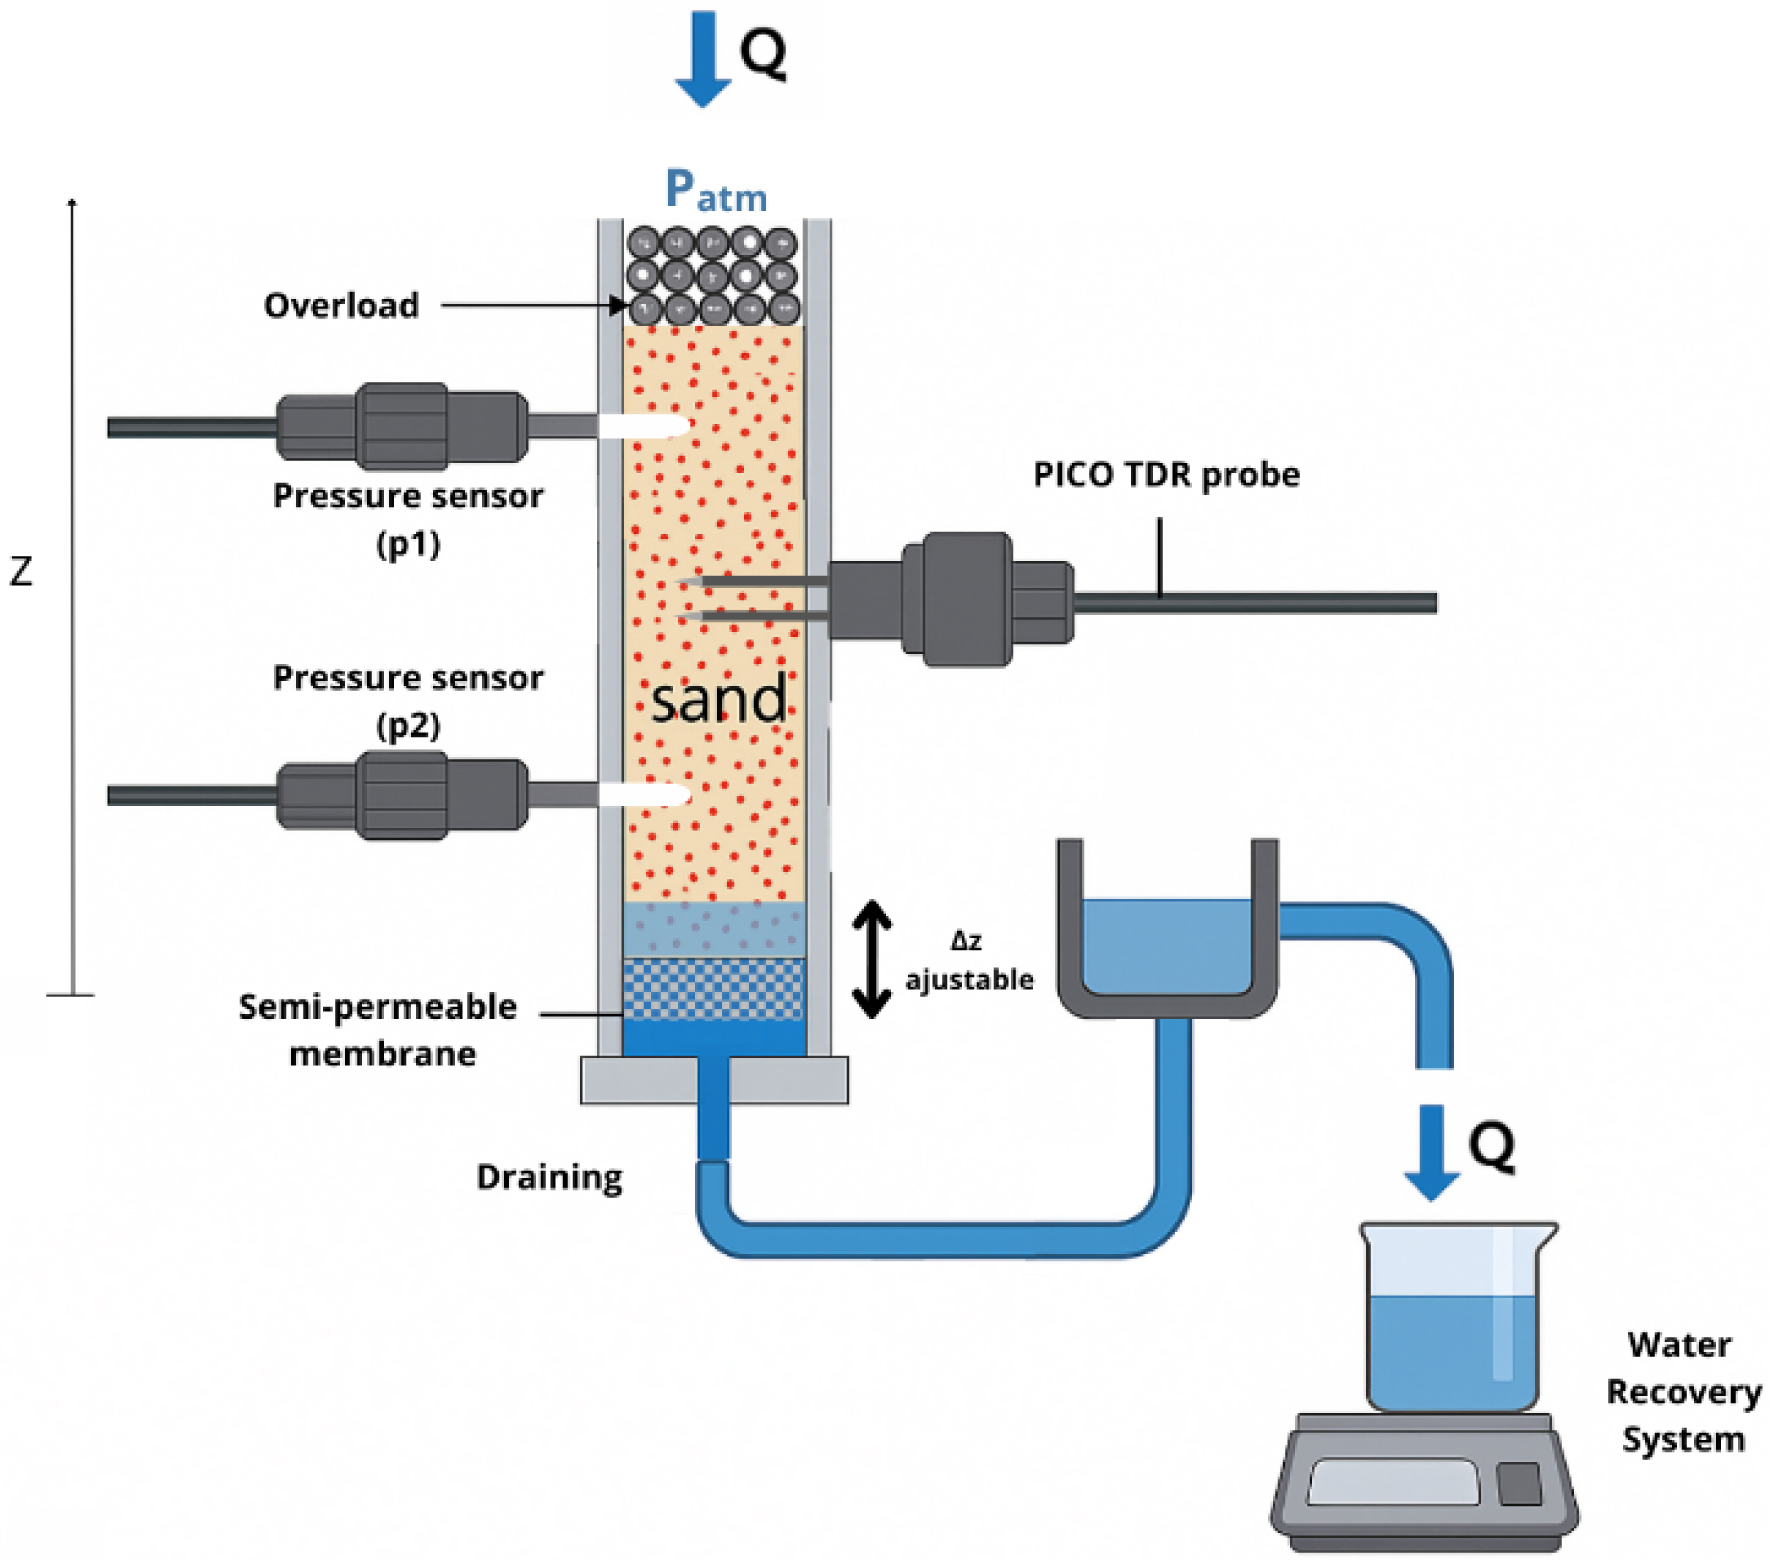
2.2. PICO TDR probe calibration
Accurate interpretation of water content data from the TRIME®-PICO TDR probe requires calibration tailored to the specific granular medium in which it is embedded. Although the sensor is factory-calibrated with a universal soil curve, we performed a material-specific two-point linear calibration for each sand type. This is necessary because the dielectric response varies with grain size, packing structure, and mineral composition.
The calibration assumes a linear relationship between transient time (tp) and volumetric water content (𝜃w), where tp corresponds to the radar travel time, i.e. the time taken by the high-frequency electromagnetic pulse to propagate along the probe rods through the surrounding soil measured in nanoseconds (ns). This assumption was confirmed experimentally in specific calibration studies. To evaluate the sensor response and determine the appropriate calibration model, we performed a detailed calibration on a reference fine sand (N34) under controlled ex situ conditions. NE34 is a high-purity quartz sand (SiO2 > 99.7%) with a median grain diameter (D50) of 206 μm. Its grain size distribution is relatively narrow, with over 75% of particles retained between 200 and 315 μm. The sand has a soil density of 2.65 g/cm3, and a bulk density of the porous medium of approximately 1.7 g/cm3. The calibration procedure involved preparing a series of samples at known volumetric water contents, ranging from dry (0%) to full saturation (approximately 35% volumetric water content), in increments of 5%. The sand was first air-dried, and known masses of distilled water were then added to the dry sand mass to reach the target water contents. The mixtures were thoroughly homogenized before each measurement. The volumetric water content (𝜃w) was determined gravimetrically from the ratio of the added water mass to the bulk volume of sand, calculated from the known dry mass and the packing density used in the experiments. At each water content step, the probe was inserted and the corresponding radar travel time (tp) was recorded. In this study, water saturation (Sw) is defined as the ratio of volumetric water content (𝜃w) to porosity (n), such that Sw = 𝜃w/n. Therefore, full saturation corresponds to 𝜃w = n, which is approximately 35% of the sand used.
Each mixture was packed uniformly into a container, and the corresponding radar time (tp) was measured using the PICO TDR probe. The results revealed a strong linear relationship between tp and 𝜃w, with a coefficient of determination R2 > 0.99, confirming the suitability of a linear calibration model within the relevant saturation range (Figure 2). This finding justified the use of a two-point linear calibration for other sands, eliminating the need for full multi-point characterization. For P100 and P2040 sands, the two calibration points were determined in situ during the primary imbibition phase of the column experiments. The column was initially dry, and water was slowly introduced from the bottom until full saturation was reached. The PICO sensor readings at the dry state (𝜃w ≈ 0%) and at full saturation (𝜃w = porosity) were used to define a linear calibration equation:
| \begin {equation}\label {eq1} \theta _{\mathrm {w}} = m * t_{\mathrm {P}} + b, \end {equation} | (1) |
Exsitu calibration curve of the PICO-TDR probe using fine sand NE34. The plot shows the linear relationship between the transit time (tp) and volumetric water content (𝜃w). Calibration was performed by preparing sand samples at known moisture levels and measuring the corresponding tp values. The resulting fit exhibits a high coefficient of determination (R2 > 0.99), confirming the suitability of a linear model within the tested saturation range.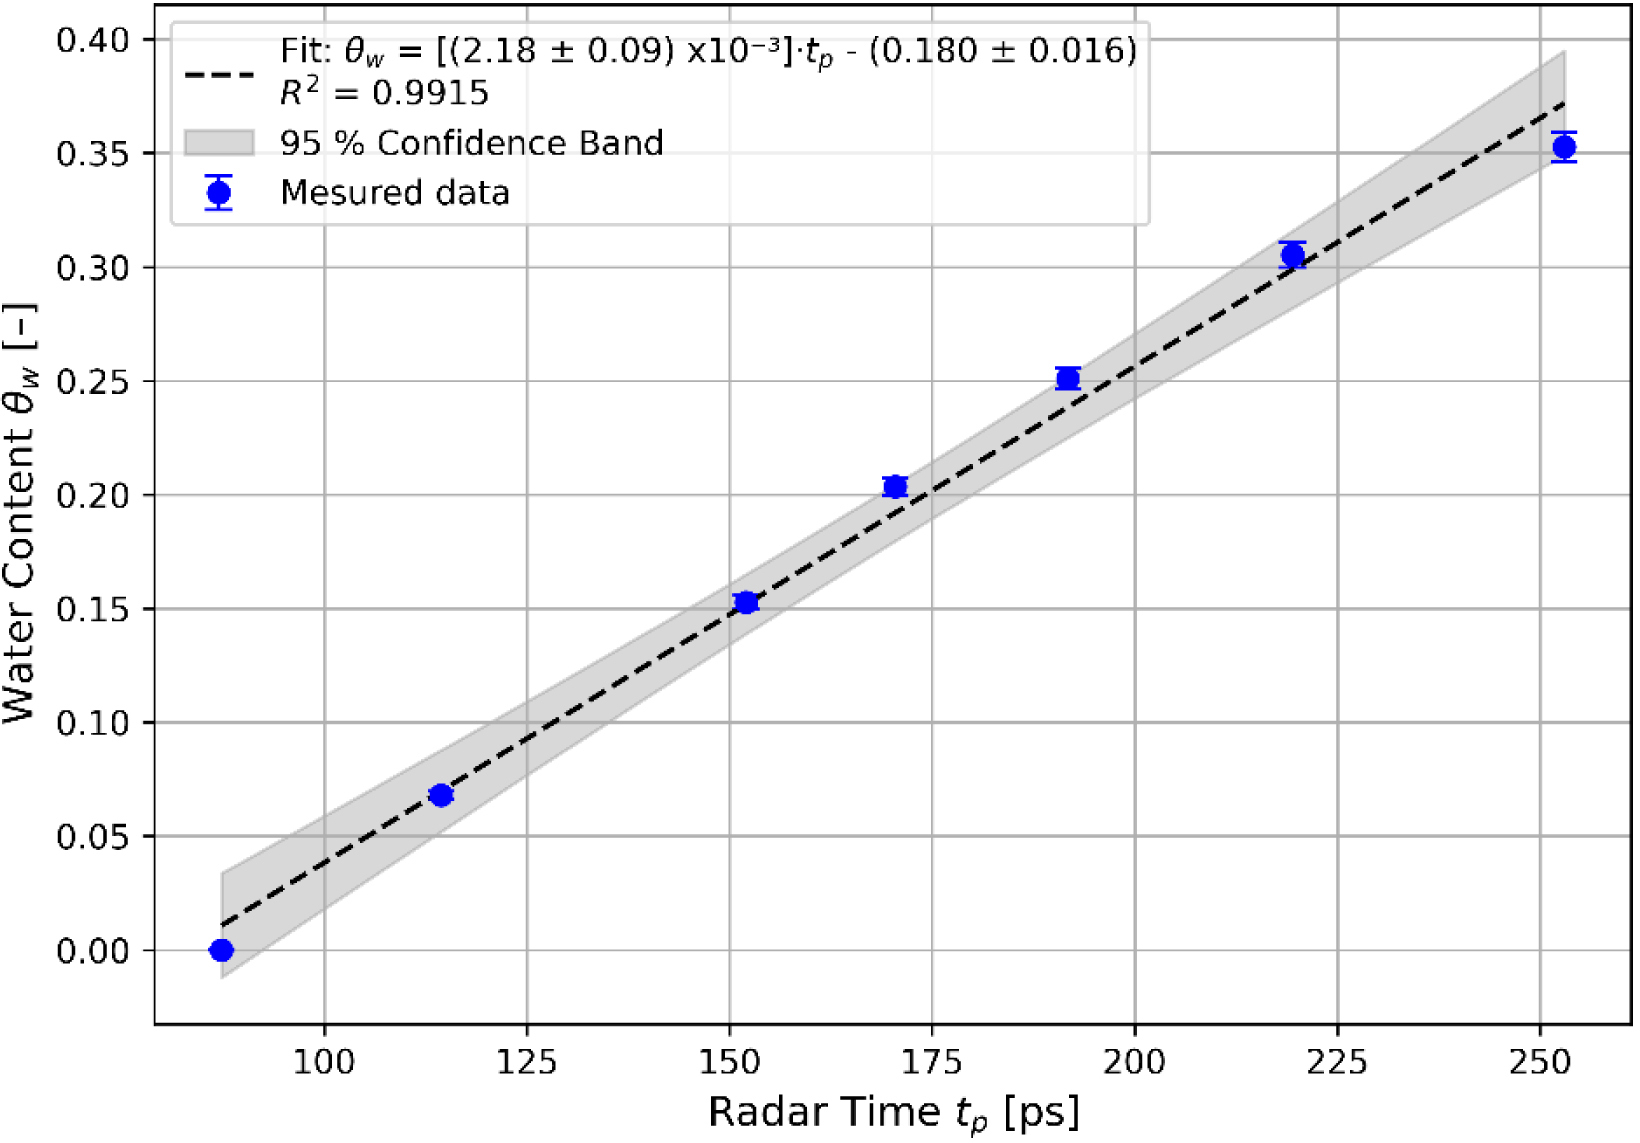
The choice of a linear calibration model is further supported by the manufacturer’s calibration curves, which show that for a wide range of granular materials (from fine to coarse sands, silts, and lightweight aggregates) the relationship between moisture content and radar time remains approximately linear between 0% to 50% volumetric water content. Since the porosity of our test sands (P100 and P2040) limits their maximum volumetric water content to approximately 33%–37%, all measurements fall within this linear regime. Additionally, the NE34 reference sand used in the ex situ calibration shares similar grain size and mineral composition with P100, reinforcing the applicability of the observed linear trend. As both test sands exhibit similar physical characteristics and operate within the same moisture range, the use of a two-point linear calibration is both technically sound and practically efficient.
2.3. Porous media
The porous media selected for this study were two quartz sands, P100 and P2040, which were also used in previous research on the influence of wettability on water retention curves in unconsolidated porous media (Schäfer, Perez, et al., 2025). In our work, only the water-wet versions of these materials were studied. Both sands consist primarily of high-purity silica with minimal fines, and were chosen to represent contrasting grain size distributions and pore structures while maintaining well-sorted textural properties.
The grain size distributions of P100 and P2040 sands, characterized using laser diffraction and reporting diameters as volume-equivalent spheres, are shown in Figure 3. The P100 sand has a median grain diameter (d50) of 0.21 mm and is classified as a fine sand according to the United States Department of Agriculture (USDA) soil classification system. The P2040 sand, with a larger d50 of 0.65 mm, is considered coarse sand. The uniformity coefficients (d60/d10) are approximately 1.59 for P100 and 1.45 for P2040, indicating that both materials are well sorted, with P2040 displaying a slightly narrower size distribution. Both sands are naturally water-wet and were used without any surface treatment or aging. The grain morphology is angular to sub-angular, promoting a stable packing structure. The main physical properties of both sands, including porosity, particle density, and hydraulic conductivity, are summarized in Table 1.
Grain size distribution curves for P2040 and P100 sands. The finer P100 exhibits a left-shifted distribution compared to the coarser P2040, reflecting differences in median grain diameter and sorting relevant for permeability analysis. According to the particle size analysis, P100 is composed entirely of grains between 50 and 500 μm, with 0.86% between 50–100 μm, 41.07% between 100 and 200 μm, and 58.07% between 200 and 500 μm. In contrast, P2040 is dominated by coarser fractions, with 82.26% between 200 and 500 μm, 13.63% between 500 and 1000 μm, and 4.11% between 1000 and 2000 μm.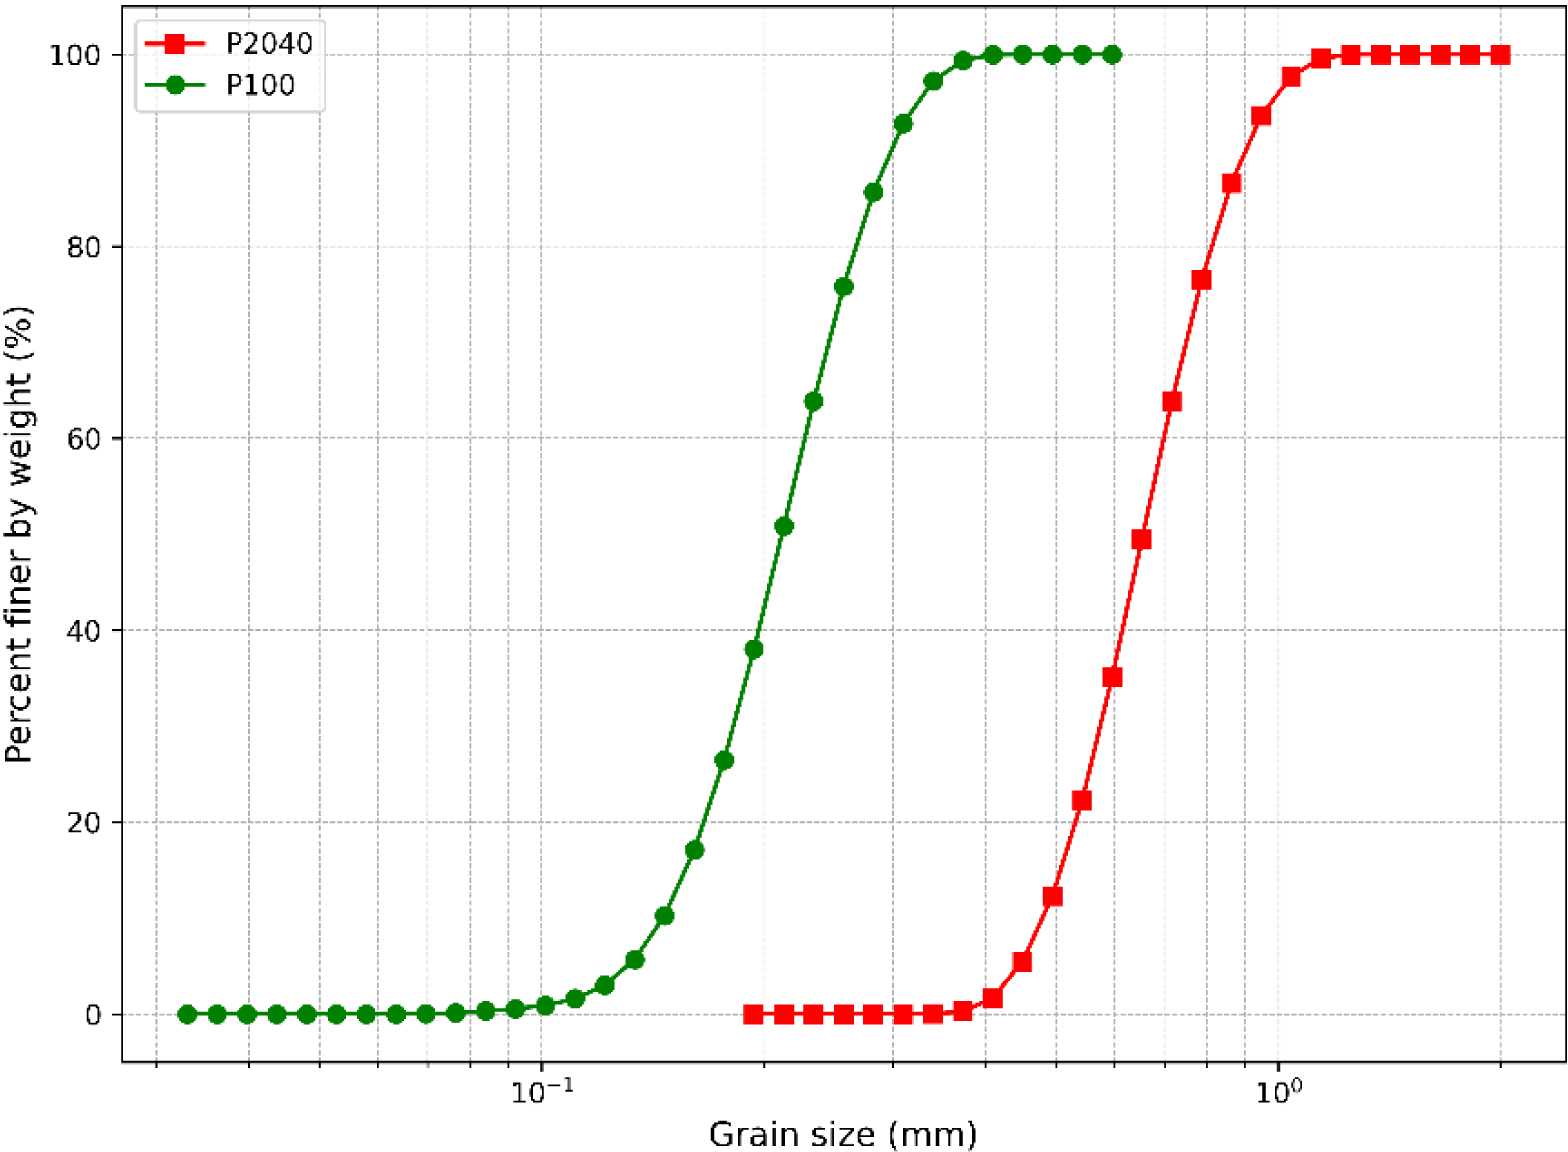
Physical properties of the sands used in the study (Schäfer, Perez, et al., 2025)
| Porous media | P100 | P2040 |
|---|---|---|
| Hydraulic conductivity (K) (m⋅s−1) | 1.52 × 10⁻⁴ | 2.26 × 10⁻³ |
| Kw (Sw,mp) (m⋅s−1)∗ | 1.44 × 10⁻⁴ | 1.5 × 10⁻³ |
| Permeability (m2) | 1.48 × 10⁻¹¹ | 2.20 × 10⁻¹⁰ |
| Soil particle density (g⋅cm3) | 2.55 | 2.59 |
| Porosity (-) | 0.368 | 0.366 |
∗Value obtained during this study.
3. Experimental methodology
This section outlines the experimental protocol and methodology adopted to accurately determine relative permeability curves in the unconsolidated porous media under study. The setup and sensors described previously (Section 2) were used under controlled steady-state conditions, complemented by additional elements described below.
3.1. Preparation of experimental series
Each experimental series began with the preparation of sand columns (P100 and P2040) using a dry-packing procedure in uniform layers. The sand was compacted consistently to avoid preferential flow paths and ensure reproducible packing density across experiments. Prior to saturation with distilled water, nitrogen gas was gently injected from the column base to effectively replace the air. The subsequent upward injection of distilled water enabled the efficient dissolution of nitrogen, resulting in thorough and uniform water saturation throughout the column. The total distilled water volume required to reach this fully saturated condition was used to calculate the in situ porosity, which served as a reference for determining water saturation throughout the experiments.
3.2. Drainage and imbibition protocol
Following the initial saturation of the column with water (primary imbibition), the experimental protocol proceeded with a primary drainage step. The purpose of this primary drainage was to determine the irreducible water saturation (Swi), representing the lowest achievable water saturation under experimental conditions. To accomplish this, the outflow reservoir was abruptly lowered, applying immediate suction at the column base. The final height to which the reservoir was lowered depended on the porous medium used, as each sand type was paired with a porous membrane of a specific air-entry value (approximately 100 cm for P100 and 50 cm for P2040, see Section 2.1). These values constrained the maximum suction that could be imposed without causing a gas breakthrough. This drainage condition was maintained for an extended period of time to ensure complete drainage, thereby accurately defining Swi.
Subsequently, a secondary imbibition was initiated. During this step, water was slowly reintroduced into the column by gradually raising the outflow reservoir, allowing saturation to progressively increase until reaching a new maximum saturation value (Sw,max = 1 − Sgr), limited by trapped residual gas (Sgr). Pressure and saturation were continuously recorded, permitting the construction of the secondary imbibition branch of the water retention curve.
At the condition of maximum saturation, a steady-state flow regime was established by injecting distilled water from the top of the column at a constant rate, while simultaneously lowering the outflow reservoir to the level of the column base. This imposed a controlled pressure gradient across the medium. Steady-state conditions were verified by two criteria: (i) the inflow rate matched the outflow rate, as continuously recorded by the analytical balance; and (ii) the pressure readings from the sensors stabilized over time. Also, a visible water film was maintained at the top of the column. The hydraulic conductivity (Kw) was then calculated based on these conditions. This value of Kw, obtained at Sw,max water saturation, is referred to as the matching point conductivity Kw (Sw,mp). It serves as the reference used to normalize all subsequent hydraulic conductivity measurements at lower saturation levels. Sw,mp is defined as the matching point saturation, and corresponds to the maximum water saturation Sw,max obtained after this secondary imbibition.
A subsequent main drainage was then executed by incrementally decreasing the saturation through controlled stepwise lowering of the outflow reservoir, allowing water to exit while also reducing the water injection rate at the top. At each drainage step, the column was allowed to reach full equilibrium, defined operationally as a variation of less than 1% in both pressure difference (Δp) and water rate over a 10-min interval, facilitating a precise determination of hydraulic conductivity.
Following the main drainage, a corresponding main imbibition cycle was performed by gradually raising the outflow reservoir and water injection rate, repeating the steady-state hydraulic conductivity measurements at increasing saturation levels.
Finally, after completing these main cycles, a last secondary drainage step was conducted to establish the drainage branch of the water retention curve. For this drainage curve, the column was first fully saturated and then subjected to a single-step depression: the outlet reservoir was rapidly lowered, and suction was applied at the base of the column. The system was left undisturbed for an extended period, allowing the internal pressure to equilibrate. Capillary pressure (Pc) was determined from the mean of the two pressure transducer readings (P1 and P2) providing a reliable representation of the average pressure within the soil profile. This was then paired with water saturation data from the PICO TDR probe to construct the drainage branch of the retention curve. Although true equilibrium conditions are challenging to attain (DiCarlo, 2003), the membrane demonstrated efficient pressure transmission, enabling reliable capillary pressure–saturation measurements at low water content.
This systematic protocol ensured the generation of comprehensive datasets for both water retention curves and water relative permeability characterization under controlled and reproducible experimental conditions.
3.3. Data repeatability and error analysis
To verify reproducibility and assess the reliability of the experimental method, each test was repeated at least twice under identical conditions. Variability in measured pressure, saturation, and flow rates between repeated tests was quantified to estimate measurement uncertainty.
Pressure measurements exhibited standard deviations typically below 5%, while the volumetric water content measured by the PICO TDR probe consistently showed variations of less than 1% between replicate experiments. Flow rates, continuously validated by analytical balance measurements at the column outlet, displayed minor variations due to regular pump calibration.
The most significant sources of uncertainty identified included slight differences in column packing and sensor alignment. To mitigate these, strict procedural consistency was maintained for all experiments, including careful pre-saturation of porous ceramic cups connected to pressure sensors, standardized packing procedures, and consistent TDR insertion positions.
3.4. Quantification of hydraulic conductivity and relative permeability
Hydraulic conductivity (Kw) was determined from steady-state flow conditions at each drainage or imbibition step, applying Darcy’s law as follows:
| \begin {equation}\label {eq2} K_{\mathrm {w}} = (Q*L) / [A*(\Delta z + \Delta p / (\rho *g))]. \end {equation} | (2) |
The relative permeability (krw) was then calculated by normalizing each measured hydraulic conductivity to the one at the matching point saturation (Sw,mp), which corresponds to the highest water saturation achieved after secondary imbibition, accounting for the residual gas saturation (Sgr). The relation is expressed as:
| \begin {equation}\label {eq3} k_{\mathrm {rw}}(S_{\mathrm {w}}) = K_{\mathrm {w}}(S_{\mathrm {w}})/ K_{\mathrm {w}}(S_{\mathrm {w},\mathrm {mp}}). \end {equation} | (3) |
4. Results and discussion
4.1. Real-time data acquisition and grain size influence
During each drainage step, both pressure and saturation values reached clear steady states within the defined 1% fluctuation threshold. The pressure sensors exhibited stable, low-noise signals, and the PICO TDR probe delivered continuous water content readings. This stability ensured confidence in the calculated values of hydraulic conductivity at each saturation level. No sensor drift or transient flow behaviour was observed during the steady-state plateaus, confirming the reliability of the experimental protocol.
The coarser P2040 sand exhibited higher permeability and a smoother transition in saturation compared to the finer P100 sand, which displayed steeper gradients and lower water mobility. This behaviour is consistent with the influence of grain size on pore structure: coarser media tend to have wider pores, reduced capillary forces, and enhanced fluid flow. The finer P100 sand, by contrast, has a more constricted pore network, resulting in greater resistance to drainage and lower Kw values. These observations underscore the strong influence of grain size distribution on relative permeability behavior.
4.2. Experimental determination of relative permeability curves
The experimentally determined water relative permeability curves krw(Sw) for P100 and P2040 sands are shown in Figures 4a and 4b, respectively. Both drainage and imbibition branches were captured. The curves were normalized using the matching point hydraulic conductivity (Kw,mp) (Table 1), and plotted as a function of effective water saturation Swe. For both sands, the permeability decreased monotonically with decreasing saturation.
Experimental data on water relative permeability, krw, as a function of effective water saturation, Swe. (a) P100 sand: water relative permeability curves for drainage (red circles) and imbibition (blue triangles), normalized by the matching-point hydraulic conductivity Kw,mp. (b) P2040 sand: corresponding water relative permeability curves for the coarser porous medium. For both sands, the curves show a monotonic decrease of krw with decreasing Swe, and limited hysteresis between drainage and imbibition.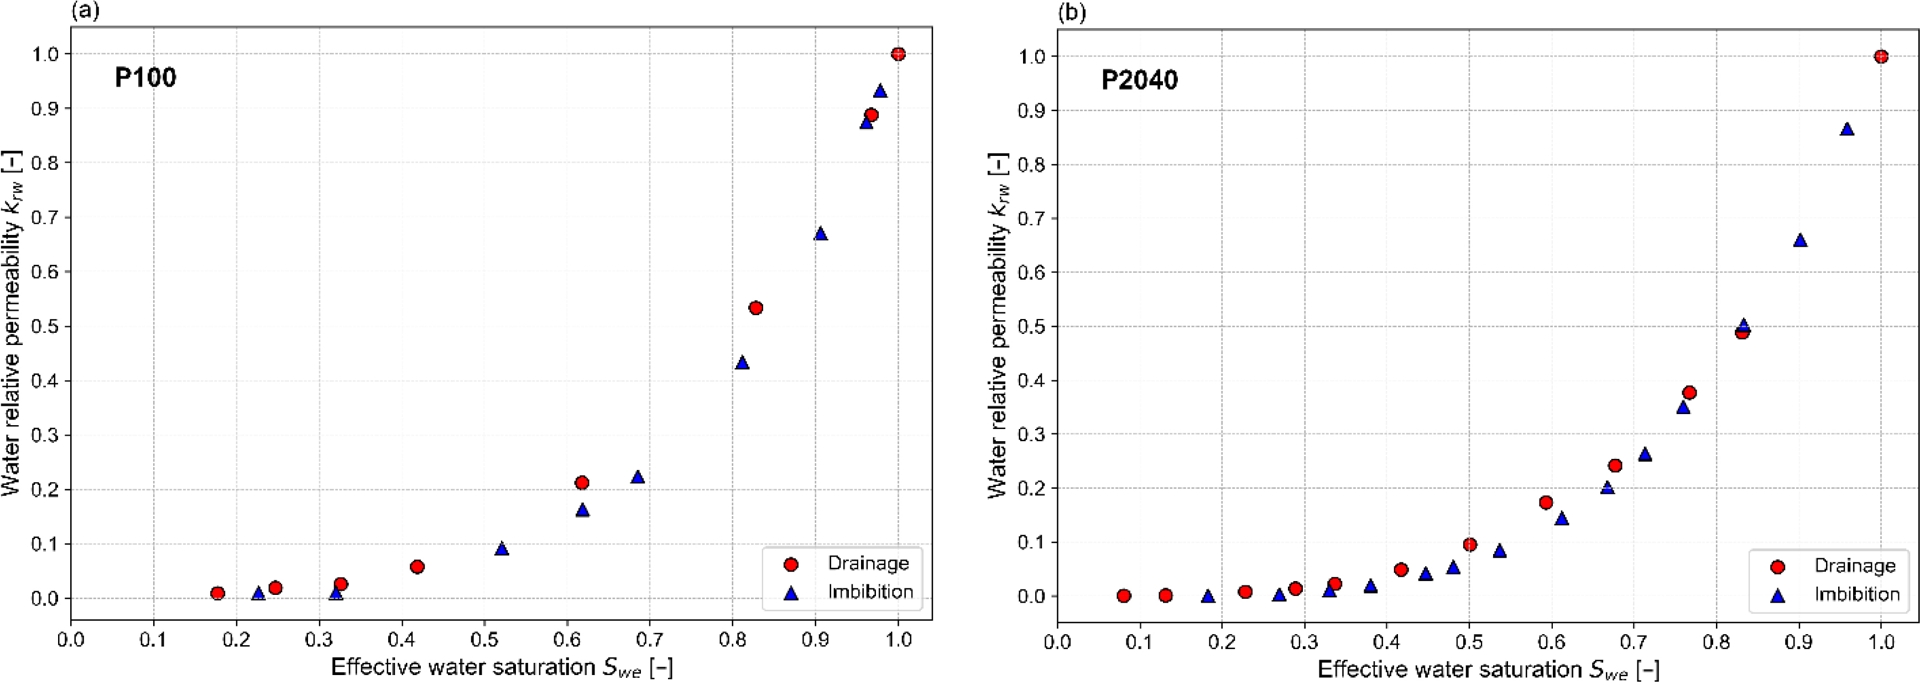
Interestingly, P100 exhibited higher krw values at a given effective saturation compared to the coarser P2040 sand. While hydraulic conductivity (Kw) is indeed greater in P2040 due to its larger pore sizes, the relative permeability reflects the ease with which the wetting phase flows relative to the total permeability. The P100 sand likely supports better wetting-phase continuity, with more uniform pore spaces that promote film flow and reduce flow resistance. In contrast, the broader pore size distribution in P2040 may hinder the connectivity of the water phase, especially at intermediate saturations.
For both sands, the difference between drainage and imbibition branches was minimal, indicating limited hysteresis under water-wet conditions. This minimal hysteresis is attributed to the water-wet nature of the sands, the absence of wettability alteration, and the careful control of boundary conditions during flow reversal. Under these conditions, pore-scale displacement processes appear largely reversible, and capillary entrapment effects are minimized. These results support the assumption that, in homogeneous water-wet media, krw can be described as a near single-valued function of effective saturation. This observation is consistent with the results reported by Moghadasi et al. (2015), who also observed minor hysteresis in water relative permeability. Notably, in both studies, the imbibition curve lies slightly below the drainage curve, reinforcing the general trend that hysteresis effects are modest and saturation-driven under water-wet conditions.
4.3. Predictive modelling using van Genuchten parameters from water retention curves
To assess the predictive capability of the Mualem–van Genuchten model for relative permeability, we used 𝛼 and n parameters derived independently from water retention measurements (Figure 5) (Van Genuchten, 1980; Luckner et al., 1989). These measurements were performed on the same sands under steady-state conditions during secondary drainage and secondary imbibition cycles.
Main drainage capillary pressure curves and van Genuchten model fits for (a) P100 sand and (b) P2040 sand. Experimental data are shown as red dots, fitted van Genuchten curves as solid blue lines, and shaded areas represent the 95% confidence bands. Fitted parameter values (𝛼, n) and their uncertainties are indicated in the figure legends.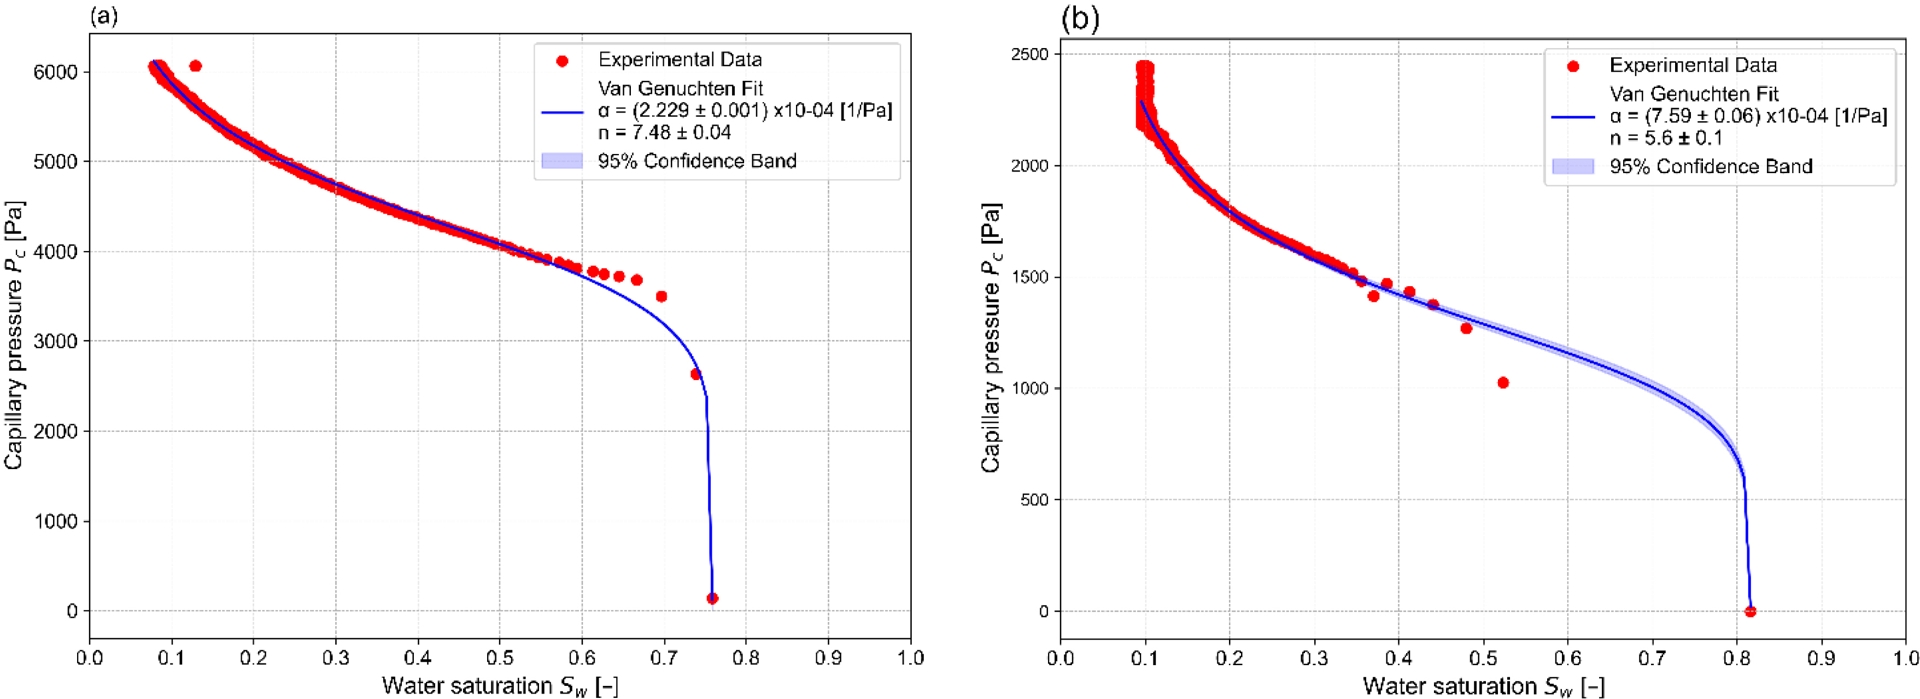
The fitted retention curve provided the 𝛼 and n parameters, which were then used directly in the Mualem–van Genuchten model for predicting relative permeability (Van Genuchten, 1980). The water retention behaviour was described using the following van Genuchten equation:
| \begin {equation}\label {eq4} P_{\mathrm {c}} = (1/{\alpha })* [S_{\mathrm {we}}^{(-n/(n-1))}-1]^{(1/n)}, \end {equation} | (4) |
| \begin {equation}\label {eq5} S_{\mathrm {we}} = (S_{\mathrm {w}} - S_{\mathrm {wi}}) / (S_{\max } - S_{\mathrm {wi}}). \end {equation} | (5) |
The same 𝛼 and n values obtained from fitting the retention curves were then inserted into the Mualem–van Genuchten model for relative permeability:
| \begin {equation}\label {eq6} k_{\mathrm {rw}} (S_{\mathrm {we}}) = S_{\mathrm {we}}^{(1/2)} * [1 - (1 - S_{\mathrm {we}}^{(1/m)})^{m}]^{2}, \end {equation} | (6) |
Water relative permeability to water (krw) as a function of effective water saturation (Swe) for (a) P100 sand and (b) P2040 sand. Experimental data are shown for drainage (red circles) process. Solid lines represent the predicted krw curves obtained from the Mualem–van Genuchten model using the fitted capillary pressure parameters presented in Figure 5. Shaded areas indicate the 95% confidence intervals of the model predictions; for P100, the uncertainty band is extremely narrow and thus barely visible.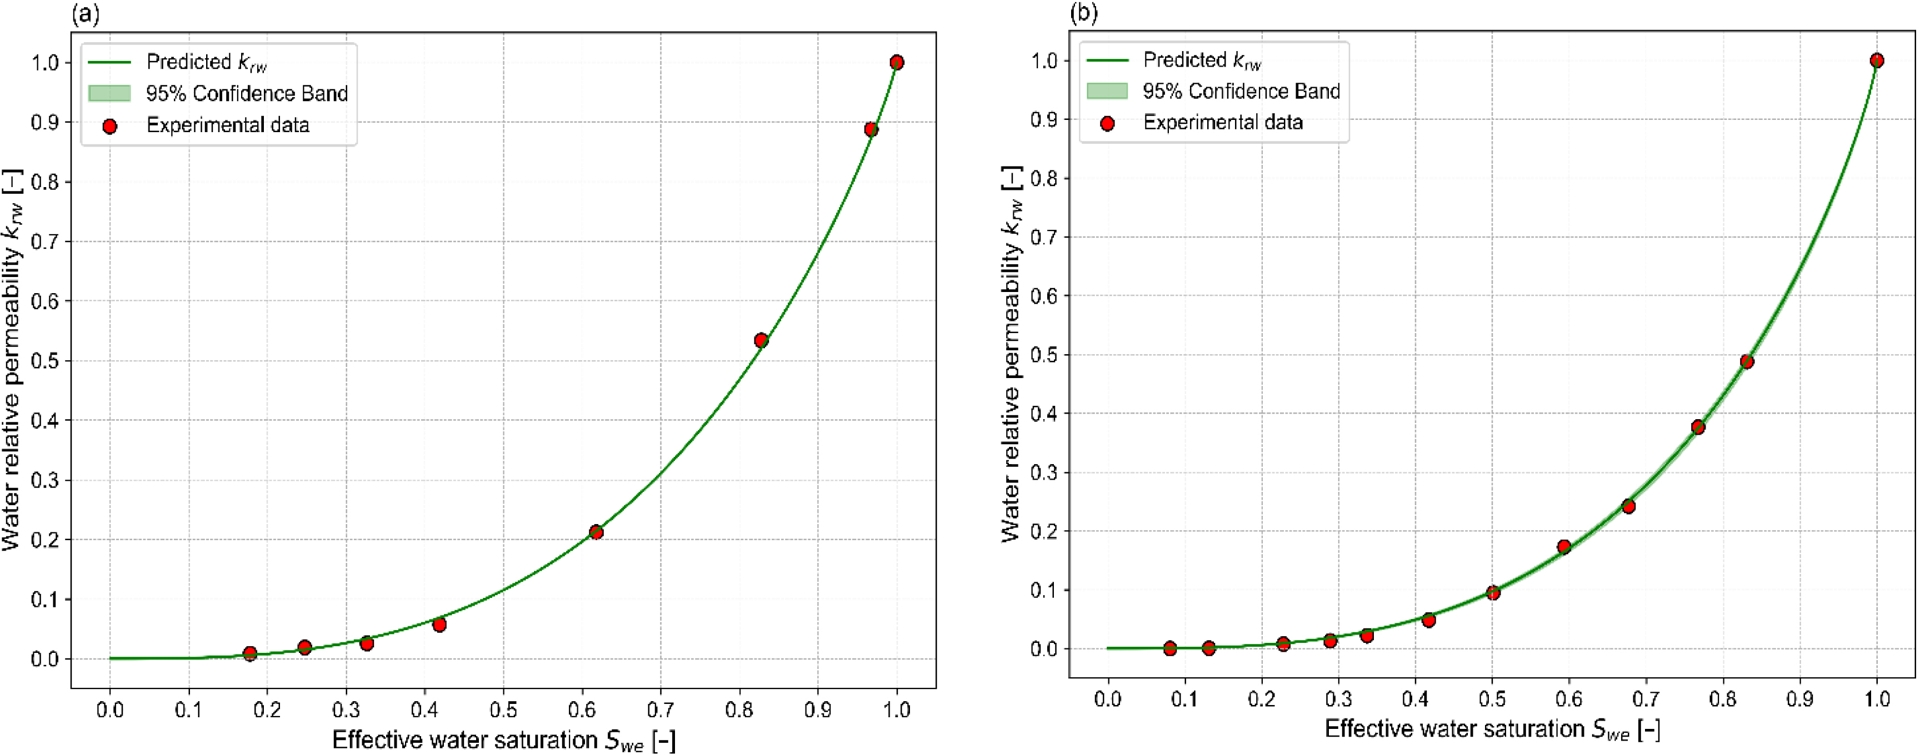
5. Conclusions
Experimental determination of capillary pressure and water relative permeability in unconsolidated porous media remains a critical challenge for accurately modelling multiphase flow. While previous studies often relied on separate or indirect measurements of these constitutive relationships, this work introduced an integrated experimental setup capable of simultaneously quantifying both properties under steady-state flow conditions.
Our innovative experimental setup successfully combined in situ water content measurements via a PICO TDR probe with direct hydraulic gradient monitoring using dual pressure transducers. This approach yielded precise in situ capillary pressure–saturation curve (Pc–Sw) and relative permeability (krw–Sw) data for two unconsolidated quartz sands (P100 and P2040), differing significantly in grain size and permeability. The experimental protocol, including primary drainage cycle, secondary imbibition cycle, main drainage-imbibition cycles, and a last drainage step allowed trustworthy quantification of the key water relative permeability without significant hysteresis effects. These cycles were essential for defining irreducible water saturation (Swi), maximum saturation (Sw,max), and the matching-point conductivity, thereby enabling a consistent normalization of krw. In addition, the secondary imbibition cycle and the last drainage step sequence were used to establish the Pc–Sw curve.
A key feature of this methodology was the use of in situ volumetric water content measurements to obtain saturation values, rather than relying on full-column gravimetric weighing. While this represents a local measurement, two main factors ensure its reliability in our setup: (i) the sands studied (P100 and P2040) are well-sorted and homogeneous; (ii) the local TDR readings were consistent with porosity values independently determined from total water volume at saturation. Therefore, the local measurements can be considered representative of the column under the conditions studied. In contrast, the global balance method, which calculates water content from cumulative outflow, may slightly overestimate the average water content for a given pressure drop. This is explained by gravitational redistribution, as water tends to accumulate near the base of the column, especially above the porous membrane, leading to higher apparent values than inferred from local pressure readings. This approach permitted monitoring throughout the experiment without disrupting the packing or flow.
In contrast to studies constrained by a unit hydraulic gradient (i.e., i = 1), our experiments allowed the gradient to evolve naturally. Hydraulic gradients in our setup ranged from approximately 0.5–2, depending on boundary conditions and saturation state. As a result, it was not necessary to enforce pressure equality between the two transducers (i.e., P1≠P2), and the full pressure differential was used in conductivity calculations.
Analysis of the resulting retention curves confirmed the suitability of the van Genuchten model, with independently derived parameters (𝛼, n) closely matching literature values reported by Schäfer, Perez, et al. (2025). This agreement confirms the consistency of our protocol, emphasizing the accuracy and predictive value of in situ measurements in porous media studies.
The reproducibility of our measurements was systematically validated through replicated experiments conducted under identical conditions, demonstrating minimal variability and thus ensuring confidence in the reliability and accuracy of the dataset. Such reproducibility is essential, particularly when applying experimental data to refine numerical simulations of fluid transport and contaminant migration in unconsolidated porous systems.
From a methodological perspective, the integrated setup offers significant potential for future studies. Extending the current methodology to explore scenarios of different wettability, such as oil-wet or mixed-wet conditions, would significantly advance understanding of how wettability affects water relative permeability and retention properties. Such studies would have direct implications for environmental engineering, particularly in soil remediation applications involving contaminants like hydrocarbons, where wettability alterations are commonly observed and can greatly influence remediation efficiency.
Ultimately, the experimental data obtained in this study provides a foundation for the development and validation of advanced numerical models. Accurate in situ characterization of both retention and relative permeability properties will greatly enhance the predictive capability of numerical codes used for environmental and subsurface flow management. Future numerical implementations could specifically incorporate dynamic and wettability-dependent constitutive relationships derived from this experimental approach, significantly improving model realism and reliability for practical applications in groundwater management, contaminant transport modelling, and multiphase flow simulations.
Acknowledgements
This research was funded by the French National Centre for Scientific Research (CNRS) through the International Research Project « CONTINUUM », established between ITES and COIFPM. We are also grateful for the financial support provided by the University of Strasbourg and for the administrative and technical support from the University of Wyoming. We would like to express our sincere thanks to the Doctoral School (ED 413) for the funding of the PhD thesis of KH. RT also acknowledges the support of the Research Council of Norway through its Centers of Excellence funding scheme, project number 262 644, and the support of the CNRS and IRP D-FFRACT. Special thanks are also extended to Pascal Friedmann, for the development of experimental cells, and to Martine Trautmann of the EOST soil analysis laboratory, University of Strasbourg, for measuring the particle size distribution of the sands using the laser diffraction method, and to Michelle Church for the proofreading of the manuscript.
Declaration of interests
The authors do not work for, advise, own shares in, or receive funds from any organization that could benefit from this article, and have declared no affiliations other than their research organizations.