


 CC-BY 4.0
1. Introduction
Industrial Pb emission in the lower atmosphere has impregnated the world population, mostly from smelting activities and the use of leaded gasoline [Flegal and Smith 1992, 1995; Janssens and Dams 1975; NRC 1993; Nriagu 1990; Nriagu and Pacyna 1988; Patterson 1980; Von Storch et al. 2003]. Lead mimics calcium (group IIA cation) pathways and is highly toxic for humans [i.e., Canfield et al. 2003; Grandjean 2010; Lanphear et al. 2005; Needleman 2004; Tong et al. 1998]. Likewise, pollutant Pb has pervaded all of the marine ecosystems [Boening 1999; Dell’Anno et al. 2003; Durrieu de Madron et al. 2011; Halpern et al. 2008] and is widely distributed in fish tissues [Alves et al. 2006; Nussey et al. 2000; Rogers et al. 2003; Zhong et al. 2017]. Its toxicity is discernible in osteichthyes [Authman et al. 2015; Birge et al. 1981; Burger et al. 2005; Danovaro 2003; Demayo et al. 1982; Heath 1987; Hodson et al. 1984; Jakimska et al. 2011a; Lee et al. 2019; Mallat 1985; Mason 2013], also referred to as bony fish (about 95% of all fish population). Muscle and liver tissues are commonly used to characterize fish Pb accumulation [MacDonald et al. 2002; Ploetz et al. 2007; Velusamy et al. 2014] and risks of fish consumption for the human health [Castro-Gonzalez and Méndez-Armenta 2008; Domingo et al. 2007; Falco et al. 2006; Han et al. 1998; Llobet et al. 2003; Viera et al. 2011]. Meanwhile, the metabolism and toxicokinetics of Pb in fish are affected by environmental (metal bioavailability, seawater physico-chemistry, regional productivity, anthropogenic stress) and biological (age, sex, size, trophic level, nutrition) factors [Burger et al. 2014; Erasmus 2004; Jakimska et al. 2011a,b; Kojadinovic et al. 2007; Mathews and Fisher 2009; Pourang 1995]. Celik et al. [2004] investigated fish Pb content from the eastern Mediterranean (Turkish coast) and northeastern Atlantic fishing grounds (Faroe and Shetland Islands region) using 328 and 72 specimens for the Mediterranean and Atlantic cohorts, respectively (from 49 and 19 species in the Mediterranean and Atlantic). In spite of the limited number of specimens and the mixed species involved, they evidenced a 12 time increase in mean Cd and Pb contents from fish muscles collected in the eastern Mediterranean. In order to further investigate regional disparities in Pb content from bony fish tissues, and the effect of environmental policies on the health of the marine ecosystems, it is necessary to have access to multiple records with time from various marine locations, both at global and regional scales. As of 1974, there were merely 30 papers dealing with Pb burden and toxicity in all marine fauna [Corrill and Huff 1976]. Growing evidences of Pb toxicity have prompted distinct reports on its accumulation in bony fish (see reference in Table S1) of which the few available recent reviews are either geographically circumscribed and/or limited to a single genus/species or to concentration exceeding the maximum allowable limits for consumption [Agusa et al. 2007; Ahmed et al. 2018; Bosch 2015; Castro-Gonzalez and Méndez-Armenta 2008; Cunningham et al. 2019; Hussain et al. 2014; Renieri et al. 2014]. One of the most comprehensive approach from the National contaminant biomonitoring program was conducted between 1965 and 1987 in the US on whole freshwater fish mostly [Schmitt and Brumbaugh 1990]. Hitherto, there is no specific review of accumulated Pb in bony fish muscle and liver tissues that would include all of the main geographical marine areas and various species.
Our objective is to compile the most updated chronicle of Pb concentration from both muscle and liver in bony fish that could be used as pollution bioindicators in various areas and provide insights on intra- and interspecies Pb concentration differences. We expound the use of this cluster with case studies that include Pb accumulation levels and disparities in bony fish from various oceanic regions, its distribution between muscle and liver tissues, and the time transient shift of fish Pb burden in a Mediterranean coastal polluted hot spot.
2. Methodological approach
2.1. The fish record
Descriptive statistics (Mean, Standard Deviation SD, Median, InterQuartile Range IQR, Skewness SKW) of Pb levels in bony fish muscles from various oceanic and Mediterranean basins
| ALL | ATL | PAC | IND | MED | MED1 | MED2 | MED3 | MED4 | MED5 | IND1 | |
|---|---|---|---|---|---|---|---|---|---|---|---|
| n | 22190 | 4021 | 2894 | 3934 | 11341 | 3645 | 2410 | 3114 | 738 | 1434 | 1220 |
| Mean | 0.26 | 0.06 | 0.14 | 0.21 | 0.39 | 0.09 | 0.20 | 0.23 | 0.82 | 1.40 | 0.41 |
| (SD) | (0.76) | (0.12) | (0.13) | (0.37) | (1.02) | (0.17) | (0.22) | (0.68) | (1.30) | (1.99) | (0.51) |
| Median | 0.08 | 0.01 | 0.14 | 0.08 | 0.12 | 0.04 | 0.12 | 0.14 | 0.19 | 0.67 | 0.21 |
| IQR | 0.15 | 0.03 | 0.12 | 0.16 | 0.22 | 0.05 | 0.14 | 0.20 | 0.14 | 1.10 | 0.42 |
| SKW | 7.4 | 3.6 | 2.1 | 3.5 | 5.6 | 5.1 | 2.0 | 9.0 | 2.5 | 2.7 | 2.6 |
Descriptive statistics (Mean, Standard Deviation SD, Median, InterQuartile Range IQR, Skewness SKW) of Pb levels in bony fish livers from various oceanic and Mediterranean basins
| ALL | ATL | PAC | IND | MED | MED1 | MED2 | MED3 | MED4 | MED5 | IND1 | |
|---|---|---|---|---|---|---|---|---|---|---|---|
| n | 5954 | 1143 | 689 | 2136 | 1986 | 204 | 207 | 257 | 260 | 1058 | 629 |
| Mean | 1.21 | 0.10 | 0.27 | 0.51 | 2.90 | 0.15 | 1.84 | 0.45 | 0.49 | 4.83 | 0.75 |
| (SD) | (3.21) | (0.12) | (0.36) | (0.61) | (5.08) | (0.08) | (1.59) | (0.85) | (0.67) | (6.28) | (0.89) |
| Median | 0.31 | 0.06 | 0.09 | 0.43 | 0.76 | 0.09 | 1.33 | 0.03 | 0.09 | 2.36 | 0.51 |
| IQR | 0.63 | 0.07 | 0.29 | 0.40 | 3.02 | 0.12 | 1.57 | 0.65 | 0.89 | 5.62 | 0.52 |
| SKW | 4.9 | 2.8 | 2.7 | 6.4 | 2.64 | 0.6 | 1.6 | 3.2 | 1.2 | 1.7 | 5.6 |
Descriptive statistics (Median, InterQuartile Range IQR) of Pb levels in n paired bony fish muscle (MDM)–liver (MDL) from various oceanic and Mediterranean basins
| ATL | PAC | IND | MED | MED1 | MED2 | MED3 | MED4 | MED5 | IND1 | |
|---|---|---|---|---|---|---|---|---|---|---|
| n | 735 | 632 | 2075 | 1952 | 182 | 197 | 248 | 267 | 1058 | 576 |
| MDM | 0.01 | 0.06 | 0.08 | 0.27 | 0.05 | 0.51 | 0.01 | 0.02 | 0.86 | 0.15 |
| IQRM | 0.01 | 0.22 | 0.11 | 1.10 | 0.09 | 0.5 | 0.18 | 0.33 | 1.19 | 0.11 |
| MDL | 0.05 | 0.09 | 0.43 | 0.86 | 0.09 | 1.18 | 0.02 | 0.14 | 2.36 | 0.51 |
| IQRL | 0.27 | 0.39 | 3.02 | 0.12 | 1.24 | 0.64 | 1.33 | 5.63 | 0.52 | 0.27 |
Liver and muscle medians (ppm) in pre- (PRE) and post- (POST) 2000 periods along with the number of analyses (npre,npost)
| ALLM | ATLM | PACM | INDM | MEDM | ALLL | ATLL | PACL | INDL | MEDL | ||
|---|---|---|---|---|---|---|---|---|---|---|---|
| npre | 6886 | 1973 | 1935 | 1391 | 1587 | 1916 | 728 | 419 | 429 | 340 | |
| PRE | 0.099 | 0.014 | 0.145 | 0.032 | 0.169 | 0.106 | 0.049 | 0.144 | 0.106 | 3.288 | |
| IQR | 0.15 | 0.02 | 0.04 | 0.10 | 0.89 | 0.65 | 0.05 | 0.66 | 0.15 | 3.64 | |
| npost | 15304 | 2048 | 959 | 2543 | 9754 | 4038 | 415 | 270 | 1707 | 1646 | |
| POST | 0.076 | 0.011 | 0.076 | 0.086 | 0.100 | 0.405 | 0.072 | 0.046 | 0.432 | 0.420 | |
| IQR | 0.17 | 0.05 | 0.25 | 0.17 | 0.19 | 0.63 | 0.09 | 0.14 | 0.21 | 1.82 | |
| MW (p) | 0.88 | 0.66 | <0.001 | <0.001 | <0.001 | <0.001 | <0.05 | <0.001 | <0.001 | <0.001 | |
Mann–Whitney test (MWp) are used to compare medians between the two periods.
Our literature review includes Pb analyses in bony fish muscle and liver tissues (Supplementary Table S1) from 203 publications that were searched using recent peer-reviewed publication from the Web of Science and references therein. In most cases, only papers published in English are considered, and listed in Table S1. Marine records are selected from the world oceans and some enclosed seas with the exception of closed bay or estuaries, coastal wetlands, mangroves, and ports to avoid the immediate proximity of polluted ecosystems that would significantly bias calculated means and medians within each marine area. Research studies are localized using the Food and Agricultural Organization of the United Nations (FAO-UN) major fishing areas, subareas, and divisions for the world oceans [FAO-UN 2021], and the General Fisheries Commission [FAO GFCM 2009] for the Mediterranean and the Black Sea. We provide further geographic references such as regional seas, islands and/or countries when available. Means, sum of analyses and dates of sampling are reported for each fish cohort. The number of analyses is taken into account to ascertain statistical description of oceanic means and allow rational correlation thereof (as seen in Tables 1a, 1b, 2 and 3). In few occurrences when the cohort number is missing and cannot be reasonably estimated, it is assumed “1” by default. We do not take into account studies showing poor accuracy (based on international standards), concentration ranges or graphs only, absence of species names and whole-body analyses. Data are also disregarded when fish sampling regions cannot be assessed on the basis of FAO-UN fishing areas. Individual or composite sample analyses are accepted from a single species. Because most of the fish concentration and associated international Maximum Permissible Limits (MPLs) for fish consumption) are reported in ppm fresh weight, we are compelled to convert dry mass concentrations for statistical analyses based on: Cw = Cd ⋅ [(100 − H)∕100], where Cd and Cw are dry and wet mass concentration (ppm), and H the percentage of humidity (%) in fish organs. The conversion factor (CF) is hence defined as the ratio Cd∕Cw. The CF is variable according to tissues and species [Harmelin-Vivien et al. 2009; Kojadinovic et al. 2007; Magalhaes et al. 2007; Murray and Burt 1969]. We have considered 1390 (muscle) and 87 (liver) CF measurements to infer mean CFs of 4.43 ± 0.24 and 2.64 ± 0.61 for fish muscle and liver, respectively [Bustamante et al. 2003; Cresson et al. 2017; Ergul and Aksan 2013; Escobar-Sanchez et al. 2015; Hellou et al. 1992; Magalhaes et al. 2007; Oehlenschlager 2009; Ong and Gan 2017; Panichev and Panicheva 2015; Siebenaller et al. 1982; Sellami et al. 2018; Tufan et al. 2013]. Our record comprises the Atlantic (ATL), Pacific (PAC), Indian (IND) oceans, and the Mediterranean Sea (MED) which are further divided when sufficient data are available. Hence, the MED area is divided into Western–Central (MED1), Eastern (MED2), Black Sea (MED3), Marmara Sea (MED4) and Iskenderun–Karatas Bay (MED5). The eastern region (MED2) data does not include MED3,4,5 areas. The Indian Ocean (IND) also includes a subarea (IND1) that corresponds to the Persian Gulf. These subregions were assigned on the basis of the available data owing to sufficient independent published studies. This data set will be available online as an open access database for each of the main world oceans, including the Mediterranean Sea and its surroundings along with new relevant biological information such as fish age, and trophic levels when available. Open share groups will be granted for identified users to allow inclusion of missing relevant publication and associated data. As of now, we provide excel sheets (Supplementary Table S1) that contain all of the pertinent data to investigate Pb burden on the basis of species, marine areas, and time trends.
2.2. Statistical approach
(a) Median Pb levels in bony fish from the main marine basins with Maximum Permissible Limits (MPLs). (b) Median Pb levels in bony fish from the Mediterranean basins with Maximum Permissible Limits (MPLs).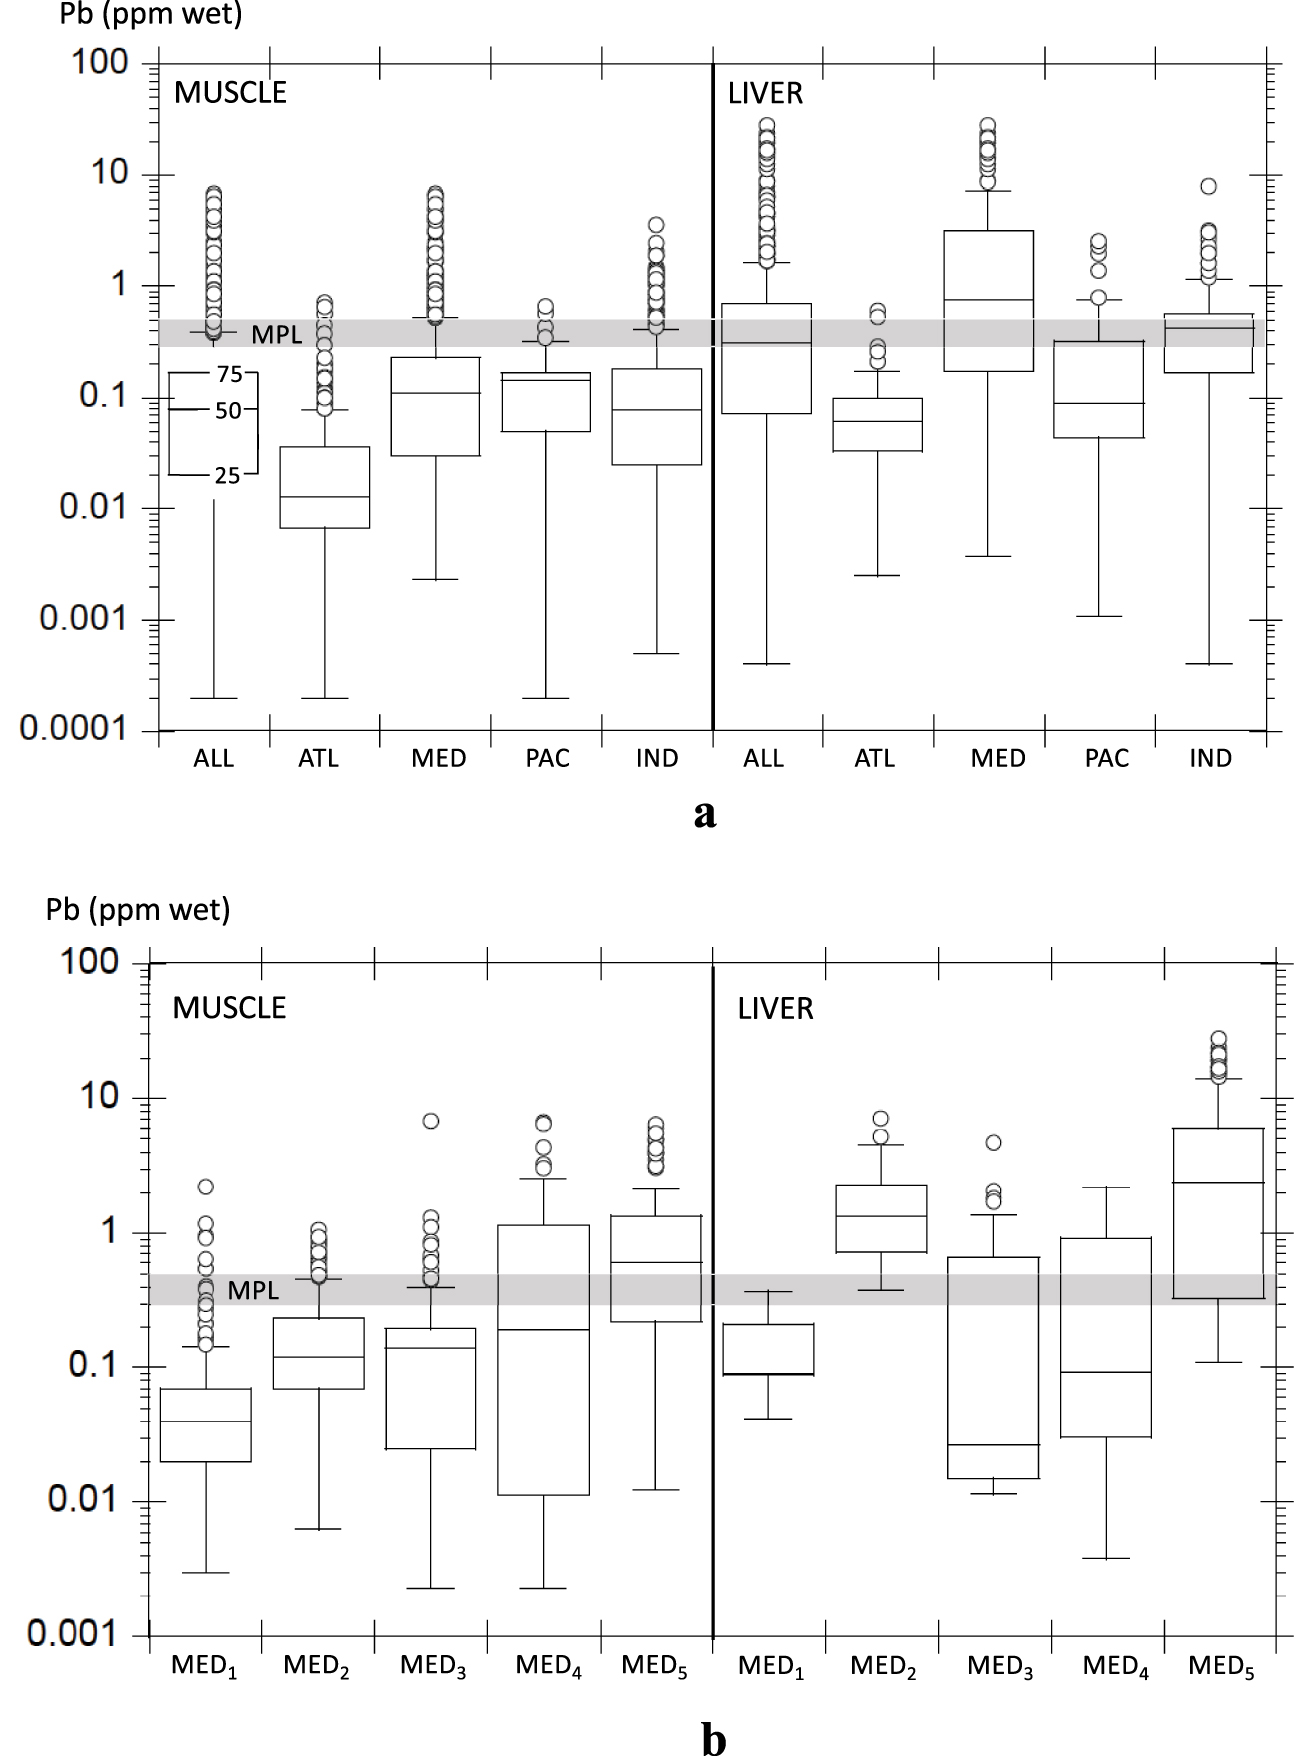
Statistical analyses are carried out using Past 4 statistical package software [Hammer et al. 2001]. We perform descriptive statistics (arithmetic mean, standard deviation, median, interquartile range, skewness, normality tests) and comparisons of bony fish Pb burden between oceanic regions. In order to assess the proper weight to each reported mean shown in Supplementary Table S1, we expand the data set to the total number of analyses for our statistical approach (i.e., 22,190 and 5954 Pb concentrations for muscle and liver, respectively for the complete record). The comparison of Pb levels between both tissues is carried out using paired analyses within the same cohorts and locations in order to avoid bias resulting from noncoupled Pb record. The choice of parametric and nonparametric tests is based on normality test (from Skewness index and Shapiro–Wilkinson test). Normality and comparison tests use the null hypothesis (H0) with a given probability (p). Failing to reject the null hypothesis is dictated here by p > 0.05 (5% chance to detect a false positive). If p < 0.05, then we choose the alternative hypothesis, that is, mean/median differences, non-normal distribution or observed correlations are statistically significant. Statistics are applied to fish Pb concentration from the main and semienclosed marine regions (see all Tables and Figure 1a, b). None of the selected fish cohorts are normally distributed as shown by Skewness indices generally above 2 and Shapiro–Wilkinson test probability below 0.001. Therefore, medians rather than means are favored and concentration comparisons are performed using nonparametric Mann–Whitney test (MW). Data dispersion is assessed from interquartile range (IQR, difference between 75% and 25% percentiles) rather than standard deviation owing to data skewed distribution. Data variability is not easily appraised from boxplot log scales (Figure 1a, b), and is more readily assessed from IQR (see all Tables). Moreover, outliers have a lesser influence on both medians and interquartile ranges than on arithmetic means and associated variances.
3. Results and discussion
3.1. Geographic distribution
We use our database in order to explore the magnitude of fish contamination in various oceanic regions, and to what extent fish’s geographic habitats may explain Pb accumulation in tissues. Because most fish are trawled in coastal regions, we expect our geographic approach to reflect coastal rather than open-sea contamination. Pollutant Pb invasion of coastal marine ecosystems from atmospheric deposition and local industrial (and urban) discharges led to the establishment of MPLs for fish consumption. Nowadays, MPLs (in ppm fresh weight) of Pb in edible fish parts vary from 0.3 ppm in the European Union and the FAO/WHO [CAC 2011; EU 2015] to 0.5 ppm in Canada, Australia, and New-Zealand [CFIA 2014; FSANZ 2013]. These MPLs are compared to Pb medians calculated from our data set (Figure 1). All muscle Pb medians are below the MPL with the exception of MED5 (Iskenderun–Karatas) (Figure 1a, b). Only liver Pb medians from the Mediterranean (MED) and associated regional basins MED2 (Eastern) and MED5 (Iskenderun–Karatas) are above the MPL. Based on the full record (from expanded Supplementary Table S1), we infer that 16% and 10% of muscle Pb analyses are above 0.3 and 0.5 ppm, respectively, while it reaches 50% and 34% for liver Pb analyses. These results emphasize both the preferential metabolic accumulation of pollutant Pb in livers and the anthropogenic insult to Mediterranean bony fish.
Lead medians in bony fish muscles from the world ocean (Table 1a, Figure 1a) are significantly different from each other (Mann–Whitney tests for medians p < 0.001). The lowest concentration, from far, is encountered in the Atlantic (0.01 ppm) and the highest in the Pacific (0.14 ppm). The Atlantic muscle median is within the expected mean Pb content (0.005 to 0.04 ppm) of 1225 fish muscles (C. harengus, S. sprattus, G. morhua) from the Baltic Sea during the 1994–2003 period [Polak-Juszczak 2009]. A more specific geographical approach in the Mediterranean Sea endorses the role of habitat influence in fish contamination with the western–central region (MED1) showing the lowest muscle median (0.04 ppm), while the thoroughly investigated Turkish polluted spot of Iskenderun–Karatas (Med5) exhibits the highest one (0.67 ppm) (Table 1a, Figure 1b). Median Pb levels in muscles increase from the western to the eastern Mediterranean Sea with specific rises in the more confined Black Sea (MED3 0.14 ppm) and Marmara Sea (MED4 0.19 ppm). The Persian Gulf region (IND1) displays among the highest Pb median in bony fish muscles (0.21 ppm) (Table 1b) as expected from the trend observed in other semienclosed areas (MED3,4,5). Lead medians in bony fish livers are generally higher than those in muscles in the main oceanic basins (Table 1a, Figure 1b). Meanwhile, such tissue comparison is best established on the basis of coupled muscle–liver concentration from the same cohorts in order to avoid biases, and is discussed in the next section. The lowest liver Pb median is again encountered in the Atlantic (0.06 ppm), while the Indian Ocean and the Mediterranean Sea display the highest ones (0.53 and 0.76 ppm, respectively) (Table 1b, Figure 1a). The Atlantic liver median (0.06 ppm) is consistent with mean Pb content in 1225 and 1343 fish livers (G. morhua, C. harengus, S. sprattus, P platessa, M. kitt, L. limanda) collected from the southern Baltic Sea (0.004–0.05 ppm) and the northeastern North Sea (0.03–0.17 ppm), respectively, between the early 1990s and 2000s [Green and Knutzen 2003; Polak-Juszczak 2009]. Lead levels in livers are significantly different between each oceanic basins (Mann–Whitney tests for medians p < 0.001). Liver Pb median in the Mediterranean regions is at its lowest in the Black Sea (MED3) (0.03 ppm) where median’s distribution is highly assymetrical (Figure 1b), and, to a lesser extent, in the western–central basin (MED1) and Marmara Sea (MED4) (0.09 ppm) (Table 1b, Figure 1b). The highest Pb levels in livers are found from far in the Iskenderun–Karatas Bay (MED5, 2.36 ppm), while the Persian Gulf (IND1, 0.51 ppm) exhibits Pb median close to IND (0.43 ppm) (Table 1b). Statistical results in liver cohorts for Mediterranean subbasins should be considered with caution owing to the fewer reported analyses (less than 300 for MED1,2,3,4) and their larger data dispersion (see IQRs in Table 1b).
Lead accumulation in fish tissues through water exposure appears much more efficient than dietary pathways [Alsop et al. 2016; Dural et al. 2007; Rozon-Ramilo et al. 2011], although the latter may be enhanced for benthic foragers that may absorb contaminated particles in their alimentary tract [Dallinger et al. 1987]. Different diet habits and trophic levels also induce interspecific bioaccumulation disparities (see review in Jakimska et al. [2011b]). We can explore this question using our database and examine the capability of fish muscle Pb medians from mixed species to mirror regional trends in surface seawater lead content (Pbssw). We compare the Pbssw yearly means between regional seas during the same periods, in offshore locations, away from the direct influence of populated enclosed bays and estuaries. The Yellow-China Sea (Korea, Pacific) display Pbssw that are two to ten times higher than in the Ligurian Sea (France, western Mediterranean) and the Celtic Sea (GB, Northeast Atlantic) between the early 1980s and the mid 1990s [Brugmann et al. 1985; Cotté-Krief et al. 2002; Lee et al. 1998; Migon and Nicolas 1998; Nicolas et al. 1994]. This pattern is consistent with Pb atmospheric emissions during the same period that decline by a factor 4–5 in Europe and increased by 10% in China in spite of the phasing out of leaded gasoline [Lee et al. 2019; Pacyna and Pacyna 2000; Pacyna et al. 2007]. Pbssw and atmospheric emissions differences are coherent with disparities in Pb muscle medians calculated from our database in the Atlantic (ATL), western–central Mediterranean (MED1), and Pacific (PAC) regions (0.01, 0.04, and 0.14 ppm, respectively). These temporal trends are further discussed in chapter 3.3 with the sorting of pre- and post-2000 fish records.
The geographic pattern of Pb accumulation in liver is slightly different than in muscle. While liver display the smallest median in the ATL region (Table 1b), still, the highest one is, from far, in the MED, and, to a lesser extent, the IND, rather than in the PAC that is close to the ATL (Table 1b). Like for muscle, the highest Mediterranean median is encountered in MED5 (Iskenderun–Karatas Bay). This discrepancy may be explained by the higher metabolic activity of liver that may prompt a more complex Pb median arrangement, not as reliable as muscle to proxy environmental contamination. Liver may exhibit more recent Pb contamination than muscles, and disparities in muscle and liver tissues may be emphasized from one species to another [Chouvelon et al. 2019; Hussain et al. 2014; Jakimska et al. 2011a,b; Renieri et al. 2014]. Differences may also partly rely on the lower number of specimens from the liver cohorts, most especially in the Pacific and the Mediterranean basins. This possible statistical bias is reinforced by significantly higher IQRs for liver than for muscle in each investigated region (Table 1a,1b). In order to best compare muscle and liver Pb accumulation, it is necessary to address paired tissues analyses within the same fish cohort.
3.2. Comparison of paired muscle–liver
Because of its detoxifying function and the production of metal-binding metallothioneins or lysosomes [Canli and Atli 2003; Dunn et al. 1987; Fowler et al. 1981; Olsson 1993; Roesijadi 1992; Wang and Rainbow 2010; Webb 1979] fish liver is a target organ for Pb [Eroglu et al. 2015; Gingerich 1982]. When excreted from liver with the bile, Pb passes into the intestine, where it can be reabsorbed or expelled with feces [Heath 1987; Klaassen 1986; Sures et al. 2003]. While the study of Pb in fish muscle is of prime interest for human consumption, and possibly to monitor environmental contamination, liver is a suitable proxy to assess fish intoxication in relation to metabolic activity [Jakimska et al. 2011b; Kalay et al. 1999; Kojadinovic et al. 2007]. Because Pb is poorly regulated and slowly excreted, we expect liver and muscle medians to display similar Pb geographical distribution patterns. We have evidenced differences between liver and muscle Pb median distribution in the main oceanic basins (Section 3.1). Meanwhile, Pb concentration in both tissues can only be appropriately compared to each other when it is measured from the same fish cohort collected together in the same region. Lead content in paired muscle–liver from the same fish cohort is presented in Table 2. Since Pb concentration from paired tissues are not normally distributed, only medians and IQRs are considered in descriptive statistics. When compared within each geographic area, livers always display significantly higher Pb median concentration than muscles (Mann–Whitney test p < 0.001).This geographic approach in various oceanic basins corroborates the role of liver as one of the prime tissues for Pb storage in bony fish [Agusa et al. 2007; Ahmed et al. 2018; Canli and Atli 2003; El-Moselhy et al. 2014; Turkmen et al. 2009]. Overall, paired muscle and liver tissues display the same geographical patterns for the main marine basins, that is, ATL < PAC < IND < MED (Table 2), suggesting that both organs may be used as proxies to assess environmental marine pollution. It should be noticed that the Mediterranean Sea and associated subbasins display the largest distribution for paired muscle–liver (see IQR in Table 2). This statistical pattern, that is accented for livers, may be partly driven by the differentiate response of multiple species to the contrasted Mediterranean pollution imprints, that is, different abilities to induce metal-binding proteins, various trophic levels and food habits [Jakimska et al. 2011b; Ruelas-Inzuza et al. 2014]. Moreover, the levels of fish metallothioneins is altered by gender, maturity, and natural environmental conditions [Olsson et al. 1998 and references therein] within a single species.
Muscle–liver response to anthropogenic Pb stress can be further examined with correlation plots (Figure 2). Overall, paired muscle and liver Pb levels are correlated (Spearman r = 0.85, p < 0.001). Meanwhile, this correlation appears to be driven by high Pb levels above 0.1 ppm in both muscle and liver as shown by a more detailed geographic investigation. Indeed, the MED area where most records are above 0.1 ppm in fish tissues displays a strong correlation (r = 0.92, p < 0.001), while there is no significant relation in the ATL area (r = 0.1, p = 0.1) where most of the data are below 0.1 ppm. The IND and PAC areas display moderate covariation factors owing to their larger data scattering. These various Pb burden distributions may signify a prevailing Pb accumulation in both fish organs for Pb content above 0.1 ppm, a threshold above which Pb excretion may be less efficient. As a consequence, fish tissues, and most particularly liver, may not be as proficient to proxy seawater Pb content in remote less contaminated environments. Further analyses are required within single species collected from various contaminated areas to examine these results and investigate the role of specific environmental settings. The metabolic accumulation and excretion of Pb seems to be driven by Pb concentration close to the EU and FAO/WHO MPLs for fish consumption, independently from the involved species or the considered regional habitat. The contamination of the latter depends on regional pollutant Pb emissions and associated regulation policies that vary from one country to another. Therefore, it is thus appealing to test whether it would be possible to discern the imprint of these policies and regulations of lessened Pb emissions with time in bony fish cohorts from various marine basins.
General and regional covariation of paired muscle–liver Pb levels.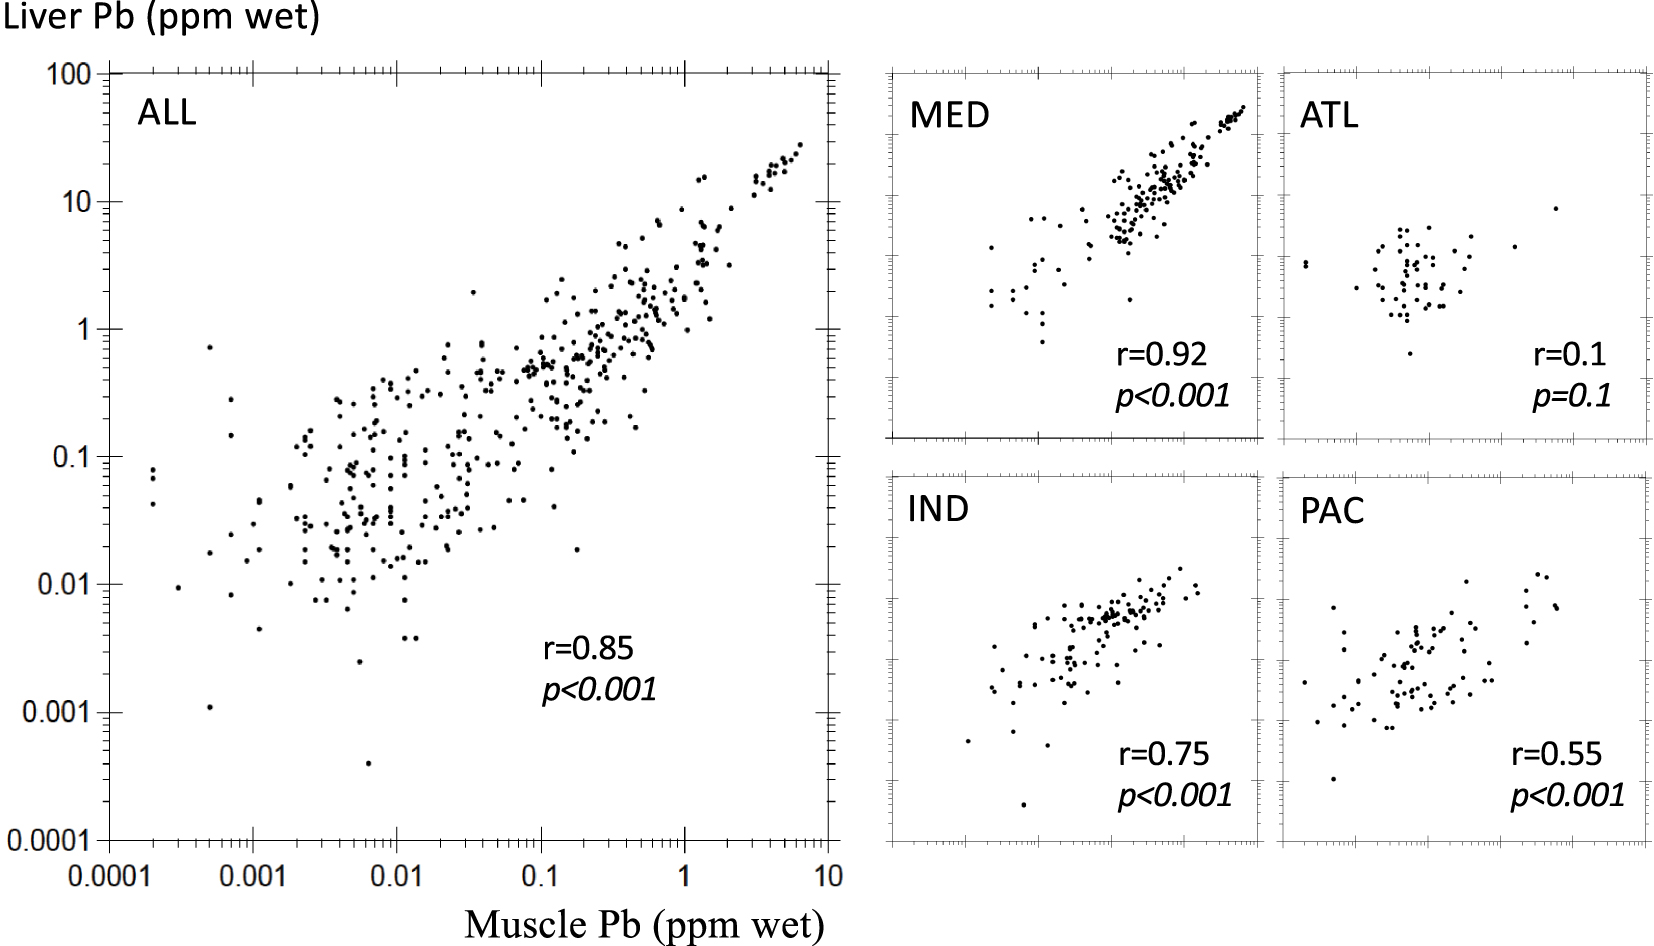
3.3. Transient Pb concentration: global and regional experiences
Atmospheric Pb trends are difficult to assess in seawater owing to the very few reliable Pbssw time series and Pb content variability that may not be easily associated to regional anthropogenic imprints only. Thanks to the most extensive case studies in the western North Atlantic (Bermuda), one can examine the response of surface seawater Pb content to Pb emission mitigation from Western Europe and North America between 1975 and 1995. Pbssw in the vicinity of Bermuda have decreased by a factor 5–8 in the period 1979–2011 [Boyle et al. 2014; Noble et al. 2015 and references therein] as a result of about ten time decrease of Pb emissions in Western Europe and North America [Boyle et al. 2014; EMEP/EEA 2016; Environment Climate Change Canada 2020; Lee et al. 2019; Nevin 2017; Nriagu 1990; Pacyna and Pacyna 2000, 2001; Pacyna et al. 2007; Petit et al. 2015; Pirrone et al. 1999; Soto-Jimenez et al. 2006; U.S. EPA 2018]. This mitigation experience was not as conclusive in neighboring India and south Asian countries, where the phasing out of leaded gasoline is counterweighted by rising industrial emissions such as coal burning [Lee et al. 2019]. Here, we explore our record to determine whether or not these atmospheric trends are recorded in bony fish, worldwide. To assess this issue, the data set is divided into pre- and post-2000 analyses. When grouped as such, all data median (ALL) remains unchanged for muscles (MW p > 0.05), while it significantly increases for liver (MW p < 0.001) from 0.11 ppm (PRE) to 0.41 ppm (POST) (Table 3). This shift can be examined by looking at the fraction of analyses above or below the MPL (from detailed Supplementary Table S1) for pre- and post-2000 data sets. As expected from ALL Pb medians, muscle analyses above the MPL remain unchanged, while livers reveal a significant increase from pre-2000 (33% above 0.3 ppm) to post-2000 (55% above 0.3 ppm) periods (MW p < 0.001). Meanwhile, this discrepancy relies mostly on the chosen MPL as it mostly applies to liver concentrations between 0.3 and 0.5 ppm. No significant change is being perceived for the liver’s cohort above 0.5 ppm (29% and 27% in pre- and post-2000 periods, respectively). The rise in general liver Pb median (ALLL) in post-2000 is mostly driven by a significant increase of Pb median in liver from the Indian Ocean (INDL). On the contrary, liver medians from the Pacific (PACL) and Mediterranean (MEDL) basins substantially decrease from pre- to post-2000 periods. These latter results should be considered with caution since they often rely on less than 500 samples. Meanwhile, muscle Pb medians seem to comfort the observed trends for livers with a sharp decline of PACM and MEDM, and an increase of INDM, while ATLM does not exhibit any significant change. The increase of both INDL and INDM from pre- to post-2000 periods mimics patterns of Pb/Ca ratios in coral skeleton’s Pb content in the northern Indian Ocean [Lee et al. 2019]. Indeed, the historical record of accumulated Pb in corals (Pb/Ca ratios) from the central and eastern Indian Ocean increased since the mid 1990s in spite of the phasing out of leaded gasoline during the same period in the neighboring heavily populated India and Indonesia [Lee et al. 2019]. This enhancement is mostly associated with the continuous rise of Pb emission from coal burning for the production of electricity in most surrounding countries since the mid 1980s [Lee et al. 2019]. The decrease of Pb in muscle and liver from the Mediterranean may result from the phasing out of leaded gasoline in European countries of which imprint is already apparent in the western basin surface seawater in the early 1990s [Nicolas et al. 1994]. The steadiness or slight increase of Pb medians in the Atlantic Ocean may appear at first intriguing as we would expect to observe a clear decrease of bony fish Pb medians in the Atlantic basin as for the Mediterranean basin between pre- and post-2000 data set. Indeed, the neighboring North American and Western European countries were among the very first to initiate the phasing out of leaded gasoline in the 1970s and 1980s, respectively [Thomas et al. 1999]. Considering the short residence time (i.e., about 10 days) of aerosol Pb in the marine atmosphere [Hussain et al. 1998; Poet et al. 1972; Settle et al. 1982], we may postulate that the outcome of these earliest policies materialized very rapidly in the northern Atlantic ecosystem, much before the years 2000s. This assumption is corroborated by seawater Pb concentration that had already significantly decreased into the North Atlantic thermocline between 1979 and the early 1990s [Véron et al. 1998; Wu and Boyle 1997]. Afterward, Pb levels in North Atlantic surface seawater did not significantly vary between the late 1990s and the 2010s [Kelly et al. 2009; Noble et al. 2015] suggesting that most of the marine response occurred way before the 2000s. To test this hypothesis, we select the pre-1990 Atlantic record. ATLM in pre-1990 period (0.38 ppm, n = 279) is significantly higher (MW p < 0.001) than for the post-2000 cohort (0.011 ppm). ATLL displays the same pattern (0.13 ppm and 0.07 ppm in pre-1990 and post-2000 periods, respectively) with fewer data (n = 130 for pre-1990 period). These results corroborate our assumption and reinforce the statistical evidence of environmental policies imprints in the Atlantic Ocean for which most of the pre-1990 data are reported from the North Atlantic basin.
Transient Pb levels in bony fish muscle and liver (Iskenderun–Karatas Bay, Turkey).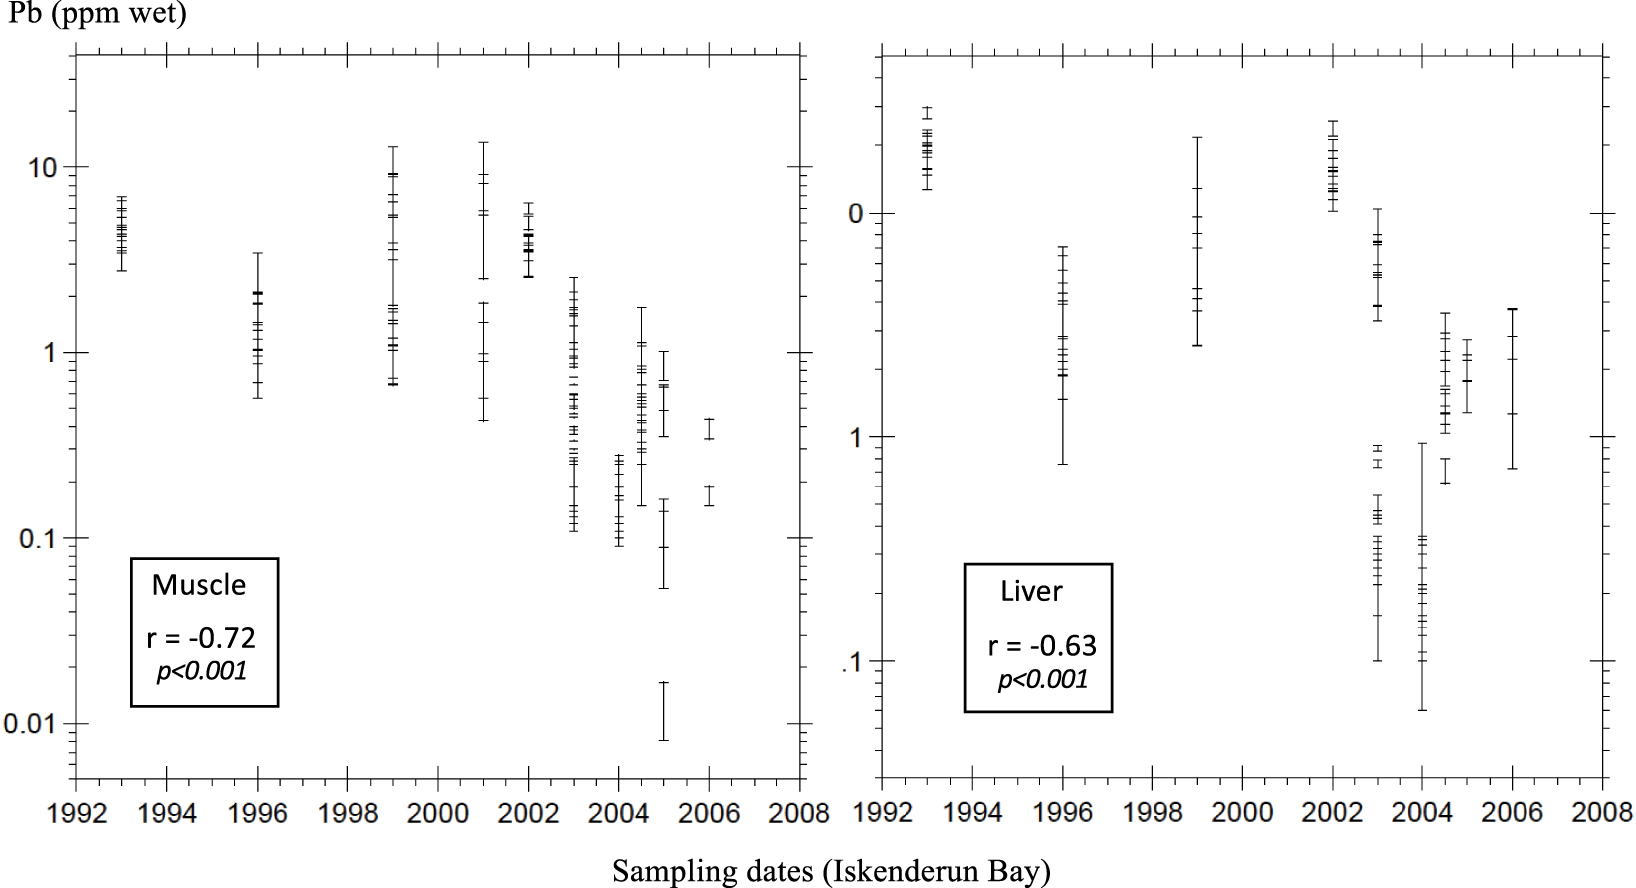
Each geographic data set includes a large variety of sampling regions from which either muscle and/or liver tissues are analyzed. These disparities may distort time-trend monitoring based on different periods, most specially for smaller data cohorts. This is why we favor local or regional surveys where transient shifts may be best described. Here, we venture into the eastern Mediterranean basin, in the Turkish polluted hop spot of Iskenderun–Karatas (MED5). Because of the release of untreated industrial wastes and municipal sewage, this coastal area has been categorized into one of the major Mediterranean hop spot for metal contamination [Cogun et al. 2005; Doygun and Alphan 2006; Kargin 1996; UNEP 2002; Yilmaz 2003; Yilmaz et al. 2010, 2018]. Our data set constitutes an opportunity to investigate possible transient shifts owing to several years of Pb analyses in fish tissues from this area (Figure 3). Both muscle and liver Pb distribution with time show a significant decrease (r = 0.72 and 0.62, respectively; Spearman p < 0.001) in spite of persistent records of Pb pollution in Iskenderun region [Cevik et al. 2010; Kara et al. 2019; Sert et al. 2019; Tepe and Dogan 2015], and regional PM10 annual means that remain above the EU limit value of 50 μg⋅m−3 [Ministry of Environment and Urbanizationo f Turkey 2014; Tepe and Dogan 2015]. These are moderates but statistically significant correlations that may reflect enforcement of European standards. Indeed, in the Iskenderun Bay region, most air pollution indicators have ceased to increase during the 2011–2015 period [Ministry of Environment and Urbanization of Turkey 2016]. This recovery is signified by an improvement of NOx and PM10 emissions in the southern bay during the past few years [Akar et al. 2020; Ministry of Environment and Urbanization of Turkey 2016]. Further, National policies and clean air plans need to be implemented regarding the development of renewable energy sources, monitoring of industrial emissions, and industrial development. Another mixed fish cohort from the more enclosed Tagus Estuary (Portugal) displays the same 10–100 time decrease of muscle Pb content during the 2000s as a response to a local reduction of industrial inputs [Raimundo et al. 2011]. Similar decreases are observed in the Baltic Sea between the early 1980s and the 2010s (Bignert et al. [2016]; graphs and statistical trends available only). From this standpoint, we advocate the use of fish tissues as sensitive indicators to monitor the response of marine ecosystems to pluriannual modifications of the anthropogenic imprint within local polluted environments.
4. Conclusions
Fish biomonitoring of Pb pollution in coastal marine regions remains a challenge depending on fish’s nutrition, age, size, trophic level and metabolism. Statistical examination of this toxic metal analyses in muscle and liver tissues features the usefulness of our literature review in order to demonstrate the sensitivity of fish response to distinct regional pollution status and governmental policies, in spite of expected interspecies disparities. While muscle appears less contaminated than liver within all marine basins, both tissues show covaried Pb enrichment for Pb levels above 0.1 ppm (wet weight) in coherence with EU and FAO/WHO MPLs for fish consumption. The latter suggests that above MPL, Pb uptake is not as efficiently excreted and readily accumulates in liver and muscle tissues. Our results suggest that fish fillets may be more efficient to biomonitoring anthropogenic transient trends than liver tissues, particularly in the least contaminated areas. Bony fish species and sizes are available from our record and may be dealt for to explore more thoroughly interspecies fish response to human pressure. The latter shall be facilitated with the computation of trophic level and ecological habitat for each considered species in the projected online version of the present database.
Acknowledgments
All searches for references were performed with the online library services of Aix Marseille University. We thank D. Point, A. Lorrain (IRD Institute) and M. Harmelin-Vivien, D. Banaru (MIO, AMU) for sharing their biological expertises regarding metal records in fish database. We are grateful to Hélène Paquet for editorial revision of the references. Comments from two anonymous reviewers and the editors were very useful to improve the manuscript.