

1 Introduction
Management of acute respiratory failure implies usually the use of mechanical ventilation. Assisted modes of mechanical ventilation were developed to address the need for maintaining patient’s intrinsic respiration, a necessary condition for eventual weaning from the ventilator. Assisted ventilation aims at reducing excessive respiratory efforts while improving gas exchange by applying positive pressure to the airway thereby unloading the respiratory muscles. Recent approaches even tend to let the patient totally control the ventilator either mechanically 〚1〛 or through the neural drive issued from the patient’s respiratory centers 〚2〛, but these techniques are still under development. In assisted ventilation, although the patient’s inspiratory effort triggers the mechanical breath, coordination between spontaneous breathing and mechanical assistance is not guaranteed, owing to poor interaction between the patient and the ventilator. A solution would be to monitor the patient’s inspiratory activity over some breaths and to subsequently and interactively adjust the ventilator settings so as to improve this interaction. This points to the need for non invasively detecting respiratory muscle activity during ventilatory support. The present study aims to demonstrate the feasibility of a proposed non invasive method.
Usually, respiratory muscles activity is detected or quantified via esophageal and gastric pressure measurement or diaphragmatic EMG obtained from an esophageal probe. These techniques are invasive and moreover not reliable when applied during long periods in intensive care conditions 〚3〛. Recently, a theoretical method has been proposed that can determine the pressure developed by the respiratory muscles (Pmus) in partially supported ventilation 〚4〛. Pmus(t) is obtained as the difference between the observed airway pressure and a pressure calculated from observed flow and volumes variations via a model of the passive respiratory system.
We have adapted this method to the long-term continuous detection of inspiratory activity in pressure support ventilated patients. Two modifications of the method are needed and a detection rule has to be defined. First, the initial model of the passive respiratory system is adapted to current patients by taking into account a possible intrinsic PEEP (PEEPi, positive end expiratory pressure due to air trapping in the alveoli, the expiration duration being too short for the lung to empty) and a non linearity of the resistance parameter. The modified model includes then four parameters instead of two. Second, these four parameters are estimated cycle-by-cycle from airway pressure and flow signals with a selective least squares method 〚5〛. The detection rule is as simple as possible: an inspiratory activity is ‘detected’ when Pmus goes below a given threshold. We present a comparison of our results with reference data obtained with invasive measurements as well as results obtained with the original method in six patients.
2 Materials and methods
2.1 Patients
After institutional approval and informed consent were obtained, six tracheally intubated patients were enrolled in the study (Table 1). All of them were admitted to the intensive care unit for acute respiratory failure of chronic obstructive pulmonary disease (COPD). At the time of the study, all patients were receiving partial ventilatory support (PSV, Dräger Evita II) and were able to sustain spontaneous breathing for at least 5 min.
Demographic and passive mechanical data.
| Patient | Age (yr) | Weight (kg) | Height (cm) | ETT (mm) | Ep (cm H2O l–1) | Rp (cm H2O l–1 s) | PEEPi (cm H2O) |
| C | 71 | 53 | 155 | 8 | 36 | 28 | 5.3 |
| D | 63 | 45 | 175 | 9 | 41 | 26 | 8.5 |
| F | 72 | 65 | 170 | 9 | 36 | 18 | 6.5 |
| G | 60 | 79 | 170 | 9 | 22 | 30 | 6.1 |
| P | 77 | 88 | 160 | 8 | 21 | 27 | 5.5 |
| Q | 70 | 50 | 160 | 8 | 14 | 8 | 5.2 |
During PSV, each breath is assisted by an inspiratory pressure generated by the ventilator at a preset value. This is synchronized with the patient’s effort to breathe. The assisted breath is initiated when the spontaneous inspiratory flow reaches a preset threshold value of 3 l min–1 (flow triggering level). The insufflation is stopped when the instantaneous flow is lower than 25% of the maximal value of the inspiratory flow.
Throughout the study, the applied positive end-expiratory pressure and the inspiratory pressure were set by the attending physician and were not modified for the study (Table 2). All patients were in a semi-recumbent position during measurements. Some patients were recorded several times because of a change in the assisted ventilation parameters (Table 2).
Assisted ventilation data.
| Recording | PEEP (cm H2O) | Pressure support (cm H2O) | n |
| C1 | 2 | 28 | 12 |
| D1 | 7 | 26 | 25 |
| D2 | 12 | 26 | 36 |
| D3 | 10 | 27 | 28 |
| F1 | 6 | 15 | 6 |
| G1 | 3 | 13 | 28 |
| G2 | 3 | 13 | 19 |
| P1 | 5 | 16 | 18 |
| P2 | 5 | 15 | 17 |
| Q1 | 3 | 15 | 20 |
2.2 Measurements
Esophageal (Pes) pressure was measured with a micro pressure transducer-tipped catheter (MTC P3FC 3F; Dräger ME, Best, The Netherlands). The airway pressure (Pao) was recorded 1 cm from the oral end of the endotracheal tube by using another external transducer (Sims, Kirchseeon, Germany). The validity of Pes measurement was assessed by performing ‘occlusion tests’, as proposed by Baydur et al. 〚6〛. The gas flow (F) was measured by using a Fleish (No. 2) pneumotachograph connected to a differential pressure transducer (Validyne MP45; ±2 cm H2O). The diaphragmatic electromyogram (EMGdi) was recorded by an esophageal probe positioned at the level of the gastro-esophageal junction (MCT-Cond.M 8F; Dräger ME). This probe consists of eight steel rings at a distance of 9 mm from each other, two adjacent electrodes forming a pair. With the esophageal probe in place, the optimal pair giving the best-quality signal was chosen. The raw EMG was amplified and the band pass-filtered between 20 and 500 Hz. All pressure, flow, and EMGdi signals were digitized by an analog-to-digital converter with a 16-bit resolution at a sampling frequency of 1 000 Hz (MP100 Biopac System Inc., Santa Barbara, CA). The removing of cardiac artifacts from the EMGdi tracing was done manually on the computer screen. Then, the “intEMGdi” signal was obtained by a moving average (30 ms) upon its absolute value.
Neural inspiratory activity (IAref) was obtained from intEMGdi and validated from Pes signal in the following way (Fig. 1): the onset of intEMGdi, which coincides with the point of rapid decline in Pes, was used to define the onset of IAref, and the end of IAref was defined as the onset of the rapid decline in intEMGdi, contemporary of the return of Pes to the base line 〚7〛.
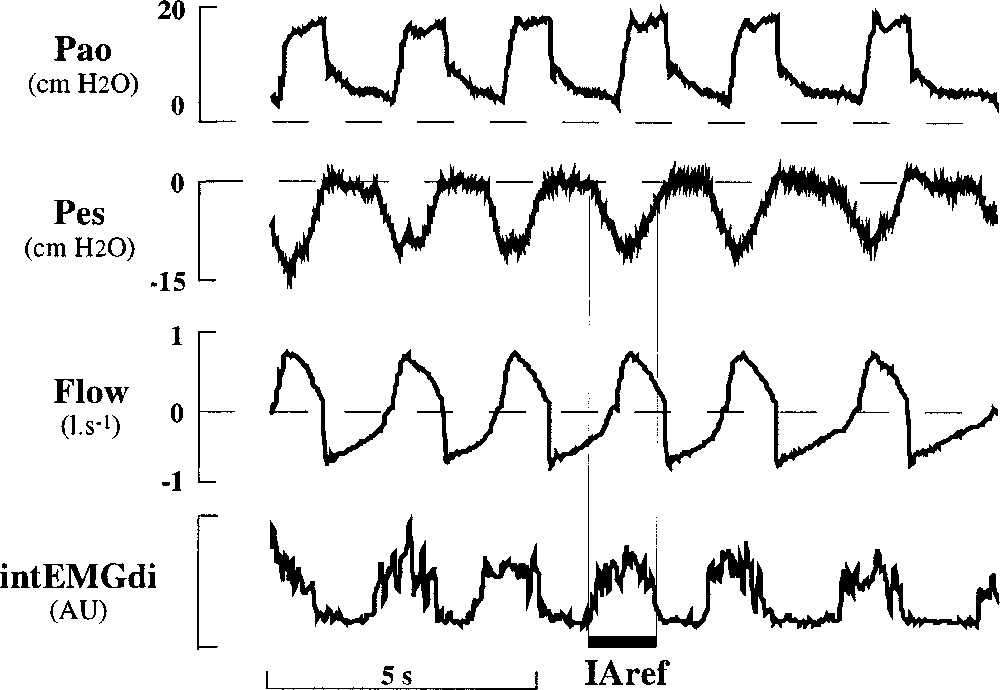
Individual tracings of airway pressure (Pao), esophageal pressure (Pes), flow (Flow) and integrated electromyodiaphragmatic activity (intEMGdi) in arbitrary units (AU) in a patient (patient P) during application of partial support ventilation. Neural inspiratory activity (IAref) is indicated by the large horizontal bar (see text for its determination).
All patients underwent a period of passive mechanically controlled ventilation. This was achieved by increasing the respiratory rate of the controlled ventilation. During this period, passive elastance Ep and resistance Rp of the respiratory system were measured according to Rossi and associates 〚8〛 during constant flow inflation. The intrinsic PEEP (PEEPi) was measured as the difference in Pes between the beginning of the inspiratory effort and the start of inspiratory flow. These characteristics are gathered in Table 1. Measurements during PSV were performed after patients had a 2-min period of spontaneous breathing, and recordings started once the decrease in ventilatory drive associated with PSV onset was completed 〚9〛. Recordings were continued until 30 cycles were acquired or any ventilator setting was changed.
2.3 Signal analysis and calculation
Digitized signals were transferred as text files and then processed using programs written in MATLAB™ (The MathWorks®) language. Flow signal was first corrected for a possible departure of zero flow from zero value. The digital integration of flow over time provided then the volume (V) data.
2.3.1 Model
The analysis is based on a mathematical model involving two main components in the pressure, PRS, needed to communicate to the passive respiratory system the observed movement: (i) the elastic pressure (Pel = P0 + E V) depending both on a constant elastance E and on a residual pressure P0 at the end of expiration (depending on the imposed ventilation pattern), (ii) the resistive pressure (Pres = (α |F| + R0) F), which points out a flow-dependent resistance (R0 and α are respectively the constant and slope parameters of the resistance–flow relationship). The motion equation of the passive system, is then:
This system is submitted to two pressure sources, namely the respiratory muscles, supplying a pressure Pmus, and the ventilator, supplying a pressure Pao. From the arrangement of these pressure sources, one can deduce that the relationship between Pao, Pmus and PRS is:
2.3.2 Selection
The four parameters (P0, E, α and R0) are obtained for each cycle by a least squares algorithm that minimizes the mean squared difference between Pao and PRS signals on a part of the respiratory cycle (Fig. 2) most likely (i) to include little respiratory muscle activity (this excludes the transition between expiration and inspiration) and (ii) to fit closely the proposed model (which excludes the transition between inspiration and expiration, where fast transients cannot be taken into account by a model without inertia coefficient).
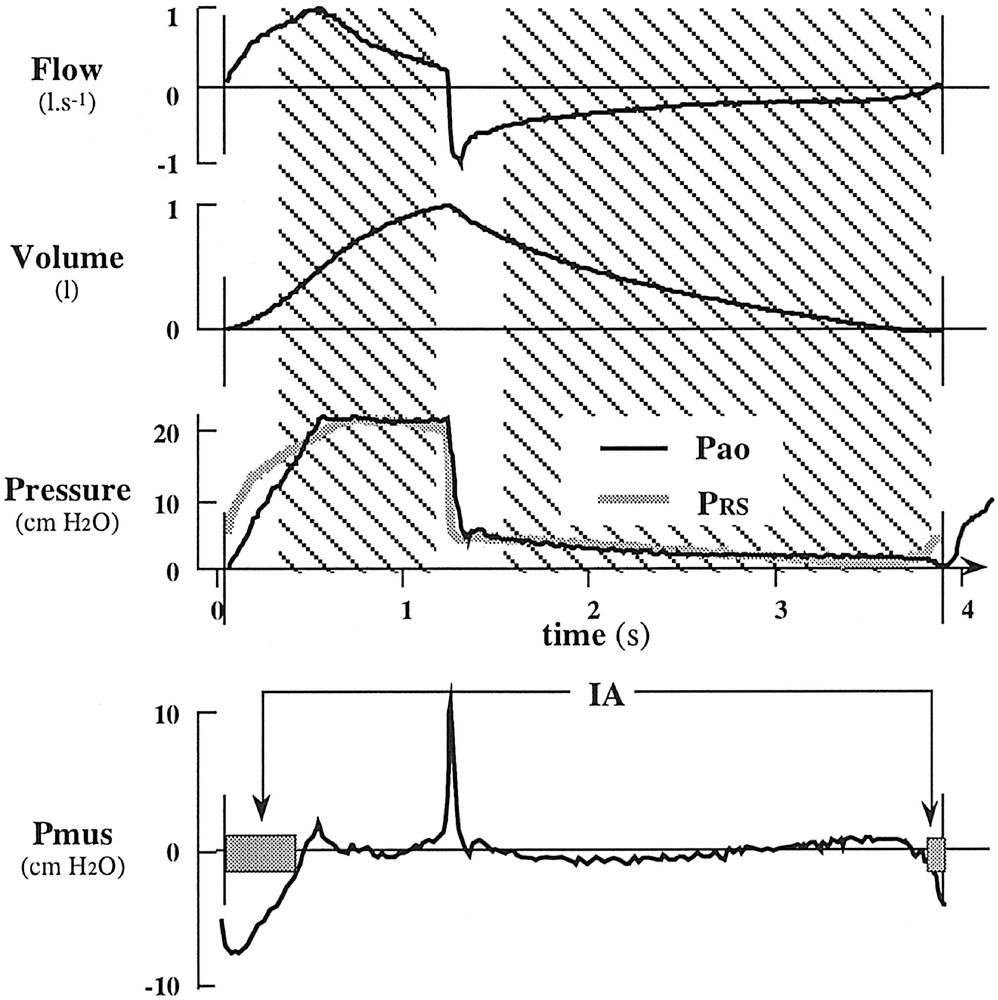
Selective least squares and detection of inspiratory activity procedures illustrated on a respiratory cycle (patient C). Hatched areas correspond to the zone where parameters of the model are estimated by the least squares method. Vertical lines delimitate the cycle. PRS obtained from parameter estimation is superimposed to Pao. Pmus is the difference between PRS and Pao. Grey rectangles on the Pmus curve indicate periods where inspiratory activity (IA) has been detected (Pmus < IAthr).
The first selected zone starts 0.3 s after beginning of insufflation and finishes 0.1 s before its end; the second selected zone starts 0.3 s after beginning of deflation and finishes at the end of the cycle or as soon as the absolute value of flow goes below 0.1 l s–1.
2.3.3 Automatic detection of activity
Inspiratory muscle activity (IA) is considered present when Pmus(t) goes down below a predetermined threshold (IAthr). This threshold has been chosen as a function of the standard deviation observed between PRS and Pao on the zone selected for parameter estimation. Namely IAthr = 1.5 SD. As is the case in Fig. 2, in most cycles IA is detected at the beginning and at the end of the cycle. Our automatic algorithm was designed to provide the end of the first detected IA and the beginning of the last detected IA of the cycle. Other detected IAs were not taken into account, as they cannot be faced to ventilator detection.
The same procedure has been carried out with the original estimation of Pmus based on the passive mechanical parameters obtained before PSV 〚4〛.
2.4 Comparison criteria
The time differences between detected and reference estimate of IA onset (Δbeg = IAref onset time – IA onset time) and end (Δend = IAref end time – IA end time) indicate the precision of our method and their standard deviations give an estimation of its reproducibility. The difference between detected IA onset and ventilator triggering (Δven = inflation start time – IA onset time) evaluates the sensibility of our method compared to that of the ventilator trigger. All these differences are illustrated in Fig. 3, where IA (and the pressure signal from which it originates) and IAref (and the corresponding intEMGdi signal) are represented for the same neural inspiration in patient P.
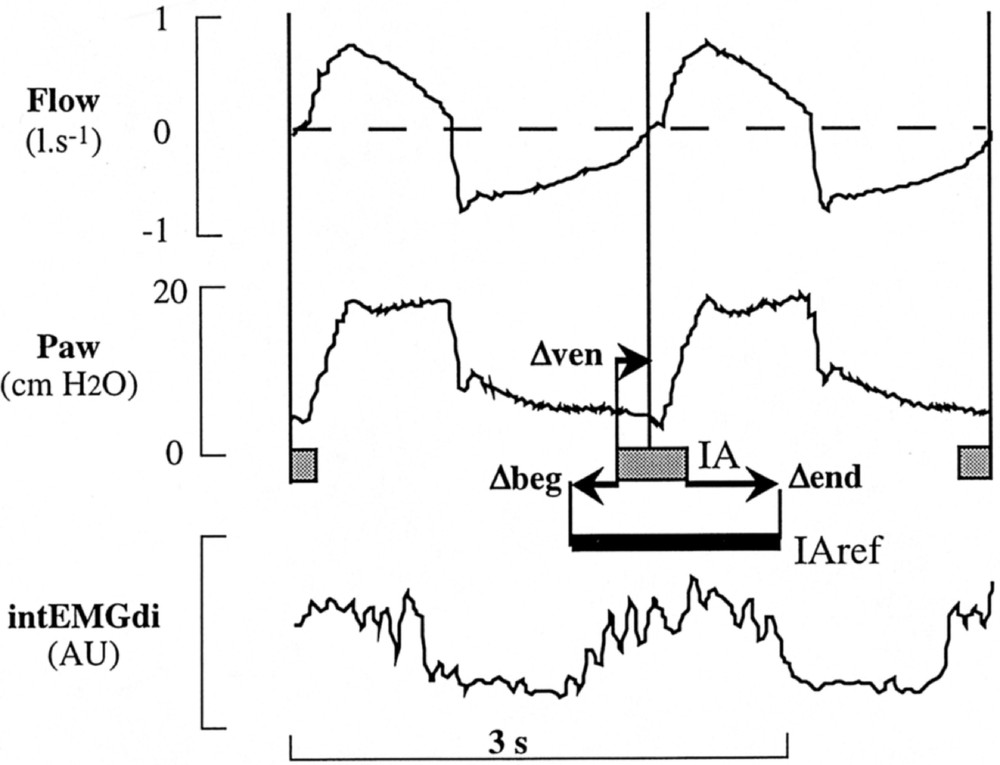
Comparison between detected IA and IAref. In this enlarged part of Fig. 1 (Pes signal has been excluded for sake of simplicity), the corresponding IA is positioned relative to the IAref given in Fig. 1 (remaining IA of the two cycles are mentioned without corresponding IAref). Long vertical lines delimitate cycles from flow signal. IA representation: same as in Fig. 2.
Similar comparisons have been done with Pmus,o: for each detected IA, Δbeg,o (= IAref onset time – IAo onset time) and Δend,o (= IAref end time – IAo end time) were obtained.
We calculated a mean value (and standard deviation) of each time difference for each recording (for graphical presentation) and over all recordings. Statistical comparison has been carried out by paired or univariate t-test over all recordings.
3 Results
3.1 Sensitivity
In all cycles, ventilator triggering coincides with an IA detection (inversely, some detected IA do not trigger the ventilator, but we did not take them into account). Our method detects inspiratory activity in advance (Δven significantly > 0, t-test, p < 0,01) on the ventilator (mean difference ± SD calculated on all recordings: Δven = 0.15 ± 0.10 s).
3.2 Comparison with the reference method
IA onset is almost always (198/209) late with respect to IAref onset. When this is not the case, the difference is small (< 0.01 s). This evidences that we detect inspiratory activity after it appears on EMGdi, but the difference as well as the standard deviation are small: Δbeg = –0.14 ± 0.09 s (mean ± SD, calculated on all recordings). The end of IA is detected prematurely in almost all cases (205/209) by our method. This demonstrates that our method does not indicate existence of inspiratory activity after it disappears on EMGdi. The difference and the standard deviation are greater: Δend = 0.43 ± 0.19 s (mean ± SD, calculated on all recordings).
Individual recording results are shown in Fig. 4. Differences vary from one recording to another and between patients, but they stay comparable for Δbeg as well as for Δend.
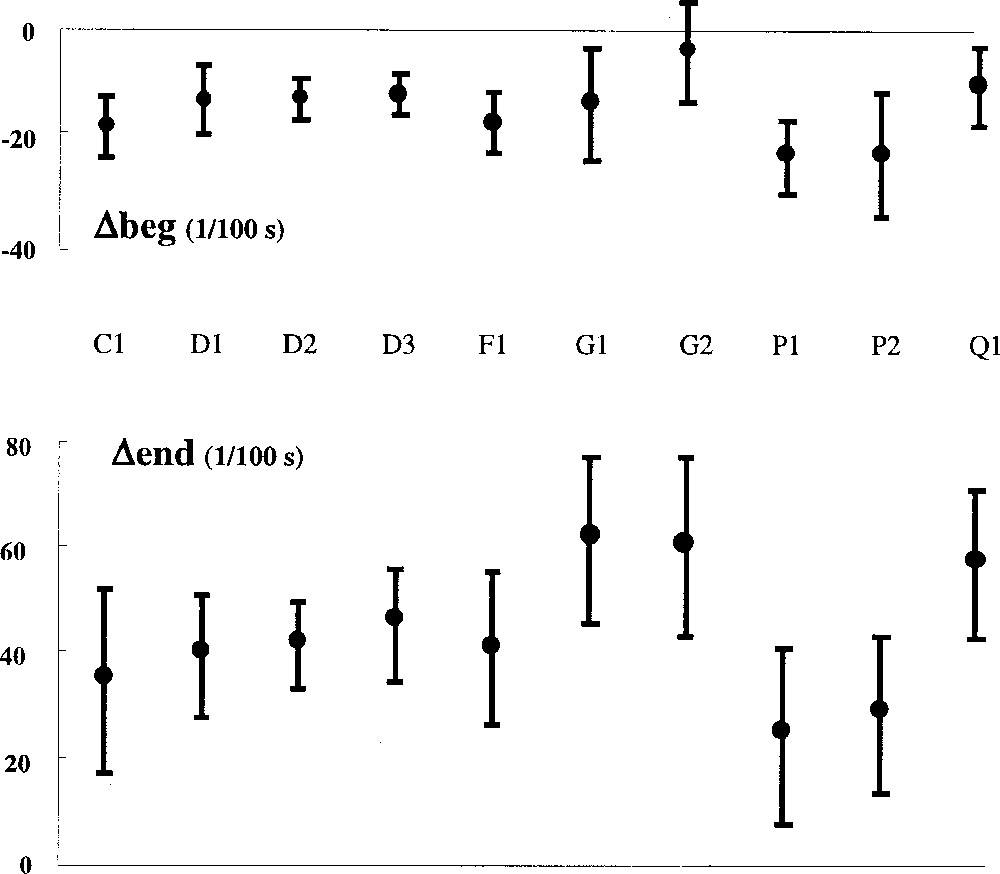
Differences between detected IA and IAref for individual recordings. Δbeg negative indicates a delay taken by our method to detect IA onset relative to the reference based on diaphragmatic EMG. Δend gives the same information for the end of IA, a positive value indicates an advance in detecting IA end. Vertical bars represent one SD.
3.3 Results obtained with the original Pmus estimation
In eight cycles, detection of IA with original Pmus fails to detect any IA. In the remaining cycles, the advance on the ventilator is erratic (Δven,o = 0.51 ± 0.78 s).
The difference Δbeg,o has an unrealistic statistically significant (t-test, p < 0.01) positive mean value (Δbeg,o = 0.16 ± 0.67 s) corresponding to a detection of IA before the onset of IAref in seven out of ten recordings (p < 0.01). Similarly, the difference Δend,o has an unrealistic statistically significant (t-test, p < 0.01) negative mean value (Δend,o = –0.14 ± 0.49 s) corresponding to a detection of IA after the end of IAref in two recordings (p < 0.05). As illustrated in Fig. 5, which gathers the results of both methods for each recording, the detection of IA with Pmus calculated in the original way gives unrealistic results (mean Δbeg,o > 0, or mean Δend,o < 0) in numerous recordings and exhibits a high variability as compared to our method.
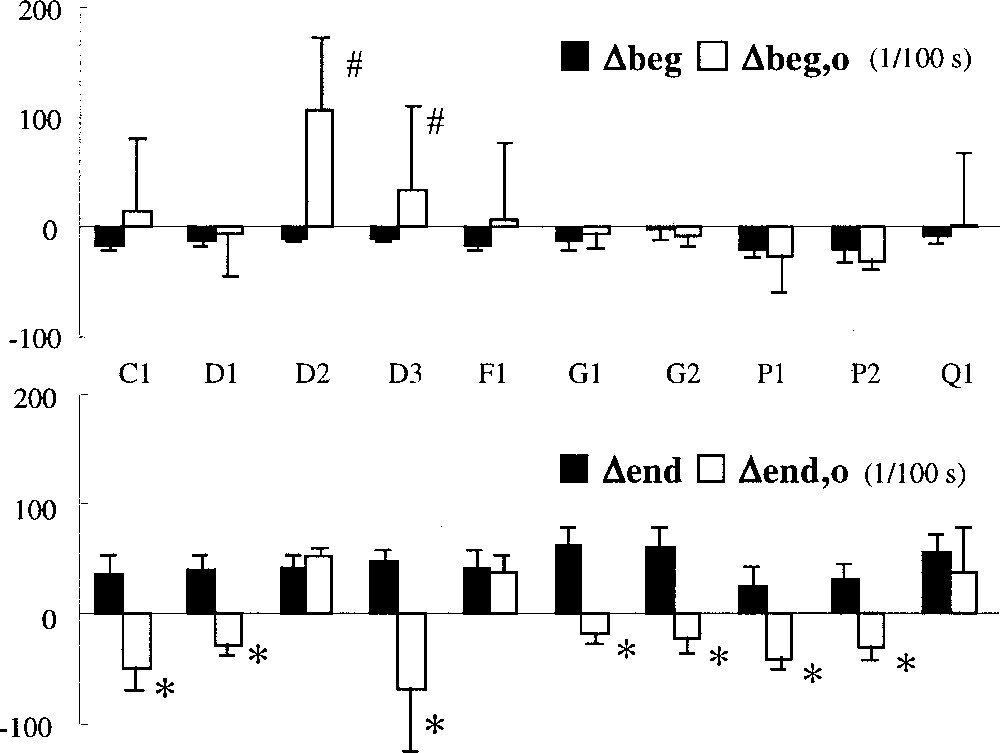
Comparison of the results of our method (full rectangles) with that obtained with the original computation of Pmus (empty rectangles) for individual recordings. Vertical bars represent one SD. #: Significantly > 0 (p < 0.05) ; *: significantly < 0 (p < 0.05).
3.4 Comparison of the mechanical parameters
Our method gives a cycle-by-cycle estimation of respiratory mechanics parameters. In order to compare these values to the ones calculated during passive controlled ventilation, we first calculated for each cycle a mean resistance value (Rm) and we calculated then mean values of elastance (E), resistance (Rm) and P0 for each recording. Table 3 summarizes these data together with the passive mechanical data of Table 2. While P0 is generally close to PEEPi, other mechanical parameters exhibit great significant (p < 0.05) differences between passive controlled situation and PSV and even between recordings on the same patient (D for example).
Mechanical parameters obtained during passive controlled ventilation (Ep, Rp, PEEPi) and by least squares estimation (E, Rm, P0) during PSV.
| Patient | Recording | E p | E | R p | R m | P EEPi | P 0 |
| C | C1 | 36 | 15 (1) | 28 | 18 (2) | 5.3 | 5 (2) |
| D | D1 | 41 | 11 (2) | 26 | 16 (2) | 8.5 | 11 (1) |
| D2 | 27 (4) | 36 (2) | 15 (1) | ||||
| D3 | 8 (2) | 11 (1) | 13 (3) | ||||
| F | F1 | 36 | 24 (2) | 18 | 9 (1) | 6.5 | 7 (1) |
| G | G1 | 22 | 15 (7) | 30 | 11 (4) | 6.1 | 4 (2) |
| G2 | 7 (2) | 13 (2) | 6 (1) | ||||
| P | P1 | 21 | 20 (7) | 27 | 10 (1) | 5.5 | 7 (2) |
| P2 | 20 (5) | 9 (2) | 6 (2) | ||||
| Q | Q1 | 14 | 7 (1) | 8 | 3 (1) | 5.2 | 7 (1) |
4 Discussion
As an alternative to invasive methods, we used an estimation of the instantaneous pressure applied by the respiratory muscles 〚Pmus(t)〛 derived from 〚4〛 to detect inspiratory activity in pressure support ventilated patients. In 〚4〛, this estimation was used for the analysis of work of breathing under various levels of pressure support ventilation (PSV) and has been validated in patients who did not exhibit intrinsic PEEP. However, the work of breathing obtained by this method exhibited a poor correlation with the work of breathing obtained from Pes measurements. This original method has two main drawbacks: (i) the model of the respiratory mechanical system on which it relies is too simple and (ii) the parameters of this model, once determined in controlled ventilation mode, are never reevaluated.
Our COPD patients all exhibit intrinsic PEEP (Table 3) and this had to be included in the computation of Pmus. Moreover, to take into account the behaviour of tracheal tube, we introduced a non-linearity on flow resistance. The resulting model of passive respiratory mechanics has four parameters instead of two, which is not problematic, as the least squares technique allows to evaluate any multi-linear model 〚10〛. Moreover, Peslin et al. 〚10〛 conclude that this 4-parameter model is satisfactory in all their patients; then, this model, even if not the only plausible one, remains the most likely to provide satisfactory results on many patients. Our patients are not numerous enough to allow us to assert that the proposed method will always work for any patient; however, their respiratory mechanical characteristics as well as the used PEEP and Pressure Support cover a wide range of values (Tables 1 and 2).
This least squares technique is well adapted to the second modification we needed to bring to the original Pmus estimation method: a continuous reevaluation of the model parameters. For each successive cycle, we apply this technique selectively to parts of the cycle where inspiratory activity is not likely to occur during PSV (our results do not contradict this hypothesis). Another selection of favorable zones for least squares fitting has already been used in other circumstances 〚11, 12〛. Such a continuous method has at least two advantages: (i) it is totally non-invasive, as the estimation of respiratory mechanics parameters is obtained without the need for any maneuver from the ventilator, and (ii) it allows a follow-up of the state of the patient’s passive respiratory system.
In order to validate our results, we had to call for a reference method. Recently, Parthasarathy et al. 〚13〛 evaluated the concordance of neural inspiratory time measurements based on flow, esophageal pressure and transdiaphragmatic pressure with a more direct measurement of neural activity. This implied the use of esophageal electrode recordings of diaphragmatic EMG that we also used as references. These authors conclude that indirect estimates of onset and duration of neural inspiratory time displayed poor agreement with diaphragmatic EMG measurements. In fact, their results exhibit a huge variability that we do not observe in our results. This comes probably from the fact that their indirect evaluation of neural inspiratory time relies on robust but too simple criteria.
The interpretation of Pmus variations into an inspiratory activity needs the use of a threshold. We decided to adapt this threshold that we use to the local quality of the model and of the pressure and of the flow signal that we get (standard deviation between measured and modeled pressures). This can be discussed on the basis that this threshold always stays around 1 cm H2O and is only significantly modified when the patient exerts an inspiratory effort not detected by the ventilator. In such a circumstance, the standard deviation increases and consequently increasing the threshold will not bring any robustness but will increase the risk of missing this effort already undetected by the ventilator. The 1.5 coefficient we used (IAthr = 1.5 SD) was chosen to give a compromise between sensitivity and specificity. The method is relatively robust as regards this coefficient: results are almost identical (less than 10% variation in all estimates) when this coefficient takes values between 1.0 and 2.0.
On the whole, our method gives satisfactory results in the detection of inspiratory activity. The major defect resides in the detection of the end of this activity: our method does not ‘see’ this activity up to its end as defined by diaphragmatic EMG. This seems rather unavoidable, since presence of activity on diaphragmatic EMG does not imply that diaphragm contraction is efficient. Indeed, at high lung volume, which is the case in ventilated patients with high intrinsic PEEP at the end of insufflation, diaphragm contraction may have no efficiency at all. This may explain the discrepancy between our indirect method and the reference one based on diaphragmatic EMG. The fact that the lag of our method on EMGdi is stable on one patient nevertheless allows detecting a significant change in inspiratory effort duration.
The comparison of our results with those obtained with a simpler evaluation of Pmus underlines the need for a continuous reevaluation of respiratory mechanics; this is even more obvious when putting together parameter evaluations: Table 3 evidences the fact that for the same patient, respiratory mechanics evolve significantly from one situation to another. Incidentally, the fact that evaluation methods differ cannot afford the difference observed. Such observations should revive development of computer programs for automatic measurement of respiratory mechanics in ventilated patients 〚14〛.
5 Conclusion
We conclude that non-invasive detection of respiratory muscle activity is possible during pressure support ventilation. This implies the use of a model of passive respiratory mechanics; this model has to be reevaluated continuously. Simple methods are available for this and have been satisfactorily applied on clinical data. A non-negligible spin-off of this study is the follow-up of respiratory mechanics in pressure support ventilation. The shorter detected inspiratory activity as compared to EMG diaphragmatic activity may be predicted by the lower mechanical output of diaphragm at high lung volume.
Acknowledgements
Laurent Heyer was supported by TAEMA (Antony, France), and is supported, together with Loïc Biot, Jean-Pierre Perdrix and Pierre-Yves Carry, by the ‘Hospices civils de Lyon’, France.
Version abrégée
Des études récentes sur l’interaction entre un patient et son ventilateur d’assistance montrent le besoin d’une détection fine de l’activité respiratoire du patient. Nous proposons une méthode alternative des méthodes invasives classiques (électromyographie diaphragmatique EMGdi, pression œsophagienne), permettant d’estimer en continu la pression exercée par les muscles respiratoires (Pmus) à partir des signaux débit et pression à l’entrée des voies aériennes. Cette méthode repose sur l’utilisation d’un modèle de la mécanique respiratoire du patient, réactualisé à chaque cycle ventilatoire.
Pmus(t) est obtenue en soustrayant à la pression des voies aériennes mesurée une pression calculée à partir des variations de débit (F) et de volume (V), selon la formule :
Les paramètres (P0, E, α et R0) de ce modèle sont estimés cycle par cycle à partir des signaux de pression et de débit à l’entrée des voies aériennes par une méthode des moindres carrés appliquée sur une partie du cycle. Cette partie retenue correspond aux zones du cycle où la probabilité d’occurrence d’une activité inspiratoire est la plus faible et où le modèle peut être identifié. Sont donc exclus le tout début de l’insufflation, le passage de l’insufflation au dégonflement et la fin du cycle, lorsque celle-ci est caractérisée par une phase à débit nul. Le calcul ne nécessite aucune modification du régime ventilatoire du patient. On considère qu’il existe une activité inspiratoire du patient (AI) lorsque Pmus(t) (négative en inspiration) passe en dessous d’un seuil, qui est fonction de la qualité d’ajustement du modèle sur la partie retenue.
Nous avons étudié six patients de réanimation sous assistance ventilatoire équipés de capteurs de pression œsophagienne et gastrique ainsi que d’un cathéter d’EMGdi. Ces derniers permettent d’établir l’activité inspiratoire de référence (AIref) basée sur la présence d’une activité électromyographique confirmée par l’évolution de la pression œsophagienne. Au cours d’une phase initiale de ventilation contrôlée, les paramètres de mécanique passive des patients ont été mesurés par la méthode de l’insufflation à débit constant, ainsi que la pression positive de fin d’expiration intrinsèque à partir de la pression œsophagienne. Ensuite, dix enregistrements ont été effectués (entre un et trois par patient) dans les conditions de ventilation assistée en pression déterminées par le médecin en charge du patient. Entre sept et 40 cycles ont été obtenus par enregistrement, en fonction de la durée entre deux ajustements des paramètres de la ventilation assistée.
Nous avons alors comparé les résultats des mesures de AIref avec les activités détectées par notre méthode (AI) et avec la détection réalisée par le ventilateur, lorsqu’il est déclenché par le patient. Pour cela, nous avons mesuré le temps écoulé entre le début de AI et le déclenchement du ventilateur (Δven), la différence de temps entre le début de AI et le début de AIref (Δbeg) et la différence de temps entre la fin de AI et la fin de AIref (Δend). Par ailleurs, nous avons réalisé les même calculs à partir d’une pression musculaire estimée par un modèle simple non réactualisé de la mécanique ventilatoire, utilisant les paramètres de mécanique passive mesurés en ventilation contrôlée.
Dans tous les cas (209 cycles au total), un déclenchement du ventilateur coïncide avec le début d’une activité détectée par notre méthode (AI) et le début de AI précède le déclenchement du ventilateur : Δven = 0,15 ± 0,10 s (moyenne ± écart type). Il arrive qu’une activité détectée par notre méthode ne parvienne pas à déclencher le ventilateur.
Le début de AI est toujours situé après le démarrage de AIref : Δbeg = –0,14 ± 0,09 s. La fin de AI précède celle de AIref : Δend = 0,43 ± 0,19 s. La faible variabilité observée globalement se retrouve au niveau de chaque enregistrement et démontre une bonne reproductibilité de la méthode.
Les résultats obtenus avec une méthode basée sur un modèle simple non réactualisé, sont nettement moins bons : les différences alors obtenues, Δbeg,o et Δend,o ont des valeurs aberrantes (Δbeg,o > 0 et Δend,o < 0) et une variabilité importante (Δbeg,o = 0,16 ± 0,67 s; Δend,o = –0,14 ± 0,49 s).
La comparaison entre les valeurs des paramètres de mécanique passive obtenues au préalable et celles obtenues en cours de ventilation assistée en pression montre la nécessité de la réactualisation de ces paramètres : les valeurs obtenues au préalable diffèrent notablement de celles observées en cours de ventilation assistée ; ces dernières évoluent d’un enregistrement à l’autre chez un même patient.
L’utilisation d’un modèle de la mécanique ventilatoire permet donc d’obtenir une détection non invasive de l’activité inspiratoire d’un patient sous assistance ventilatoire. Ceci passe cependant par une réactualisation des paramètres de ce modèle, réactualisation que nous avons obtenue par une estimation par moindres carrés à chaque cycle, sur une partie seulement du cycle. L’estimation indirecte de l’activité inspiratoire d’un patient par l’observation de grandeurs mécaniques reste soumise aux limitations de la transmission de la commande ventilatoire au système respiratoire passif. En particulier, la perte de performance de notre méthode en fin d’inspiration peut s’expliquer par la baisse d’efficacité de l’action du diaphragme à haut volume pulmonaire.