

1 Introduction
Eutrophication of hydroelectric lakes and reservoirs participates in water quality degradation and promotes the appearance of Cyanobacteria during the summer period. These undesirable, sometimes toxic, algae are typical of eutrophic waters and represent harm for the use of the resource (drinkable water, fish exploitation, tourism, etc.). A better knowledge of the ecology of Cyanobacteria will permit to foster curative solutions on the long term.
With this aim, a multidisciplinary research program was carried out, that associates modelling and experimental work. It centres on the enlightenment of the dynamics of the colonial Cyanobacterium Microcystis aeruginosa, a dominating species in the Grangent reservoir ecosystem (Loire, France).
This model, named Yoyo, is a mechanistic and deterministic, one-dimensional and vertical model that describes the migration processes of Microcystis at a daily scale. Based on differential equations, it simulates the daily fluctuations of Microcystis density variations resulting from the dynamics of cell carbohydrate metabolism during photosynthesis. This model is a prospective tool used to explore the effect of physical conditions upon algal metabolism and its consequent control of vertical movements. It is presently in its conceptual phase: the interest of this work is to allow a functional and conceptual analysis of Microcystis migratory behaviour. Here we expose the analysis of the model behaviour, carried out through simulations led under different environmental conditions (light and water temperature) and colony diameter. Our aim is to isolate and identify the influence of the environmental factors upon buoyancy.
Acronyms used to define variables and parameters are listed in Table 1.
List of acronyms used in the text and figures
| Acronym | Unit | Definition |
| C | μg C l−1 | Intracellular reserve of carbon, stored as polyglucose |
| C dis | μg C l−1 | Dissolved carbon in water |
| E a | μg C l−1 h−1 | Activity excretion |
| E b | μg C l−1 h−1 | Basic excretion |
| I | W m−2 | Light intensity |
| M | μg C l−1 | Cell biomass, without the C reserve, expressed as carbon |
| R | m | Colony radius |
| R a | μg C l−1 h−1 | Activity respiration |
| R b | μg C l−1 h−1 | Basic respiration |
| Re | – | Reynolds number |
| t | h | time |
| T | °C | Temperature |
| V col | m3 | Colony volume |
| Vesic | μg C l−1 | Gas vesicle proteins |
| V m | μg C l−1 h−1 | Metabolic activity |
| V p | – | Mass proportion of gas vesicles in cell material |
| V s | m s−1 | Vertical migration speed |
| X cel | – | Proportion of cells in colony volume |
| z | m | Depth |
| η | Pa s | Dynamic viscosity of the water |
| ρ c | kg m−3 | Density of cells without vesicles |
| ρ cel | kg m−3 | Density of cells with vesicles |
| ρ col | kg m−3 | Colony density |
| ρ muc | kg m−3 | Mucilage density |
| ρ ves | kg m−3 | Vesicles density |
| ρ w | kg m−3 | Water density |
2 Regulation of Microcystis vertical migration
Microcystis is a colonial Cyanobacterium whose cells, surrounded by mucilage, form more-or-less spherical colonies. As all planktonic Cyanobacteria, each cell possesses gas vesicles whose very low density can make it lighter than water. Depending on the genus, Cyanobacteria have developed different mechanisms that lead to cell density changes: strong or weak resistance of vesicles to pressure variations (vesicle collapse) and intracellular accumulation of carbohydrates during photosynthesis (ballast effect).
Buoyancy regulation insures that colonies have a better use of nutritive resources in the water column and periodically come back into the light gradient favourable to an energy accumulation through photosynthesis [1].
In Microcystis, vesicles cannot collapse under natural conditions; vertical migration is essentially regulated by the variations of cells carbon content [2–6].
Carbohydrates are molecules denser than most of other cell components. They act as a ballast that modifies cell density. Following a few hours of exposition to high irradiance, carbon reserves have been accumulated enough to initiate a sedimentation of colonies. For Microcystis, the average sedimentation speeds are 0.11 m h−1 according to [7] and 0.432 m h−1 according to [8]. After a dark period (due to night or a deep submersion), carbon fixation is lowered or stopped. If the carbon ballast has been sufficiently reduced through the biosynthesis of lighter molecules, colonies float up. Buoyancy speed is faster, about 1.3 m h−1 [8] and for Microcystis colonies between 50 and 300 μm it ranges from 0.36 to 10.8 m h−1 [9].
3 The migration model
Yoyo model was conceived to test the impact of environmental conditions upon Microcystis dynamics and to simulate the response of colonies in terms of vertical movements in the water column. With regard to literature, the model simulates ballast dynamics following the daily photosynthesis cycle and fluctuations of colony density (Fig. 1). Such a kind of description has already been proposed by [7] and [10], according to the original work of [11]; however, the equation formulated to calculate density fluctuations cannot be used in a dynamical model. Their relation is a polynomial function; though realistic, since fitted on experimental data, it is only valid under the range of tested values. We inspired our work from their process, which remains very relevant. The presentation of the elaboration phase of the model and details of the mathematical structure are discussed elsewhere [12]. A description of the principles is reminded below.
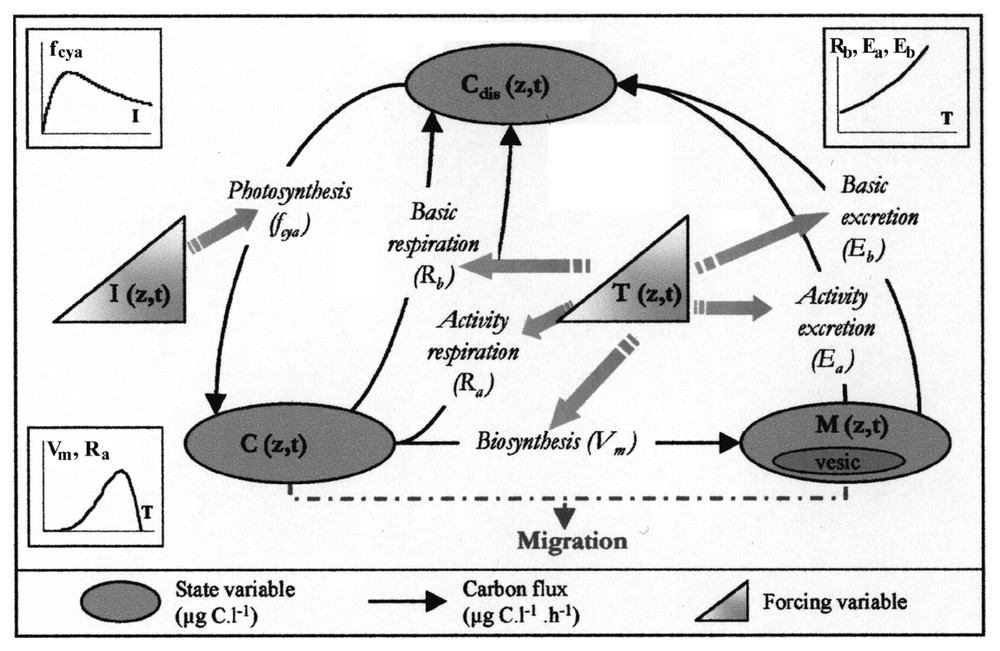
Diagram of the intracellular carbon dynamics in Microcystis sp.: inorganic carbon fixation through photosynthesis (fcya), consumption of carbon reserves (Vm), respiration (Ra,Rb) and excretion (Ea,Eb).
The model is one-dimensional vertical. Depth is vertically discretised: the water mass is split up into 25-cm thick layers. All layers are presently identical and the maximum depth is 40 m. Sediments are not considered to trap material: sunken cells accumulate in the deepest layer and can return into the water column.
3.1 Variables
Hydrodynamic conditions (thermal profile, thermocline depth, irradiance, extinction coefficient) are introduced as forcing variables in this version. During this analysis phase, we suppose nutrients (PO4P, NO3N, NH4N) are not restrictive.
The model is based on a carbon budget. Three state variables are represented.
- – The carbohydrate ballast, ‘C’ (μg C l−1) represents a carbon reserve of polyglucose. Carbon accumulated in this C compartment constitutes a reserve of molecules that is essential to cell material synthesis; it also provides the required energy for this transformation.
- – The cell material, ‘M’ (μg C l−1) is the cell biomass without carbohydrate reserves and expressed as carbon. It is produced from the accumulated C reserves. Gas vesicle proteins (Vesic (μg C l−1)) are considered as a constant fraction (Vp) of cell material and fixed at 8% [1,4].
- – The dissolved carbon, ‘Cdis’ (μg C l−1) allows the system to be looped. This variable brings together organic and mineral forms of dissolved carbon without any discrimination.
3.2 Processes
Processes simulated in the model describe intracellular carbon dynamics, which is essential to an adequate description of vertical movements. Photosynthesis, previously considered as a coupled function of light intensity (I) and temperature (T) in aster [13], was dissociated here into two distinct processes. This made it possible to represent the photosynthesis mechanism at a finer scale than in most growth models and presented the special feature to point out the influence of each factor upon algal metabolism. This originality was emphasised by [14] who compared these two techniques.
- – Carbon fixation. We grouped in this process the photochemical phase of photosynthesis and the reduction of inorganic carbon dissolved in the water (Cdis) as carbohydrates in cells. When the amount of fixed carbon exceeds the one used in biosynthesis, surplus carbon is stocked: this first stage insures the filling of the C compartment (responsible for the ballast) and depends on incident light energy. As in many other species, photosynthesis inhibition has been observed in Microcystis [10,15,16]; the chosen function also takes into account this process through a lowering of the fixation rate under high light intensities. We considered the filling of the carbon reserve as independent of temperature.
- – Cell material synthesis. The biosynthesis phase, described through Vm transfer, is the production of cell material (M) from carbon reserves (C) and nutrients. It does not require light and thus can occur night and day, whenever reserves are available. This reaction, which consumes some energy, is liable to be limited by temperature (T) and nutrients (nitrogen N and phosphorus P).
- – Respiration. Part of the C stocked is used to generate the energy necessary for new cell material syntheses. This process is named active respiration (Ra). It is proportional to the metabolic activity Vm and only occurs during Vm material transfer. Maintaining the basic metabolism also requires energy provided by the cell, which implies carbon consumption: this is the basic respiration, Rb, which is proportional to the biomass M to be maintained and rises with temperature. It is a permanent process that can lead to a lysis of the cell material if the C reserve is exhausted.
- – Carbon excretion. Carbon excretion matches with a release of organic molecules that follows any cellular activity [17]. It is represented in the model as a loss of cell material M through a two-component process: a basic excretion, Eb, linked to the basic metabolism, and an activity excretion, Ea, proportional to cell synthesis activity. Following the hypotheses formulated above, excreted carbon directly feeds dissolved carbon Cdis.
- – Colony migration. The difference of density between water and Microcystis colonies governs their vertical movement. Vertical migration speed Vs is calculated with Stokes' law [1] that takes into account the colonies' size (volume Vcol and radius R) and density ρcol. The major difficulty consists in calculating colony density from the model variables. To overcome this we followed the procedure proposed in [18].
- – Calculation of the density of cells without vesicles, ρc. We established an exponential function ρc=f(C/M) from Visser's experimental data [7] and following her process.
- – Calculation of the density of cells with vesicles, ρcel. We assume a proportion Vp of vesicles in each cell, whose density is ρves=150 kg m−3 in Microcystis, from [1].
- – Calculation of the density of Microcystis colonies, ρcol. We assume that the proportion of cells in colony volume is Xcel=0.25 and mucilage density is ρmuc=ρw+0.7 [19], where ρw is the water density. Hence:
Stokes' law can only be applied for a migration speed calculation when the flow created around a spherical particle is laminar. Reynolds' number Re, the ratio between viscosity forces and inertia, is calculated for each particle to verify these conditions:
3.3 Numerical aspects
Yoyo is a non-linear model; the system of differential equations was integrated by the 4th-order Runge–Kutta method [22]. The model time step was 1 h, integration step was 0.25 h. The carbon budget was verified throughout the simulation to ensure there was no drift.
4 Simulations
Simulations were first run to investigate the influence of each factor separately (light, temperature, colony diameter) in order to verify the model behaviour even in unlikely situations from an ecological point of view. This indispensable stage constitutes a model sensitivity analysis under a large range of environmental conditions. In a first step, these conditions were applied with stable values; the setting up of a permanent regime allowed us to point out the equilibrium state reached by the model for each colony size considered and allowed to link it to the pairs of fixed (I,T) values. Afterwards, the model was tested under light forcing conditions representing the daily changes as a sine curve. This scenario was an approach towards more realistic conditions.
Environmental conditions chosen for the simulations are given in Table 2.
- – Incident light intensity. Colonies were first exposed to a continuous light representative of a sunny (650 W m−2) or cloudy (325 W m−2) sky. Daily change of incident irradiance I0 was likened to a sine curve whose Imax value was chosen and adjusted at noon. The model used hourly values of light irradiance.
- – Temperature. The value (T) of the water temperature was fixed at the beginning of each simulation. With intent to compare our simulations to Visser's experimental work [7], which we used to calculate cell density, we reproduced the thermal conditions she applied executing simulations under 20, 12, 8, and 0 °C. Temperature was kept uniform over the whole water column.
- – Colony diameter. We selected two diameters representative of colonies observed in Gangent. This parameter is important since it directly influences the sedimentation speed.
- – Initial biomass conditions. In the initial conditions, Cyanobacteria were uniformly distributed in the whole water column. Light extinction due to chlorophyll was not taken into account here, in order to keep light conditions constant whatever the biomass created during the simulation. The water column was supposed non-turbulent.
Forcing conditions applied to both series of simulations and to scenario S0. L/D = light/dark photoperiod
| Environment conditions | Continuous conditions | S0 |
| Incident light intensity | Constant I | Sine curve |
| Imax1=650 W m−2 | (L/D = 16/8) | |
| Imax2=325 W m−2 | Imax1,Imax2 | |
| Temperature | Constant T – 20, 12, 8, 5, 0 °C | T=20 °C |
| Colony diameter | Φ1=300 μm, Φ2=150 μm | Φ 1 |
Two series of scenarios were successively established, one for large and one for small colonies; series 1: influence of temperature under bright light conditions; series 2: influence of temperature under cloudy conditions.
Lastly, scenario S0 simulated colony migration with sine forcing of light and under a uniform temperature of 20 °C.
5 Results and discussion
5.1 Simulated behaviour of large colonies
The simulation under 20 °C and a 650 W m−2 irradiance resulted in a high increase in total biomass (C+M) over time. The model reproduced the exponential growth of a population in a favourable environment. In these conditions of permanent regime, a biomass peak formed at the bottom of the euphotic zone and promptly stabilised at 4-m depth (Fig. 2). The C/M ratio in the biomass peak presented slight fluctuations that damped down in less than ten days and stabilised at a value of 0.428.

Simulated influence of temperature upon the migration of 300-μm Microcystis colonies under a constant irradiance of Imax1=650 W m−2.
Under 12 °C, the model simulated the establishment of a biomass peak in the lower euphotic zone and its sedimentation down to 7.75 m depth. Maximum speed reached was 0.21 m h−1. At this temperature, biosynthesis was slowed down, whereas carbon fixation remained the same as under 20 °C. Because of a slower growth, carbon tended to accumulate, which causes colonies to sink below the lighted zone. Although this temperature is unfavourable to Cyanobacteria growth, it did not completely block their metabolism; carbon ballast was slowly used for cell material syntheses and the cells, thus lightened, could float up. Fluctuations of the C/M ratio in the peak were more pronounced than below 20 °C and initiated a more pronounced migration of colonies, which became lighter with difficulty and so less and less floated back into the lighted zone. Within 30 days, the model finally reached an equilibrium state between carbon fixation and use that matched a C/M ratio stabilisation at a slightly higher value than previously observed (C/M=0.45). Colonies then stayed at 5.5 m depth and kept growing slowly.
At 8 °C, the model amplified the behaviour described for 12 °C: the biomass peak reached 0.26 m h−1 and sank to 12.75 m before floating back to its starting depth. Initially, the fluctuation of the associated C/M ratio was a little greater, then it progressively damped down after 150 to 200 days before stabilising between 6.5 and 6.75 m. Only 1.64 W m−2 penetrate to this depth, which represents 0.25% of the incident light. The whole colony metabolism is strongly reduced: carbon fixation was very low under this low irradiance and biosynthesis was limited by temperature: in this scenario biomass decrease was great.
At 5 °C, the first oscillation of the biomass peak lasted 14 days and colonies reached 20.75 m depth. Peak sedimentation took longer than at 8 °C, but the maximum speed of this displacement was not so different (0.24 m h−1). Following migrations were less and less deep and concurrently the duration of the migration cycle slowly decreased. The migration dynamics stabilised within about a hundred days. The biomass peak regularly oscillated between 5.5 and 11.25 m, two consecutive ascents being spaced by 9 days (Fig. 2). In parallel, the model calculated a regular fluctuation of the C/M ratio between 0.408 and 0.504 that led to a variation of the migration speed from −0.09 m h−1 to +0.09 m h−1.
At 0 °C, colonies sank down to 27 m. During the following migration cycles, they sank less and less deep and floated back progressively less and less to the euphotic zone. Finally, a steady biomass migration was established between 5.5 and 14 m, whose C/M ratio was between 0.395 and 0.517. The maximum speed reached was the same as in the previous scenario, the speed range of the movement after stabilisation as well.
An identical series of scenarios run with an incident light intensity of 325 W m−2 globally predicted a similar behaviour; however, carbon fixation was less high with this irradiance, so ranges of C/M variations were shifted towards lower values and showed a gain in colony buoyancy. Stabilisations observed were thus closer to the surface and varied from 3 m at 20 °C to a range of 4.75–13.25 m at 0 °C.
5.2 Simulated behaviour of small colonies (150-μm diameter)
Simulations run for small colonies of 150-μm diameter showed, at the beginning of the simulation, a migration behaviour different from that of 300-μm colonies. Small colonies moved slower and so did not sink down as deep as the bigger ones. Their migratory response was slower and more damped, and showed direct repercussions on the duration of the exposure to light in the water column. The amount of light received determined a different trend in the C/M ratio and so in their displacement speed. However, though the transition phase was different, the final depths reached in simulations at 20, 12 and 8 °C remained the same for both diameters. In the model, only migration speed distinguished small colonies from the large ones; whatever their size, all may be considered similar from a physiological point of view: when placed under the same conditions of light and temperature, they presented identical speeds of carbon fixation and biosynthesis. Depth at which the equilibrium between fixation and use of carbon was reached thus corresponded to a pair of values [I,T] that was independent of colony diameter.
In scenarios with lower temperatures (5 and 0 °C), the model nonetheless showed an increase in the migration depth versus time instead of a displacement between two constant depths as observed for 300-μm colonies. It seems that the 150-μm colonies failed to reach an equilibrium: fluctuations of the C/M ratio were wider and showed an alternation between two more extreme states where C stock was high (C/M=0.68 at 5 °C and 0.725 at 0 °C) or very low (C/M=0.229 at 5 °C and 0.123 at 0 °C). When small colonies were in surface layers, they stocked carbon in reserves more abundantly than larger ones, since they reached the aphotic zone more slowly; thus filled, they sank deeper (Fig. 3). Moreover, long periods spent in the dark allowed a greater ballast decrease than in larger colonies, which made them float up into the euphotic zone. This greater storage/emptying of carbon ballast provided them with the same maximum speed as 300-μm colonies but this speed was reached more slowly, creating certain inertia in their metabolism. This inertia increased with time and, with a strong biomass decrease, finally led to sedimentation of colonies down to the bottom of the lake.
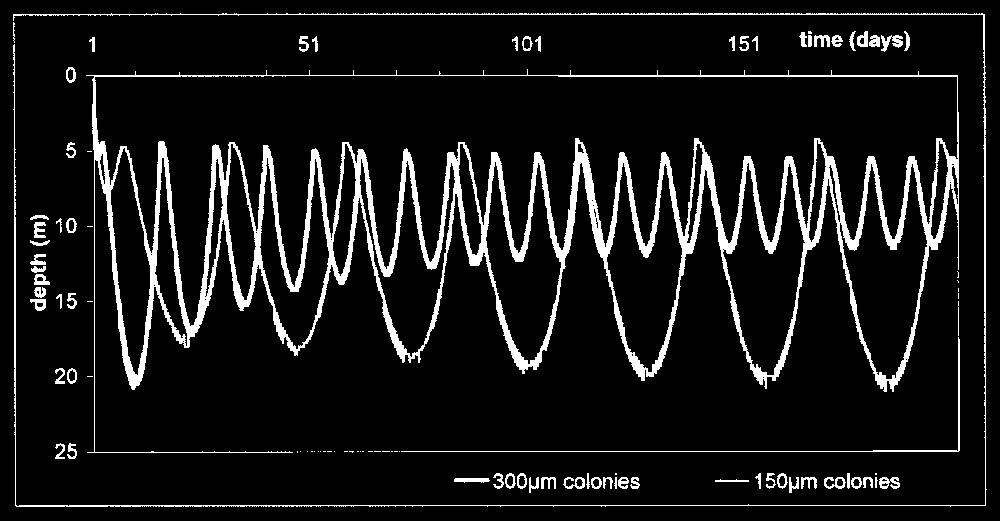
Simulation of the migration of Microcystis colonies with small (150 μm) and large (300 μm) diameter at a temperature of 5 °C and a constant irradiance equal to Imax1 (650 W m−2).
Fig. 4 presents the depth at which colonies were found after a 300-day simulation under different temperatures, for the two light intensities and both diameters. Down to 8 °C, an equilibrium state without migration was observed for both diameters; the stabilisation depth slowly increased when temperature became lower. Below 8 °C in 300-μm colonies, the system equilibrium was a stable oscillation between two depths, whose amplitude increased when T became lower and approximately varied from 5 to 15 m. On the other hand, small colonies did not reach any equilibrium and increased the amplitude of their displacement from 3 m down to the bottom. Under conditions of low light, all equilibrium depths were shifted about 1 m closer to the surface.
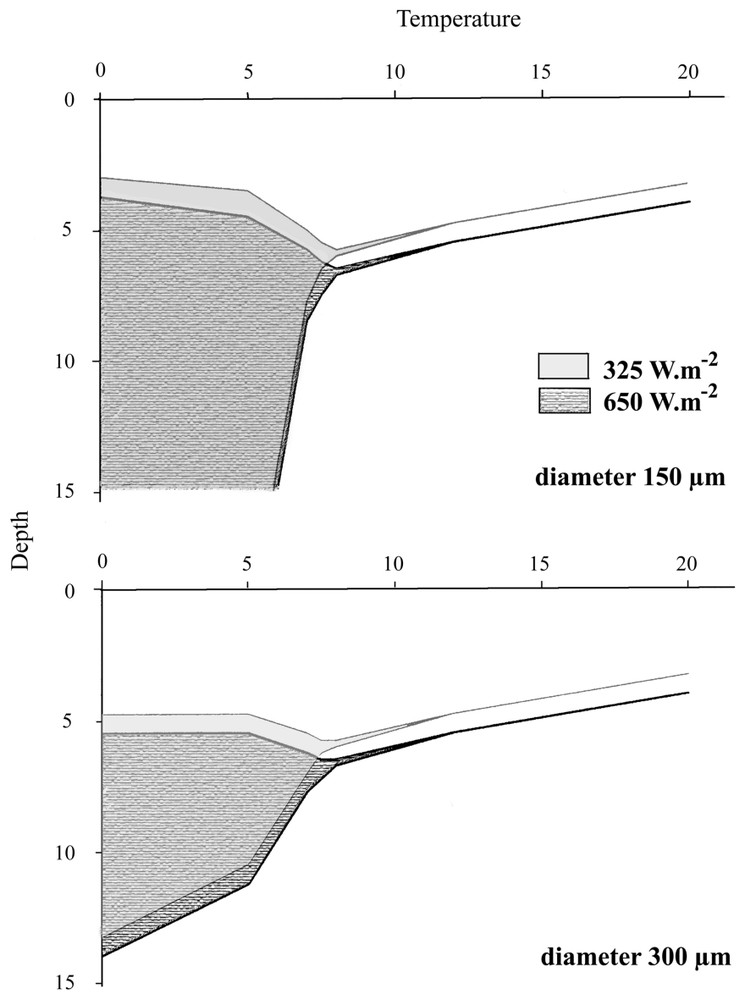
Comparison between the final state reached by 300-μm and 150-μm colonies placed under the same conditions, according do the model. Whereas 300-μm colonies always reach an equilibrium state, 150-μm colonies do not reach any equilibrium at low temperatures (T<8 °C).
As it is recognised that colonies tend to sediment when exposed too low temperatures, results described below are in good agreement with the general observations of the dynamics of Microcystis blooms. For instance, in natural populations of Microcystis, [7] observed that a water temperature lowering could lead to an autumnal sedimentation of colonies, through an increase of the cell carbon ballast. The value of temperature leading to colonies sedimentation probably varies among the different strains of Microcystis: it is of 14 °C in Nieuwe Meer [7], but can lower to 9 to 11 °C [23] or even 8 °C [3]. In the model, Microcystis remains buoyant at 12 °C, which is also consistent with observations from [24], who did not notice any bloom sedimentation at 12.8 °C. In a nutshell, the model results are in good agreement with the literature by the fact that temperature lowering is to be considered among factors participating in bloom sedimentation and dispersion in autumn.
5.3 Scenario S0
In this scenario, light forcing followed a sine variation. Representation as a vertical profile on Fig. 5 enables localisation of the biomass peak in the water column and display of its movements. At the same time, the curve of the corresponding stocked carbon/biomass ratio (C/M) gives an indication on the extent of carbohydrate reserves, relatively to the biomass.

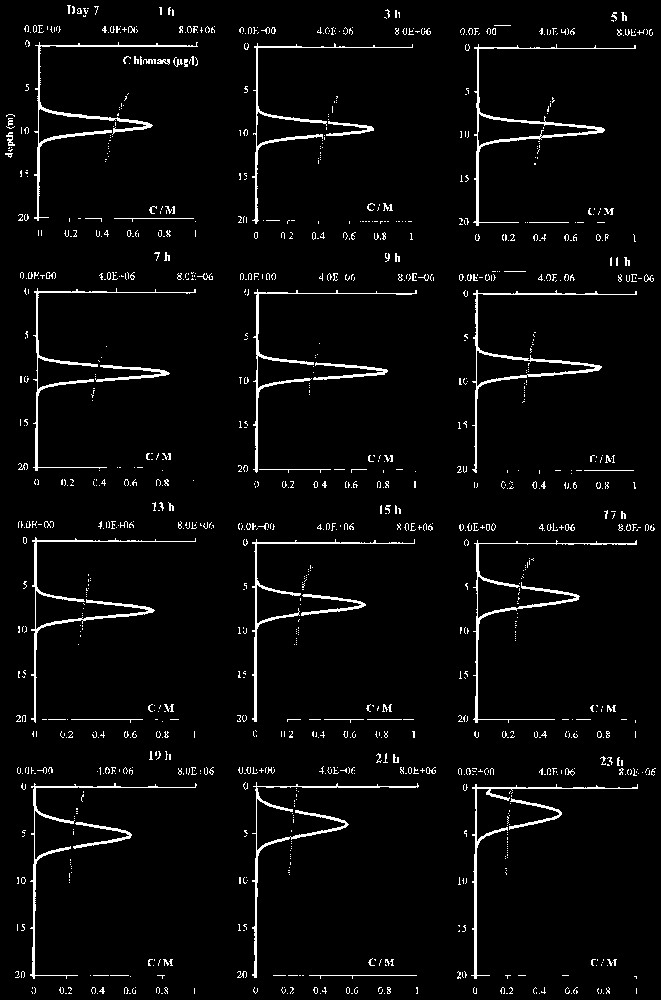
Vertical profiles of scenario S0 over 48 h (daily light cycle, uniform temperature 20 °C).
The peak took shape quickly from the uniform initial conditions, then vertically moved and oscillated between the surface, where it concentrated, and 9.25 m. In this scenario, this cycle spread over 48 h: algae were at the surface one day out of two (Fig. 6). Colonies tended to float and flatten against the surface at the end of the night. As early at sunrise, colonies were located in the lighted zone and restored their carbon reserves; gradually getting heavier, they began to sink at around 8 a.m. During sedimentation, C/M ratio showed a constant lowering of the carbon stock, for the benefit of the biomass M. The C/M ratio was about 0.33 in cells located in the lower part of the biomass peak at its maximum depth. While the peak floated up, these values went on lessening until the peak reached the lighted zone. On the average for the whole biomass peak, the proportion of stocked carbon represented from 18 to 77% of the biomass M.
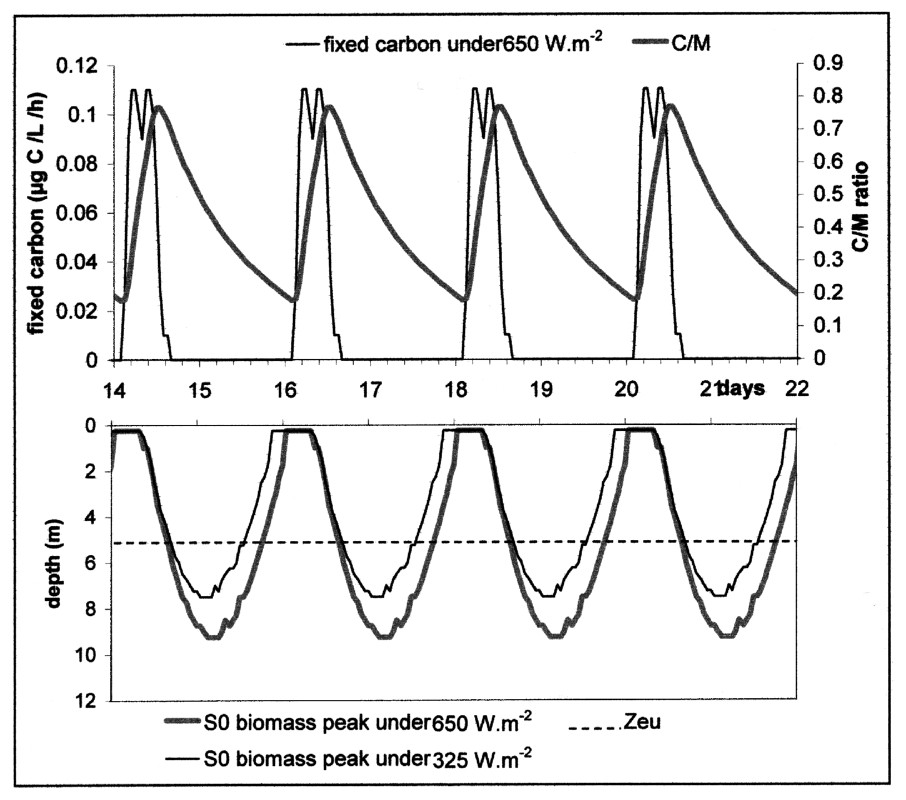
Speed of carbon fixation and changes of the C/M ratio at the peak maximum, from the 14th to the 22nd simulation day of scenario S0, under a 650-W m−2 light intensity. The migration of the biomass peak is traced in parallel. Zeu = lower limit of the euphotic zone.
A periodical light regime thus generated a daily dynamics of Microcystis metabolism, whose oscillations were similar to those obtained by [7]. The transfer from C to M was not influenced by temperature but Microcystis movement was, in this case, imposed by the irradiance factor. When the carbon reserve responsible for the ballast effect was not fed anymore by photosynthesis, the only active process was the biosynthesis that gradually lightened the cell by consuming the ballast. In a first step, Microcystis went on sinking more slowly until its density balanced with water density; then becoming lighter and lighter, it returned towards the surface. In contrast with the sedimentation phase, crossing the euphotic zone did not represent a discontinuity in the buoyancy behaviour, since it occurred at the end of the day. The peak joined the surface at 1 a.m. and stayed there until the beginning of the following cycle, which was initiated by photosynthesis (Fig. 7). Under the conditions of this scenario, the fact that the peak floated up during the night enabled the start of each cycle at the same hour, which constitutes an adjustment to the solar rhythm and showed that the migration dynamics were reproducible with a periodicity of 48 hours.
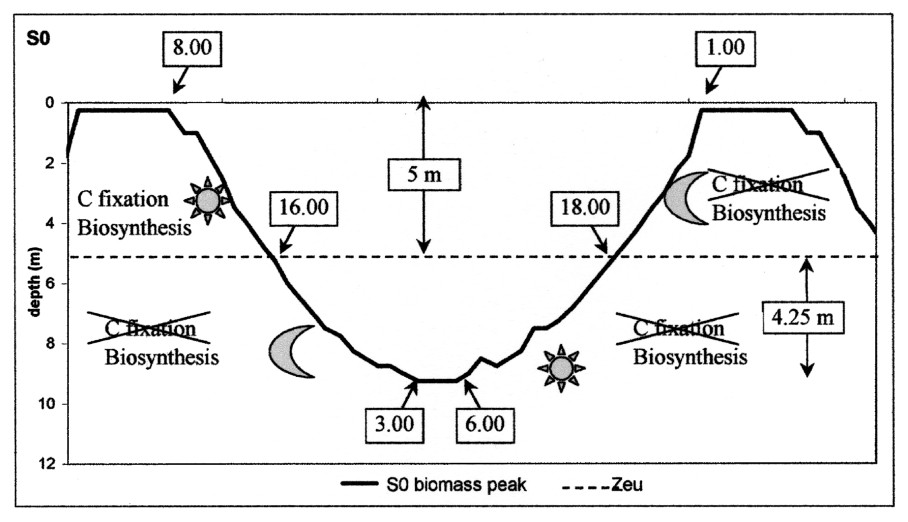
Schematic representation of the migration cycle over 48 h in scenario S0. Zeu = lower limit of the euphotic zone.
An empirical model of Microcystis vertical migration has been elaborated by [25], which takes into account the response time of colonies to the fluctuations of light. As well as in this present work, the fluctuations of density and the vertical migration in a quiescent water column predicted by their model were oscillatory and followed the light rhythm. The idea to be emphasised here is that different models, both elaborated from experimental values, have led to similar results in terms of migration behaviour. Moreover, field observations of Microcystis water blooms in Lake Kasumigaura can be considered as a validation of the processes described in the model, as they confirm that the phenomenon of appearance and/or disappearance of the water bloom is oscillatory [26]. The vertical profiles of concentrations measured in situ by these authors showed a recurrent ascent of colonies during the end of the night and early morning, which accumulated at the surface of the lake and lost buoyancy in the late morning. They thus observed a diurnal period for the oscillations in the lake; the model they developed predicted a migration with a period of about 3 days, and in this work we obtained a 2-day periodicity. Experimental measures and simulation results do not contradict as the periodicity of the movement is influenced by environmental conditions, which are not rigorously the same in all these cases.
Fig. 6 illustrates the flux of carbon fixation in the peak as calculated by the model. It points out the sense of ‘obscure episode’ for the algae: night or falling below the euphotic zone, as well as the stand-by phase at the surface, which permits the synchronisation between migratory and light cycles. The model thus accurately reproduced the ability of Microcystis to move vertically in the water column. Distance covered by colonies in the model is consistent with observed speeds given by the literature, as mentioned above. As emphasised by [8], such movements present an important ecological significance for Cyanobacteria: in well segregated waters (where nutrient-rich layer is distinct from lighted layer), the ability to carry out rapid vertical migrations, through an adjusted buoyancy, is greatly advantageous to give an access to both layers.
6 Conclusion
The model elaborated allowed us to identify the effect of irradiance and temperature upon the metabolism and migratory behaviour of Microcystis colonies. Under conditions of permanent irradiance (I) and temperature (T), an equilibrium state was reached in the model: stabilisation of colonies at a constant depth depending on T when temperatures were comprised between 20 and 8 °C, and stable oscillation below the euphotic zone when the temperature was below 8 °C.
Low temperatures had a great impact on biosynthesis, since the use of carbon reserves depends on this factor, leading to a rise in the C/M ratio and so to colony sedimentation down to a depth as deep as T was low. Moreover, we noted a threshold temperature of 12 °C: above it, the population could survive, whereas below it, growth activity could not proceed and biomass decreased until it disappeared.
Available irradiance has an impact on the amount of carbon that Microcystis accumulates during photosynthesis. This factor strongly operated on density variations of colonies: these became heavier and tended to sink when they received a sustained irradiance. The sedimentation speed and depth were also connected with the intensity of the irradiance experienced.
Colony diameter influenced their displacement speed and acted on the amount of time they spent in the lighted zone. Our calculations showed that depth at which colonies balanced their intracellular flux of carbon corresponded with a pair of values [I,T] that was independent of colony diameter. However, small colonies could not reach this equilibrium state when temperature was 5 °C or less since they sank down to the bottom of the lake and did not remain in the water column.
In this sensitivity analysis, the equilibrium states reached with permanent regimes of light and temperature that are close to culture conditions are consistent with experimental results obtained in the literature. Some discontinuities, more particularly due to threshold values of temperature causing irreversible changes from one state to another, incite us to further explore this model, while progressively getting closer to more realistic environmental conditions, with the aim to reproduce some discontinuous behaviour observed in situ during Microcystis blooms.
Acknowledgements
This work was carried out in the frame of a research programme between ‘Électricité de France’ and CESAC (‘Centre d’écologie des systèmes aquatiques continentaux, université Paul-Sabatier, Toulouse, France).