

1 Introduction
The application of expression arrays to many types of analyses is limited by the amount of available sample. Without RNA amplification, most array protocols require a minimum of 20 μg of total RNA or 1–2 μg of mRNA [1,2]. In practice, this corresponds to the RNA from approximately 105–106 cells. Acquiring this number of cells is simply not possible with many kinds of clinical specimens such as those from needle biopsies [3], microdissected tissues [4], single cell studies [5,6], experimental models for studying embryonic tissue [7], or rare cell types [8].
Two primary approaches have been taken to overcome this limitation, amplification of the signal and amplification of RNA. Signal amplification takes many forms ranging from the tyramide-based signal amplification (TSA) procedure, which claims to enhance fluorescent signal up to 1000-fold [9] to dendrimer technology (many fluors per label), which is reported to increase signal by up to 16 fold [10]. While these methods are highly promising, the amplification of the RNA sample itself is in more common use. RNA amplification is typically based on either T7 amplification of RNA [5,6] or PCR methods [11–16]. The advantage and disadvantage of these amplification methods have been described [17–20]. We chose the Eberwine method mainly based on the advantage of it is linear amplification, which will generate less amplification bias than PCR. Moreover, RNA amplification by in vitro transcription has become the standard labeling protocol for the Affymetrix GeneChip technology [1,21] and is in common use in a number of laboratories using other microarray systems [4,13]. There are many protocols for RNA amplification and several amplification kits have been commercially developed and tested on arrays (http://www.ambion.com, http://www.arctur.com).
To date, there have been numerous publications on the use of T7-based amplification for array analysis [4–6,22,23]. However, there has been little data presented in which a systematic analysis of the fidelity of RNA amplification system was undertaken [4,24,25]. The majority of the literature to date focuses on the range of amplification and use aRNA from multiple rounds of amplification directly, without presenting an investigation of the quality of the first-round amplified products. In a few recently published papers in which amplification fidelity was investigated [24,25], there was limited replica data and hence limited statistical analysis. For example, Marincola et al. only showed the reproducibility of the selected genes as a function of the amount of input total RNA and polyA RNA [24]. The work of Reynolds et al. [26] showed that ratio data was generally consistent when amplified and non-amplified samples are compared, but did not provide detailed data on how many false positives and false negatives might be selected when amplified samples are used, e.g., the primary focus was on demonstrating that overall, the trends and ratios were well correlated as opposed to investigating the percentage of outliers. Since the focus of many array investigations is the definition of expression differences between different samples, the percentage of false positives in the list of genes selected as ‘differentially expressed’ is a major concern. All of the previous investigations of amplification fidelity left several questions unanswered. Prior to fully adopting RNA amplification in our own laboratories, we felt that the following questions needed to be carefully investigated: (i) What fraction of genes sampled are amplified non-linearly? (ii) What is the effect of RNA amplification on comparative expression measurements? E.g., does RNA amplification of two different samples affect gene expression ratios and if so how often and by how much? (iii) If there is amplification bias, is the bias dependent on the degree of amplification or the amount of starting material? (iv) Does amplification increase the overall variability of the results? E.g., is the standard deviation of replicate measurements increased with amplified samples and if so by how much?
To answer these questions we performed array experiments in which RNA was amplified and compared to both non-amplified and amplified samples. As described in detail in the methods section below, several variables were investigated – reproducibility of the amplifications (via replicate amplifications), reproducibility of the array results (replicate arrays and replicate amplifications), the effect of varying the input amount, the effect of starting with mRNA or total RNA, and the effect of using different methods of amplification (kits and in-house methodologies). A total of 64 arrays containing 7500 genes spotted in duplicate on each array were used in this study. To our knowledge, this is the first large-scale array-based analysis of amplification in which numerous replicate analyses were performed across such a wide range of starting amounts and amplification protocols.
2 Material and methods
2.1 Cell lines and microarrays
Two cell lines, Hela [27] and HelaE4 [28], were selected as a model system for these studies. HelaE4 is a Hela cell line that has been transfected with an empty pTRE [29] expression vector. Hela and HelaE4 show reproducible differential expression when cultured under similar conditions. These cell lines are easy to culture in large quantities and are in regular use in our laboratory as a source of RNA with which to quality control our arrays, develop new protocols and train new array users. To carefully evaluate the effect of T7 amplification on gene expression measurements, we isolated approximately 200 μg of mRNA from both HeLa and HeLaE4. The mRNA was then aliquoted and used in array experiments as indicated in Table 1. Messenger RNA from these two cell lines was compared with and without amplification on three replicate arrays per comparison. Amplification was performed using several different amounts of starting material (50, 200, 600 ng of mRNA and 0.1, 1 and 4 μg of total RNA). Each array contained 7680 cDNAs spotted in duplicate (15360 spots). For each sample that was amplified, three independent amplifications were performed to produce aRNA samples that were used on arrays. For each comparison, duplicate arrays were hybridized (one in which Hela and HelaE4 were labeled with Cy3 and Cy5, respectively, and one in which the labeling was reversed).
Experiments done to investigate the effects of RNA amplification on gene expression ratios. In the column labeled ‘Amplification method’, E = Eberwine using the protocol described in the methods section, N = no amplification and A = amplification using a kit from Arcturus. The last column indicates the number of replica amplifications, slides that were used and labeling schemes on each slide. For example [3,3] indicates that 3 replica amplifications were performed and were hybridized to 3 slides – 3 slides for which the first cell type was labeled in Cy3 and the other cell type was labeled in Cy5 (Cy3/Cy5) and 3 slides for the labeling scheme was reversed (Cy5/Cy3). In experiments 1–3, the effect of comparing non-amplified mRNA to amplified mRNA from the same sample was investigated. In these experiments, a large number of genes (2–6%) were observed to be differentially amplified. In experiment 4, it was discovered that amplified vs. amplified samples did not show significant differential amplification, even with a 3-fold difference in starting amount. Experiments 5–8 were designed to investigate the effect of amplification on gene expression ratios using two different samples (Hela vs. HelaE4) and across a>10 fold range of sample amount. In experiments 1–8, if the sample was amplified it was amplified from mRNA to assure that any differences observeed were not due to differential isolation of during the polyA selection step. Experiments 9–14 look at the effect of amplifying from total RNA as is more typically done
| Expt. # | Cell types | RNA type for | RNA input for | Amplification | RNA type used | Number of replicates |
| compared | or labeling | amplification (ng) | method | for labeling | [Cy3/Cy5, Cy5/Cy3] | |
| 1 | Hela/Hela | mRNA/mRNA | 50/N | E/N | aRNA/mRNA | [3,3] |
| 2 | Hela/Hela | mRNA/mRNA | 200/N | E/N | aRNA/mRNA | [3,3] |
| 3 | Hela/Hela | mRNA/mRNA | 600/N | E/N | aRNA/mRNA | [3,3] |
| 4 | Hela/Hela | mRNA/mRNA | 200/600 | E/E | aRNA/aRNA | [1,1] |
| 5 | Hela/HelaE4 | mRNA/mRNA | N/N | N/N | mRNA/mRNA | [3,3] |
| 6 | Hela/HelaE4 | mRNA/mRNA | 50/50 | E/E | aRNA/aRNA | [3,3] |
| 7 | Hela/HelaE4 | mRNA/mRNA | 200/200 | E/E | aRNA/aRNA | [3,3] |
| 8 | Hela/HelaE4 | mRNA/mRNA | 600/600 | E/E | aRNA/aRNA | [3,3] |
| 9 | Hela/HelaE4 | total/total | 1000/1000 | E/E | aRNA/aRNA | [3,3] |
| 10 | Hela/HelaE4 | total/total | 4000/4000 | E/E | aRNA/aRNA | [3,3] |
| 11 | Hela/HelaE4 | total/total | 1000/4000 | E/E | aRNA/aRNA | [1,1] |
| 12 | Hela/HelaE4 | total/total | 100/100 | A/A | aRNA/aRNA | [1,1] |
| 13 | Hela/HelaE4 | total/total | 1000/1000 | A/A | aRNA/aRNA | [1,1] |
| 14 | Hela/HelaE4 | total/total | 4000/4000 | A/A | aRNA/aRNA | [1,1] |
We used the same pools of mRNA for all these experiments to reduce artifacts that could be caused by cell culture differences or differential degradation/isolation of specific messages. In addition, we also performed similar experiments in which total RNA was the starting material and in which commercial amplification kits were used. The growth conditions for the cell lines and the methods used to isolate the RNA can be found at our supplemental data web site (http://www.expression.washington.edu/public).
2.2 T7 amplification of RNA
We used the Eberwine T7 amplification protocol [10,11], with some minor modifications. The complete protocol may be found on our web site (http://www.expression.washington.edu/public). To test the viability of using a commercially available kit for RNA amplification, we tested both the Ambion and Arcturus RNA amplification kits. All the kit-based data presented in this publication was produced using the Arcturus kit. Amplification using the Arcturus kit followed the provided instructions (web: http://www.arctur.com).
2.3 Microarrays, preparation of labeled sample and hybridization
DNA microarrays were prepared in the Center for Expression Array (CEA) at University of Washington. The arrays were produced by spotting PCR products derived from a 15K set of sequence-verified human cDNAs obtained from Research Genetics. The arrays were spotted onto Amersham Pharmacia Biosciences (APB) type 7 mirrored slides using a Generation III Microarrayer from the Molecular Dynamics Division of APB. Each slide contains 7680 cDNAs spotted in duplicate (15 360 spots). Labeled cDNAs were produced via reverse transcription from target RNA using oligo-dT, random primers, dNTPs and Cy3 or Cy5 labeled dCTPs. Labeled samples were hybridized to arrays as indicated in Table 1. Hybridization was done in a 50% formamide buffer at 42 °C for 16 hrs. After incubation, the slides were washed following standard protocols. After washing, the arrays were scanned using Array Scanner generation III from the Molecular Dynamics division of APB. The complete protocols for array production, sample labeling, hybridization and slide washing may be found on our web site (http://ra.microslu.washington.edu/microarray/index.htm).
2.4 Data analysis and verification
Microarray data was quantified and analyzed using an in-house software package named ‘Spot-on’. This software has been developed by our group to perform image analysis, normalization, and statistical analysis of replicate data and selection of differentially expressed genes. Briefly, this software is split into three components – Spot-on Image, Unite and Select. Spot-on Image is a program that performs spot finding and quantification of the image. Spot-on Unite performs a non-linear normalization [30] and averages replicate data (including that produced in a flipped color experiment) to produce means and error estimates for each measurement. Spot-on Select is used to select genes that are differentially expressed by a statistically significant amount.
Genes with ratios that did not agree between methods (non-amplified or different methods of amplification) were further investigated by Northern analysis [31]. Full protocols are available at our supplemental data web site. Washed blots were exposed to phosphor image screens and scanned on a Storm phosphor imager (Molecular Dynamics). Data from the Phosphorimager were quantified using Image Quant software (Molecular Dynamics), to integrate the relative intensity of each band. Data from GAPDH was used to normalize that data across all samples. Our array analyses indicate that GAPDH is not differentially expressed between Hela and HelaE4 cell lines under the conditions used in this publication.
3 Results
3.1 Quality/quantity of amplified RNA
RNA quantity was quantified by UV/Vis spectroscopy both pre- and post-amplification. For one-round of amplification with our modified Eberwine T7 amplification protocol, we obtained a range of 180 to 40 fold amplification from 50 to 600 ng of input mRNA and a range of 9–140 fold from 4 to 0.1 μg of total RNA Note that the fold change was calculated as [amount of aRNA/amount of input RNA] for both total and mRNA (Fig. 1). Since total RNA is estimated to contain approximately 2% mRNA, the true fold change for the total RNA samples is probably 50 fold higher. When quantification is only done by UV/Vis spectroscopy, smaller amounts of input RNA generated higher apparent degree of amplification (up to 104-fold from 2 ng of mRNA). However, as shown in Fig. 2, the size distribution of aRNA is strongly dependent on input quantity. When the RNA input is below 50 ng of mRNA or 100 ng of total RNA, the average size of the aRNA is less than 200 nucleotides. No detectable product was detected with the Bioanalyzer for the negative control (e.g., no input RNA) for the amplification (data not shown). This decrease in aRNA size as a function of input level has also been observed after the second round of amplification by Eberwine et al. [6] or after a single round amplification by the Arcturus group (http://www.arctur.com).
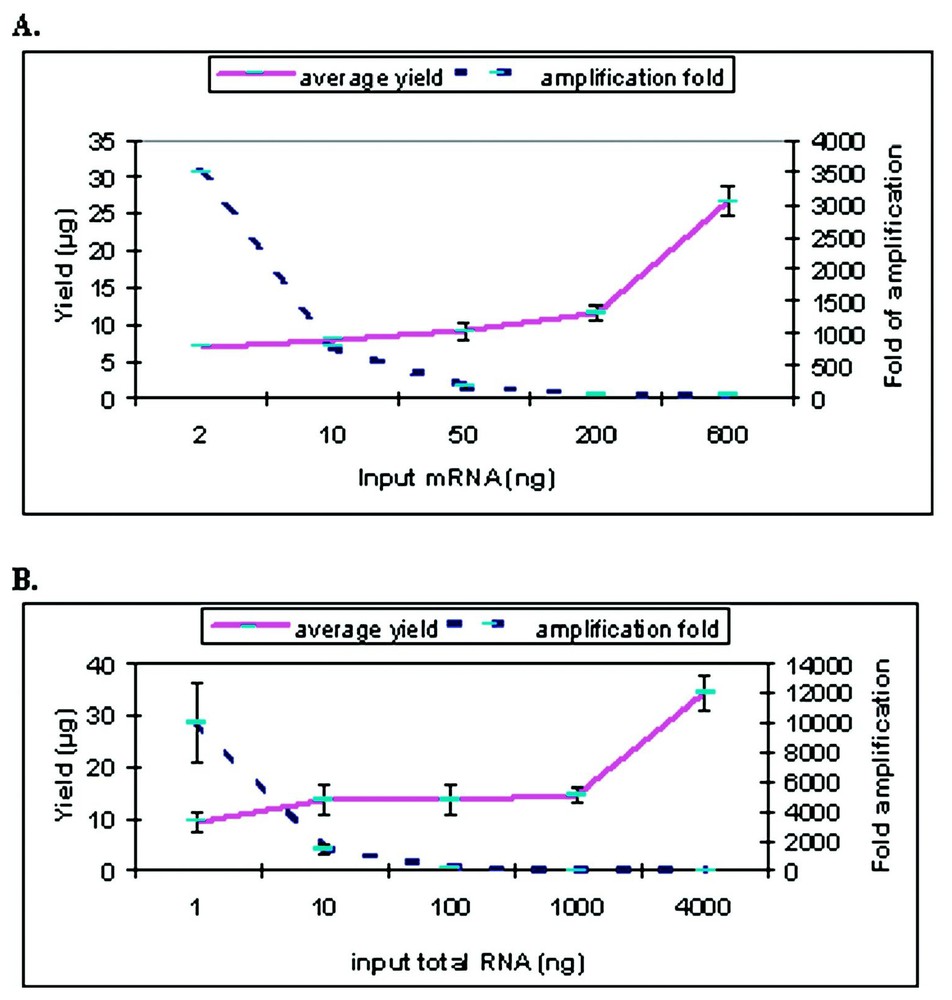
Quantification of amplified RNA from different amount of input RNAs. (A) Amplification from mRNA. (B) Amplification from total RNA. The solid line indicates the yield of amplification change as shown on the left; the dotted line indicates the fold of amplification change on the right. The bars indicate the standard deviation based on multiple sets of amplifications.
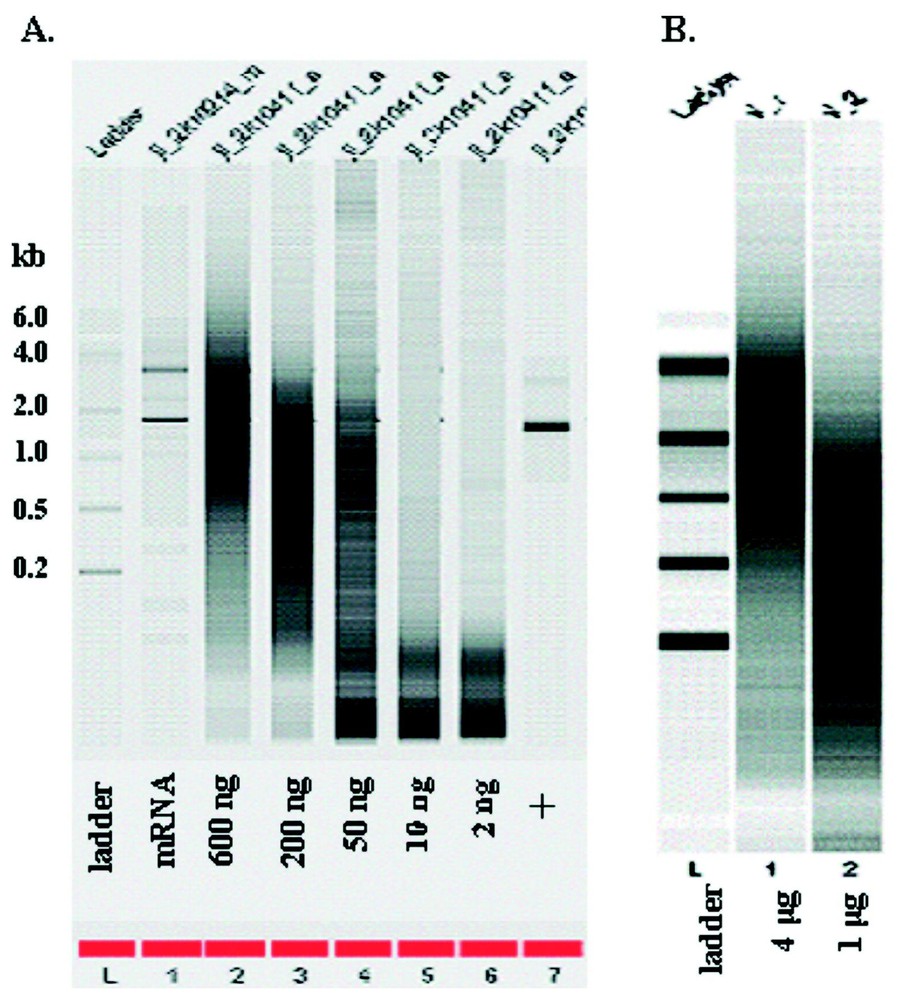
Bioanalyzer analysis of aRNA quality. (A) Amplification from mRNA input. (B) Amplification from total RNA input. The numbers on the left show the size of the ladder in kb. The numbers below the gel show the amount of input RNAs. + stand for the positive control using control RNA from the amplification kit.
3.2 Comparison of amplified to non-amplified RNA
In order to investigate bias in RNA levels due to amplification, we first compared non-amplified mRNA and amplified RNA (aRNA) using wild type Hela cells via microarray analysis. We used 2 μg of each mRNA and aRNA (amplified from 600, 200, 50 and 10 ng input mRNA) to make probes. The RNA used in the amplification procedure was an aliquot of the mRNA preparation used for the non-amplified sample. Two micrograms of aRNA or mRNA (as determined by UV/Vis spectroscopy) was used in each labeling reaction. For the amplified samples, the yield of fluorescently labeled probe decreased as a function of input RNA amount. This is consistent with the observed decrease in the size of the aRNA as a function of input amount. We got only background level of probes using aRNA generated from 10 ng of mRNA.
The array results from the comparison of aRNA with mRNA showed a significant number of differentially expressed genes (Fig. 3). However, no significant difference was found between aRNA from 200 ng input and 600 ng input. This demonstrated that there is an apparent bias in the amplification of certain RNAs but that the bias is consistent across different samples and at least a 3-fold difference in input RNA level.
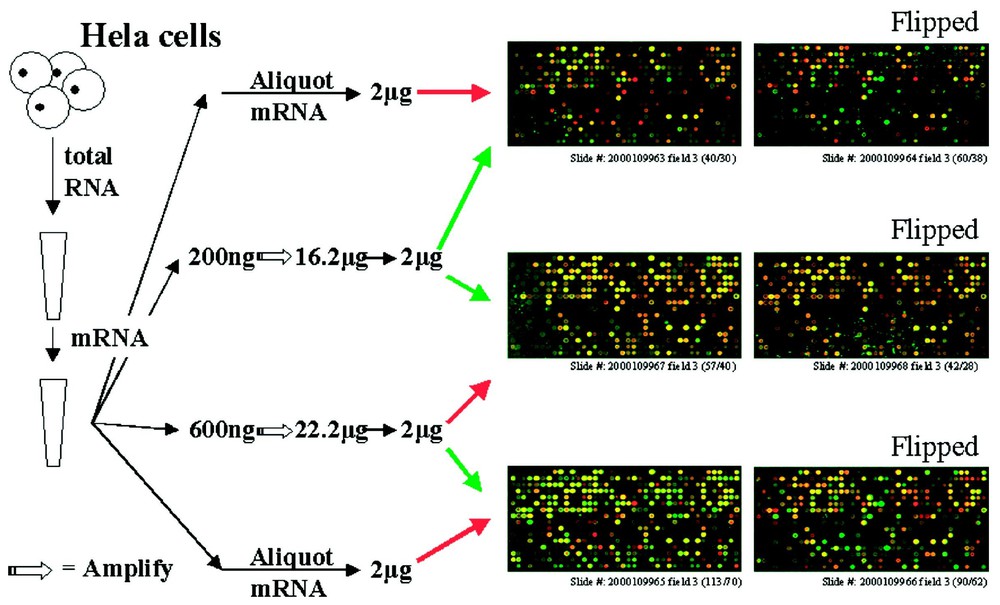
Microarrays with aRNA and mRNA. Total and messanger RNA were isolated from cultured wild-type Hela cells. Different amount of mRNA (50, 200, 600 ng) were amplified and same amount of aRNA and mRNA were labeled either with red or green dye and hybridize on the glass arrays. The three figures on the left showed the third of the 12 fields on each slide as labeled, the right showed the inverted color labeled arrays.
To estimate the percentage of differentially expressed genes caused by amplification, we performed triplicate experiments comparing aRNA from 50, 200 and 600 ng input with mRNA. Using a selection criterion of intensity above 500, we filtered our data to 1075, 3112 and 3307 genes in each group. These data were then filtered using the criterion ‘ratio greater than ±2’, to obtain 19, 66 and 75 differentially expressed genes. These numbers represent 1.8, 2.1 and 2.3% of the detectable genes. We found that the direction of mean ratio change in the selected genes in each individual experiment of triplicate amplifications (Table 1) is reproducible, and that the data are reproducible even with different amounts of input mRNA in the amplification. Furthermore, for the same cell type, a comparison aRNA vs aRNA (experiment 4) show no detectable differential expression even when the amplifications have different input RNA. These results showed that the bias in amplification of RNA is not random and is in fact quite reproducible (Fig. 4). Hence from the above data, it does not make sense to compare amplified samples to non-amplified samples on the same array. However, a comparison of amplified sample to amplified sample should produce array results that are consistent with those obtained using the same samples without amplification.
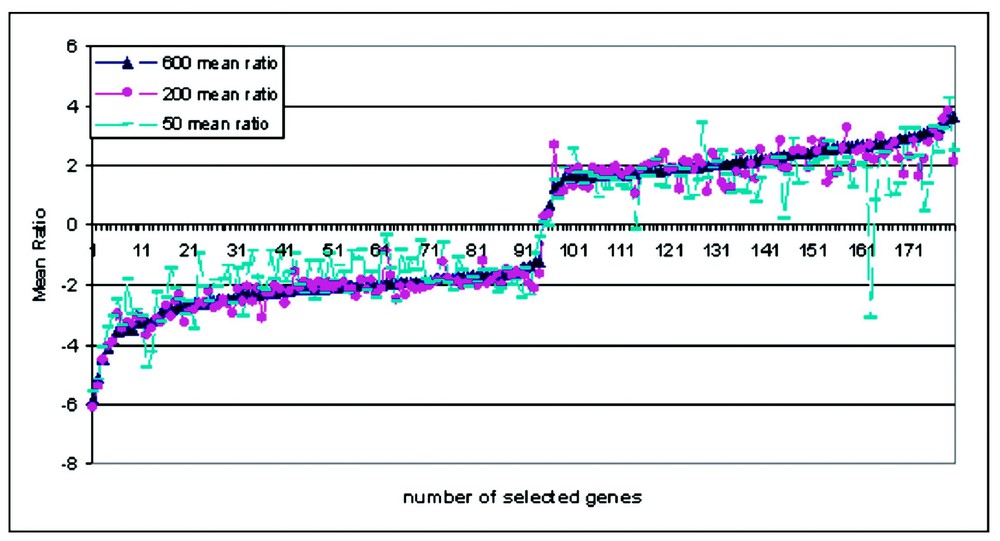
Consistency of array data between amplified RNA verse non-amplified RNA. Genes are selected from three sets of three different input amount of mRNA, the mean ratio of each gene were plotted in the order of increased ratio of selected genes. Each kind of dot show one set of different amount of input mRNA.
To investigate this more thoroughly, we designed a set of experiments to compare two different cell lines (Hela and HelaE4) with and without amplification and with amplification at various levels of input RNA, using mRNA or total RNA as input to the amplification procedure and with different methods of amplification (Table 1, experiments 5–14). In all experiments the source of RNA (mRNA or total) was from one master batch of total RNA. All amplifications were performed in triplicate except for those done with the Arcturus kit.
3.3 Data analysis
All experiments were analyzed using the same set of criterion for selection of differentially expressed genes. These criterion are: (i) The intensity of the signal (sum of Cy3 + Cy5 signal) must exceed a value 500 arbitrary fluorescent units. A value of 500 was chosen by visual inspection of log ratio vs. log intensity plots to be approximately 3–5 fold above background noise; (ii) The ratio (±) 1 standard deviation of the replicate measurements must be greater than ±2-fold.
Due to experimental variation and signal-to-noise differences, different experiments will yield different numbers of genes and slightly different sets of genes when the above criteria are applied. Hence, the comparison of the array results by looking only at the selected sets of genes is not useful. To overcome this, we took the union of all the genes that were differentially expressed in any one-array experiment. This resulted in a list of 121 genes. For all of these genes, we extracted the ratio data from each experiment and calculated a mean and standard deviation for all replicates. The full data set and the extracted set of genes are available on our supplemental web site.
Fig. 5 shows the results of the above analysis for the 20 most highly expressed and the 20 lowest expressed genes in the set of 121 differentially expressed genes. Each set of bars represents the ratio measurements (Hela/HelaE4) for one gene across multiple different amplification experiments. Error bars are indicated as standard deviations of replicate measurements. For the data generated using the in-house Eberwine procedure for amplification, the replicate data includes both replicate amplifications and replicate array results. For the data generated using the Arcturus kit, the replicates only include replicate array data – e.g., for each input RNA amount, only a single amplification was done. In general, the ratio measurements agree within the error estimates for nearly all genes and nearly all experimental conditions.
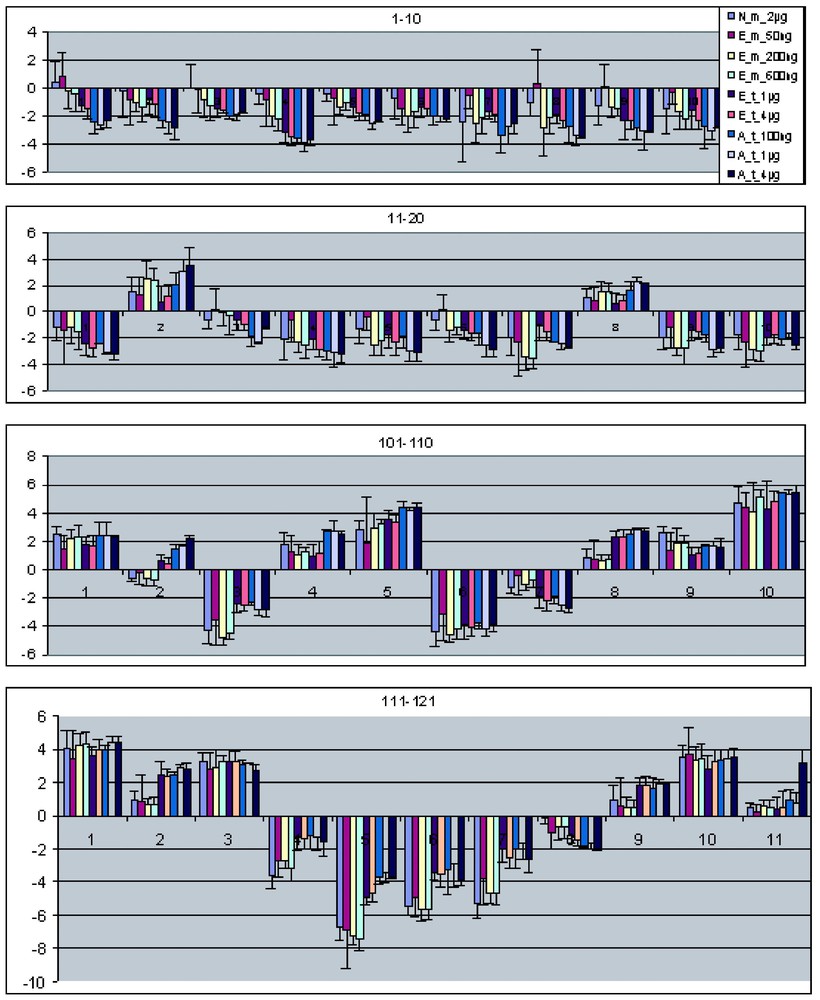
Mean ratio comparison of all nine sets of microarray data. Selected genes from nine different experiment sets (Table 1) were united, and the mean ratios of the selected genes are plotted in the increasing order of intensity. Here show the 20 lowest and 20 highest intensity genes. The bars on each column show the standard deviation of the mean ratio.
4 Discussion
In the data presented above, we looked at both bias due to amplification and the reproducibility of amplification bias. We found that while the T7 amplification procedure does differentially amplify some genes, the bias is quite reproducible. Approximately 2–5% of the genes have apparent differential gene expression ratios (more than ±2-fold) when an amplified sample is compared to the same non-amplified sample. However, when both samples undergo similar amplification procedures the differences are negligible.
By comparing RNA from two different cell lines over a 10-fold range of starting material, several different amplification protocols, replicate amplifications and replicate arrays, we have shown that, for the most part, the measured gene expression ratios agree within experimental error for all methods (Fig. 5). The exceptions to this statement are that for a small number of genes (1 in our case) there are differences in gene expression ratio that seem to depend on when mRNA or total RNA is used for the input to RNA amplification. Preliminary Northern blot analysis shows consistency of the microarray data with amplification from total RNA input (selected gene number 102 on Fig. 5 Northern data on supplement website). This effect was observed for 0.8% of those selected as differentially expressed or 0.013% of the total number of genes on the array. We note that the quoted percentages are dependent on the criteria used for ‘differentially expressed’, but in general, the percentage of genes that appear to show this effect is very small. Regardless of the criteria used for selection of differential expression, greater than 95% of all measured expression ratios agree within the error estimates for all the experiments we have performed.
We have not yet tested multiple rounds of amplification on the reproducibility of microarray results. However, we suspect that the observed variation in amplified samples is generated primarily in the initial reverse transcription step. In our hands, the average length of amplified RNA is strongly dependent on the amount of input RNA. While we have obtained very good results using as little as 50 ng of input mRNA, the average length of the aRNA produced from smaller input amounts was quite short and the signal-to-noise of the array data from these samples was low. Hence, there is a lower limit to the amount of RNA that we can effectively amplify. For us, this lower limit is approximately 50 ng of mRNA (using our protocol) or 100 ng of total RNA (using the Acturus kit, which has been highly optimized for low sample amounts). Previous papers showed that the first round of amplification can generate as much as 1000 to 2000 fold of amplification, and the second-round may generate another 1000 fold [10,29,31]. Typically these results are based solely on UV/Vis spectrometric measurements to quantify the RNA. We showed here that this measure couldn't be used to judge the efficiency or quality of the amplification, as the average length of the aRNA depends on the input amount of RNA (Fig. 1). Hence, if only OD260 is used to quantify the amount of amplified RNA, one will likely over estimate the amount of useful aRNA produced.
Although our T7 amplification data show great fidelity and consistency of the selected genes, we found that with less input RNA, or using mRNA rather than total RNA for the amplification, the signal-to-noise of the array results was reduced. Hence with the same selection criteria, we select fewer genes as differentially expressed using small amounts of sample. In our hands, array data produced by amplifying 50 ng of mRNA is roughly equivalent in signal-to-noise to array data produced from using 2 μg of non-amplified mRNA provided one applies all of the aRNA to the array. If one only applies 2 μg of aRNA to the array or if one starts with less than 50 ng of mRNA, the detectable transcripts are reduced and the predominant gain or loss of information is at the expense of the low abundance messages. RNA degradation also affects the quality of the array data [32] and reduces the number of observable transcripts. This reminds us of the inherent limitations of PCR amplification due to the ‘Monte Carlo’ effect – e.g., there are small and random differences in amplification efficiency depending on the abundance of the template [33]. We anticipate that the Monte Carlo effect will be seen in RNA amplifications from very small samples such as RNA from single or very few cells. Therefore, one should anticipate that both random fluctuations in amplification efficiency and cellular fluctuations in the abundance of rare messages would result in significant variability in gene expression measurements. Hence, even if sufficient quantities of aRNA are produced from these very small samples, the results of gene expression measurements on low abundance transcripts may not be biologically meaningful. Additional research should be done to more fully investigate the reproducibility of multiple rounds of RNA amplification and both the practical and theoretical limitations of amplifying RNA from very small samples.
Acknowledgements
The authors would like to thank Kimberly Smith, Suzanne Oakley, Darran May for the technical support in preparing the RNA, and DNA arrays and Dr. Masha Smith, Dr. Angelique B. van't Wout and Dr. Gary K. Geiss for the help in protocol development and data analysis. We would also like to thank Grogan Melany for the work in Northern blot analysis.