

1 Introduction
Molecular biology as a field would probably not exist in its present form were it not for the impact of the beautiful little book What is Life? [1] written by Ernst Schrödinger (one of the fathers of quantum mechanics). What is Life? was the written account of a series of lectures given by Schrödinger at the Dublin Institute for Advanced Studies in 1943. What is Life? was partially inspired by the work of the physicist Max Delbrück and was probably instrumental in recruiting a whole generation of theoretical physicists like Walter Gilbert, Leo Szilard, Seymor Benzer, and Francis Crick away from physics per se and into the exciting new area of ‘molecular biology’ [2]. The results are history, but it has not ended there. For example, the current director of the Whitehead Center for Genomic Research at the MIT is Eric Lander, whose D. Phil. from Oxford was not in molecular biology but rather in mathematics (algebraic coding theory)! The mathematical and physical sciences continue to play a large role in the whole area of molecular biology and some of the potential areas of impact are detailed in the March 2001 issue of Chaos [3].
The operon concept [4], introduced by Jacob and coworkers in 1960 [5], has had a profound and lasting effect on the biological sciences. Not long after the operon concept was developed, Goodwin [6] gave the first mathematical analysis of operon dynamics. Griffith then put forward a more complete analysis of simple repressible (negative feedback [7]) and inducible (positive feedback [8]) gene control networks, and Tyson and Othmer [9] have summarized these results. Extensions considering the stability of inducible operons were published by Selgrade [10,11] and Ji-Fa [12], but none of these treatments considered the role of the DNA transcription and mRNA translation delays though Tyson and Othmer pointed out that both should be considered.
In this paper we present recent mathematical modeling work on operon dynamics. In Section 2 we treat the (repressible) tryptophan operon, and in Section 3 the (inducible) lactose operon is considered. In both cases we have made every effort to construct biologically realistic mathematical models and to make accurate parameter estimation from the biological literature. In Section 4, we conclude the paper with some general comments related to our philosophical approach to the modeling of these systems.
2 The repressible tryptophan operon
After Jacob et al. introduced the operon concept [5], the development of more refined experimental techniques and the acquisition of more data made it clear that in addition to repression there are many regulatory mechanisms involved in the control of operons. These mechanisms vary from operon to operon. One of the most intensively studied of these systems from an experimental point of view is the tryptophan operon. An excellent review of this system and its regulatory mechanisms is to be found in [13].
2.1 The Bliss model
One of the first mathematical models of the tryptophan operon was introduced by Bliss et al. in 1982 [14]. The independent variables of this model are the trp mRNA concentration (M), the concentration of anthranilate synthase (E) which, according to Bliss et al., of all the enzymes formed with the polypeptides of the tryptophan operon is the most important from a regulatory point of view, and the tryptophan concentration (T). The equations governing the dynamic evolution of these three quantities are
| (1) |
| (2) |
| (3) |
Bliss et al. assumed that R can be modeled by a Hill function
This model clearly considers two different regulatory mechanisms, repression and enzymatic feedback inhibition by tryptophan. R(T) accounts for repression, while I(T) stands for feedback inhibition. Bliss et al. also assert that I(T) can be modeled by a Hill function
The authors made a careful estimation of the parameters in this model based on the available experimental data. They solved the model equations numerically and also performed an analytical stability analysis of the steady states. They were able to reproduce the results of derepression experiments with cultures of wild and mutant E. coli strains reported in [15]. From these experiments, the tryptophan operon loses stability in mutant E. coli cell cultures that have a partial loss of of feedback inhibition. The previously stable steady state is replaced by an oscillatory production of tryptophan [15]. This mutation is modeled by increasing Ki to ten times its wild type value. However, to our knowledge, these experiments have never been successfully repeated. Moreover, more recent experimental evidence has demonstrated that the function R(T), which Bliss et al. used to model repression, is in disagreement with the experimental facts about the interaction between the trp operon and repressor molecules. The issue of oscillations in tryptophan control was revisited by Xiu et al. [16] in their investigation of the role of growth and dilution rates on stability.
2.2 The Sinha model
In 1988, Sinha [17] introduced a different model for the tryptophan operon regulatory system in which the DNA-repressor interaction is modelled in a more detailed way. The independent variables of the Sinha model are the same as in the Bliss et al. model, i.e. the trp mRNA concentration (M), the anthranilate synthase enzyme concentration (E), and the tryptophan concentration (T). The dynamic equations for these variables are
| (4) |
| (5) |
| (6) |
When produced by the trpR operon, repressor molecules are unable to repress trp operons. For this repression to take place, they need to be activated by two tryptophan molecules which sequentially bind non-cooperatively in two independent places. From this, and assuming that this reaction takes place in a quasi-steady state, Sinha obtained the concentration of active repressor given by RA=nTR/(T+Kd), where n=2, R is the total repressor concentration, and Kd is the repressor activation dissociation constant.
Compared with the Bliss et al. [14] model, the Sinha model considers the DNA-repressor and repressor-tryptophan interactions in a more detailed way. It also ignores the fact that anthranilate synthase is feedback inhibited by tryptophan as well as ignoring the time delays inherent to the system. These are both important features of the tryptophan operon regulatory system.
It is also important to note that Sinha assumes a constant tryptophan consumption rate Gmax. Observing this, Sen and Liu [18] modified the Sinha model to study the case of a non-linear tryptophan consumption rate given by a Michaelis–Menten-like function G(T)=GmaxT/(T+Kg). Sinha, as well as Sen and Liu, studied the stability of their models for various values of parameters Ko and K2 and found the corresponding stability regions in the (Ko,K2) parameter space. However, they neither compare their models with experimental data nor do they discuss whether the values for Ko and K2 where stability is lost are physiologically attainable in wild type or mutant bacterial strains.
2.3 A more detailed model
Recently Santillán and Mackey [19] introduced a more detailed mathematical model of the tryptophan operon regulatory system, which is shown schematically in Fig. 1. In this model, all of the known regulatory mechanisms of the tryptophan operon (repression, transcriptional attenuation, and enzyme feedback inhibition) are taken into account. The system inherent time delays due to transcription and translation are also included, as well as the mRNA dynamics. The model considers four independent variables: The concentration of trp operons with operators free to be bound by mRNA polymerase molecules (OF), the concentration of trp mRNA molecules with free TrpE-related ribosome binding sites (MF), the concentration of the enzyme anthranilate synthase (E), and the tryptophan concentration (T).
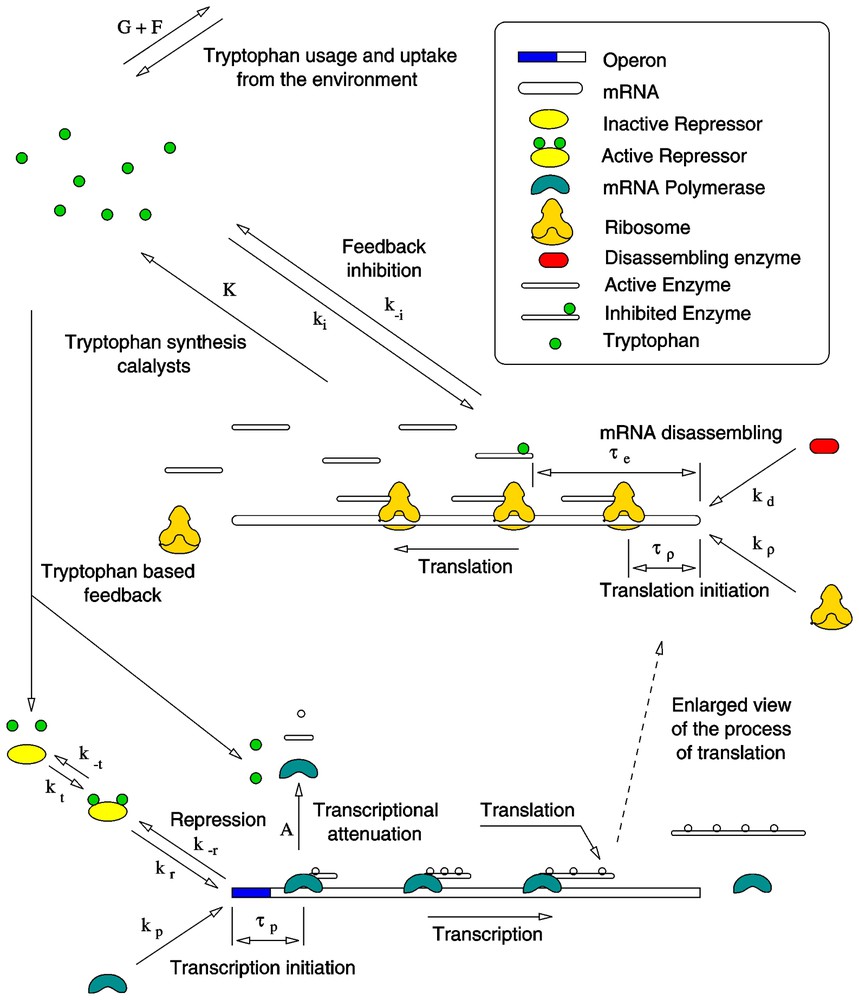
Schematic representation of the tryptophan operon regulatory system. See the text for a detailed description.
Although five different polypeptides are synthesized during the expression of the trp operon and they combine to form the enzymes that catalyze the reaction pathway which synthesizes tryptophan from chorismic acid, this model concentrates on anthranilate synthase. The reason for this focus is that this enzyme is the most important from a regulatory point of view since it is subject to feedback inhibition by tryptophan and is the first to play its catalytic role in the reaction pathway [13].
Anthranilate synthase is a complex of two TrpE and two TrpD polypeptides. From this, Santillán and Mackey assume that the anthranilate synthase production rate is one half that of the TrpE polypeptide and look only at the TrpE-related ribosome binding sites of the mRNA chain. The equations governing the dynamics of these variables are:
| (7) |
| (8) |
| (9) |
| (10) |
The factor
μ is the growth rate of the bacterial culture. The term μO stands for the operon production rate due to DNA replication, which was assumed to be such that it keeps the total operon concentration at a constant value O, balancing dilution by growth.
The term
In Eq. (8), τm is the time it takes for a polymerase to produce a mRNA chain long enough to have an available TrpE-related ribosome binding site. A(T) is the probability for transcription to be prematurely terminated due to transcriptional attenuation. Santillán and Mackey [19] take A(T)=b[1−exp(−T/c)]. The term
The first term on the right-hand side of Eq. (9), is the anthranilate synthase production rate. The factor 1/2 is incorporated because, as mentioned earlier, the enzyme production rate is assumed to be one half that of TrpE polypeptide. The TrpE production rate equals the rate of ribosome binding free TrpE-related ribosome binding sites a time τe ago. τe is the time it takes for a ribosome to synthesize and release a TrpE polypeptide.
The tryptophan production rate, the first term on the right-hand side of Eq. (10), is assumed to be proportional to the concentration of active (uninhibited) enzymes (EA) with a proportionality constant K. Anthranilate synthase is inhibited when two tryptophan molecules bind the TrpE subunits in a sequential cooperative reaction with a Hill coefficient of nH≃1.2. The enzyme feedback inhibition reaction rate constants support a quasi-steady state assumption, from which
All of the model parameters were estimated from the available experimental data. The details are given in Reference [19] supplementary web material. In Table 1 the value of all these parameters is shown.
The tryptophan model parameters as estimated in [19]
| R≃0.8 μM | O≃3.32×10⁻³ μM |
| P≃2.6 μM | k−r≃1.2 min−1 |
| ρ≃2.9 μM | kr≃460 μM−1 min−1 |
| τp≃0.1 min | k−i≃720 min−1 |
| τm≃0.1 min | ki≃176 μM−1 min−1 |
| τρ≃0.05 min | k−t≃2.1×10⁴ min−1 |
| τe≃0.66 min | kt≃348 μM−1 min−1 |
| γ≃0 min−1 | kp≃3.9 μM−1 min−1 |
| kdD≃0.6 min−1 | kρ≃6.9 μM−1 min−1 |
| nH≃1.2 | μ≃1.0×10⁻² min−1 |
| b≃0.85 | c≃4.0×10⁻² μM |
| Kg≃0.2 μM | g≃25 μM min−1 |
| e≃0.9 μM | d≃23.5 μM min−1 |
| f≃380 μM | K≃126.4 min−1 |
The model was solved numerically, and the results compared with derepression experiments performed by Yanofsky and Horn [20] on wild-type bacterial cultures as well as trpL29 and trpL75 mutant strains of E. coli. In these experiments, a bacterial culture is first grown in a medium with a high tryptophan concentration during a period of time long enough for the trp operon to reach a steady state. Then the bacteria are washed and shifted to a medium without tryptophan, and the response of the anthranilate synthase activity is measured as a function of time after the nutritional shift.
The trpL29 mutant strain has a mutation A to G at bp 29 in the leader region of the trp operon. This change replaces the leader peptide start codon by GUG, and decreases operon expression in cells growing in the presence or absence of tryptophan. This mutation is simulated by Santillán and Mackey by decreasing the rate constant kp to 0.004 times its normal value.
The strain trpL75 of E. coli has a mutation of G to A at bp 75 in the leader region of the trp operon. This change decreases the stability of the transcription antiterminator structure, and increases transcription termination at the attenuator. Consequently, it decreases operon expression in cells growing in the presence or absence of tryptophan. This mutation was simulated by increasing the value of parameter b, which determines the probability of transcriptional attenuation at high tryptophan levels. The normal value of this parameter is b≃0.85, and to simulate the mutation it was increased to b≃0.9996.
The experiments of Yanofsky and Horn were simulated numerically. In all of the three cases (wild type and two mutants), the model results show a reasonable qualitative agreement with the experiments, given the simplifying assumptions inherent to the model. The results of these simulations are shown in Fig. 2.
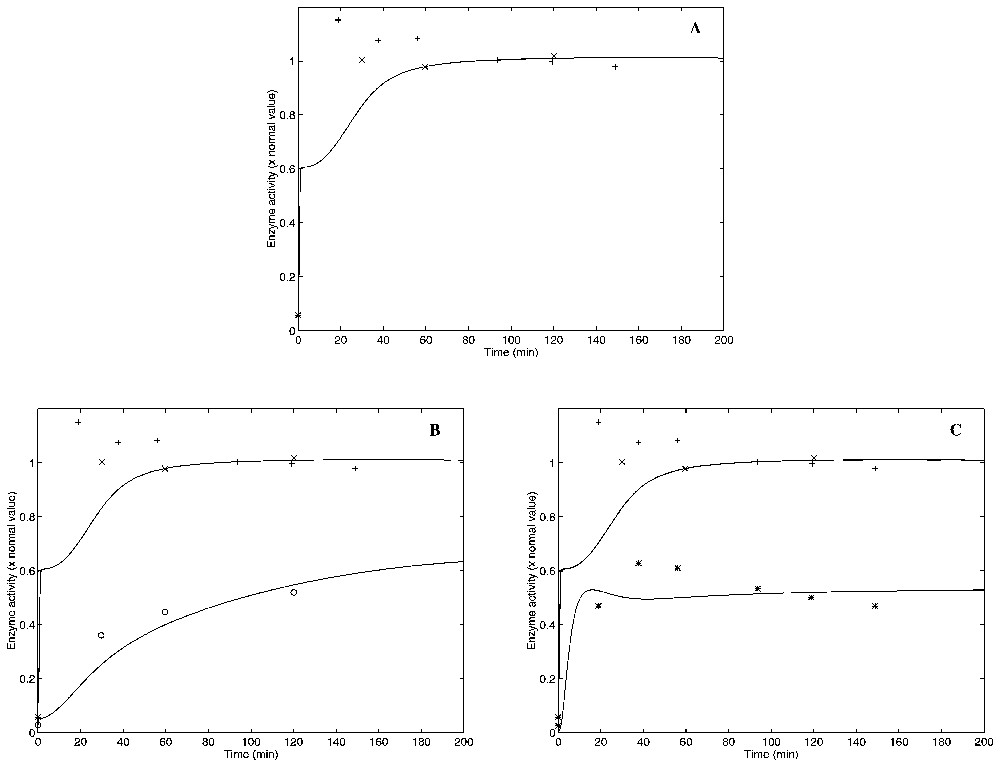
Experimentaly measured points [20] and simulated curves of anthranilate synthase activity vs. time after a nutritional shift (minimal + tryptophan medium to minimal medium), with (A) wild, (B) trpL29 mutant, and (C) trpL75 mutant strain cultures of E. coli. Two different sets of experimental results (crosses and pluses) for the wild-type strain are presented in A. One set of experimental points corresponding to the trpL29 mutant strain is shown in B with circles. Another set of experimental points for the trpL75 mutant strain is shown in C with asterisks. The corresponding simulations are shown with solid lines in all of the three graphics. The wild-type experimental points and simulation are repeated in B and C for comparison.
3 The inducible lac operon
3.1 Previous models
The lac operon is the classical bacterial example of an inducible system which encodes the genes for the transport of external lactose into the cell and its conversion to glucose and galactose. Many experimental studies have examined the control of the genes involved in lactose metabolism in E. coli. One of the most recent mathematical modeling studies of the lac operon was carried out by Wong and coworkers [21]. Although many of the relevant biological details were taken into account in their model, they failed to treat the transcriptional and translational delays. Conversely, Mahaffy and Savev [22] modeled lac operon dynamics and included transcriptional and translational delays, but ignored the conversion of internal lactose to allolactose by β-galactoside and the spontaneous production rate of mRNA together with the individual degradation terms for the proteins. In this section we give a brief summary of the work on a recent model developed by Yildirim et al. [23] on the lac operon including much of the relevant biological detail considered by Wong and coworkers [21] as well as the transcriptional and translational delays considered by Mahaffy and Savev [22]. A more complete mathematical analysis of the model presented here can be found in [23] and [24].
3.2 The mechanism
The lac operon consists of a promoter/operator region and three larger structural genes lacZ, lacY, and lacA together with a preceding regulatory operon responsible for producing a repressor (R) protein. To understand the mechanism under this control network easily, it is helpful to refer to Fig. 3. In the absence of glucose available for cellular metabolism, but in the presence of external lactose (Le), lactose is transported into the cell by a permease (P). Intracellular lactose (L) is then broken down into allolactose (A) first and then glucose and galactose by the enzyme β-galactosidase (B). The allolactose feeds back to bind with the lactose repressor and enable the transcription process to proceed. In the absence of allolactose (A) the repressor R binds to the operator region and prevents the RNA polymerase from transcribing the structural genes. However, if allolactose is present, a complex is formed between allolactose and the repressor that makes binding of the repressor to the operator region impossible. In that case, the RNA polymerase bound to the promoter is able to initiate transcription of the structural genes to produce mRNA. When a mRNA chain, long enough for a ribosome to bind it, has been produced, the process of translation is initiated. The lacZ gene encodes for the mRNA responsible for the production of β-galactosidase (B) and transcription of the lacY gene produces mRNA ultimately responsible for the production of a membrane permease (P). The mRNA produced by transcription of the lacA gene encodes for the production of thiogalactoside transacetylase which is thought to not play a role in the regulation of the lac operon [25] and will not be further considered here.
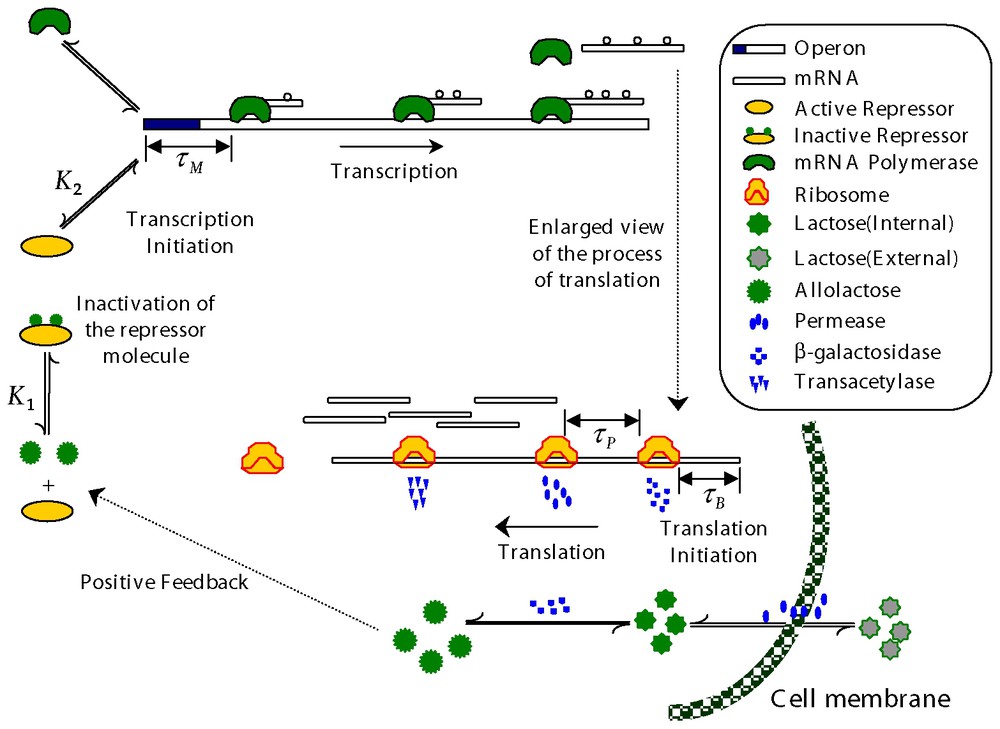
Schematic representation of the lactose operon regulatory system. See the text for a detailed description.
There is another control mechanism known as catabolite repression. The presence of glucose in the external medium inhibits the production of cAMP in the bacterium. cAMP is necessary for transcription initiation to take place efficiently. In the present work we ignore these regulatory mechanism since we compare with experimental in which there is no glucose in the culture medium and thus, cAMP is always produced at a high rate.
3.3 A new mathematical model
The lac operon regulatory pathway is fairly complex: it involves three repressor binding sites (operators), and two CAP binding sites. Moreover, one repressor can bind two different operators simultaneously [26]. A detailed model of all these regulatory elements is beyond the scope of this work. Nonetheless, according to Yagil and Yagil [27], the fraction of free operators as a function of allolactose (A) can be modeled via a Hill-type function of the form:
| (11) |
| (12) |
The dynamics of the concentration (B) of β-galactosidase are described by Eq. (13) in which τB is the time required for β-galactosidase production through mRNA translation. We assume that the rate of production of B is proportional to the concentration of M a time τB ago times a dilution factor due to cell growth during the translation process, . The loss rate of B is given by (γB+μ)B.
| (13) |
For the allolactose concentration (A) dynamics, the first term in Eq. (14) gives the β-galactosidase mediated gain in allolactose from the conversion of lactose. The second term accounts for allolactose loss via conversion to glucose and galactose (again mediated by β-galactosidase). Since they are enzymatic reactions, both of these expressions are taken to be in Michaelis–Menten form. The last term takes into account the degradation and dilution of allolactose.
| (14) |
The lactose concentration (L) dynamics are more complicated and given by Eq. (15). The first term in Eq. (15) accounts for the increase of intracellular lactose through the permease facilitated transport of external lactose (Le). The second term deals with intracellular lactose loss to the extracellular fluid because of the reversible nature of the permease mediated transport [28–31]. The third term accounts for the conversion of lactose to allolactose as well as the hydrolysis of lactose to glucose and galactose via β-galactosidase (B). The fourth term is the decrease in internal lactose concentration due to degradation and dilution.
| (15) |
The permease concentration (P) dynamics are given by Eq. (16). The first term reflects the assumption that permease production is directly proportional to the mRNA concentration a time τP in the past, where τP is the time it takes to translate a permease polypeptide. The exponential factor e−μτP accounts for dilution of mRNA concentration due to cell growth. The second term accounts for the degradation and dilution of permease.
| (16) |
3.4 Analysis of the model and comparison with experimental data
We have carried out an extensive search of the existing literature for data that would allow us to estimate the model parameters in Eqs. (12)–(16) which are summarized in Table 2, and the details of how we arrived at these parameter values can be found in [24].
The estimated parameters for the lac operon model, taken from [23,24]
| n | 2 | μ max | 3.47×10⁻² min−1 |
| γ M | 0.411 min−1 | γ B | 8.33×10⁻⁴ min−1 |
| γ A | 0.52 min−1 | K | 1000 |
| α M | 9.97×10⁻⁴ mM min−1 | τ B | 2.0 min |
| α A | 1.76×10⁴ min−1 | K L1 | 1.81 mM |
| α B | 1.66×10⁻² min−1 | K A | 1.95 mM |
| β A | 2.15×10⁴ min−1 | τ M | 0.10 min |
| K L | 9.7×10⁻⁴ M | γ L | 0.0 min−1 |
| γ P | 0.65 min−1 | α L | 2880 min−1 |
| α P | 10.0 min−1 | τ P | 0.83 min |
| β L1 | 2.65×10³ min−1 | K Le | 0.26 mM |
| K 1 | 2.52×10⁻² (μM)−2 |
The model as formulated in Eqs. (12)–(16) can have one, two, or three steady states depending on the values of the parameters (μ,Le). The details of how these steady states are determined are contained in [23] and [24]. The results of these considerations are presented in Fig. 4. There we show in space the region where a non-negative steady state can exist. Note in particular that for a range of Le values there may be coexisting two stable and one unstable steady state values of the intracellular allolactose levels, and, consequently, of .
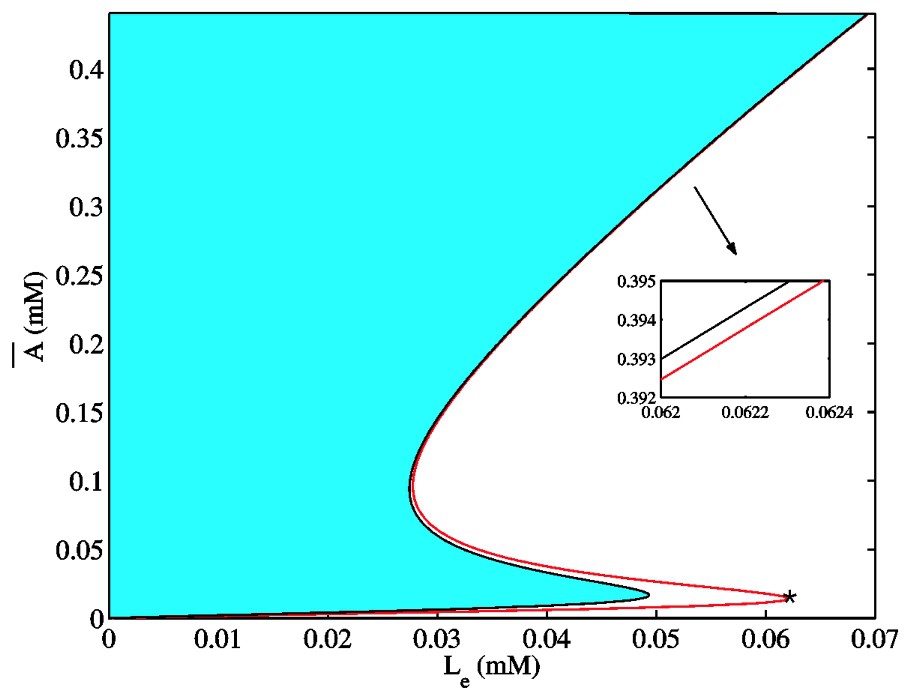
The region in the space where a non-negative steady state can exist as a function of external lactose levels Le for the model when all parameters are held at the estimated values in Table 2 and when min−1. The shaded area shows the region where a steady state is not defined, while the solid line is the locus of values satisfying the steady state. The inset box shows that at large values of Le there is still a separation of the line for the steady state from the region where steady states are not defined. Notice that for these values of the parameters there is a range of Le values for which there are three coexisting steady-state values of allolactose A. The point marked with a ∗ corresponds to the minimum lactose level for induction at this growth rate, and predicts that induction should occur for a lactose concentration of about 62.0 μM.
In other words, analytical and numerical studies of the model predict that for physiologically realistic values of external lactose and the bacterial growth rate, a regime exists where there may be a bistable steady state behavior, and that this corresponds to a cusp bifurcation in the model dynamics. This means that, as the external lactose concentration Le is increased, the bacterial culture must switch from a low-internal-allolactose-concentration uninduced steady state to a high-internal-allolactose-concentration induced steady state. For very low Le values, only the uninduced state exists. Conversely, for very high Le concentrations, only the induced state is available for the system. All these facts are in agreement with the experimentally-observed dynamic behavior of E. coli cultures. On the other hand, the model also predicts a range of Le values in which both the uninduced and the induced stable steady states coexist. If this bistability behavior is real, an hysteresis phenomenon must be observed in inducing and uninducing the lac operon of a given bacterial culture by changing the external lactose concentration. This prediction is qualitatively confirmed by the observations in [32] and [33].
Although a full analysis of the stability properties of the model is not possible due to its complexity, we have found that the basic properties contained in a reduced version of this model [23] (which considered only the dynamics of M, B, and A) are apparently retained in this much more complicated model as far as we are able to ascertain analytically and numerically.
Given the parameter values determined in Table 2, we numerically solved the model equations to compare the predicted behavior with three distinct experimental data sets. The first data set is from [34]. In there, the activity of β-galactosidase in an E. coli culture (strain ML 30) was measured after the bacteria were switched from a glucose-rich non-lactose to a non-glucose lactose-rich medium. The second data set is from [35]. In this paper, Pestka et al. studied specific inhibition of translation of single mRNA molecules and gave data for the specific activity of β-galactosidase versus time for E. coli 294 in the presence of IPTG. These two data sets and the model simulation determined using Matlab's dde23 [36] routine are shown in Fig. 5.
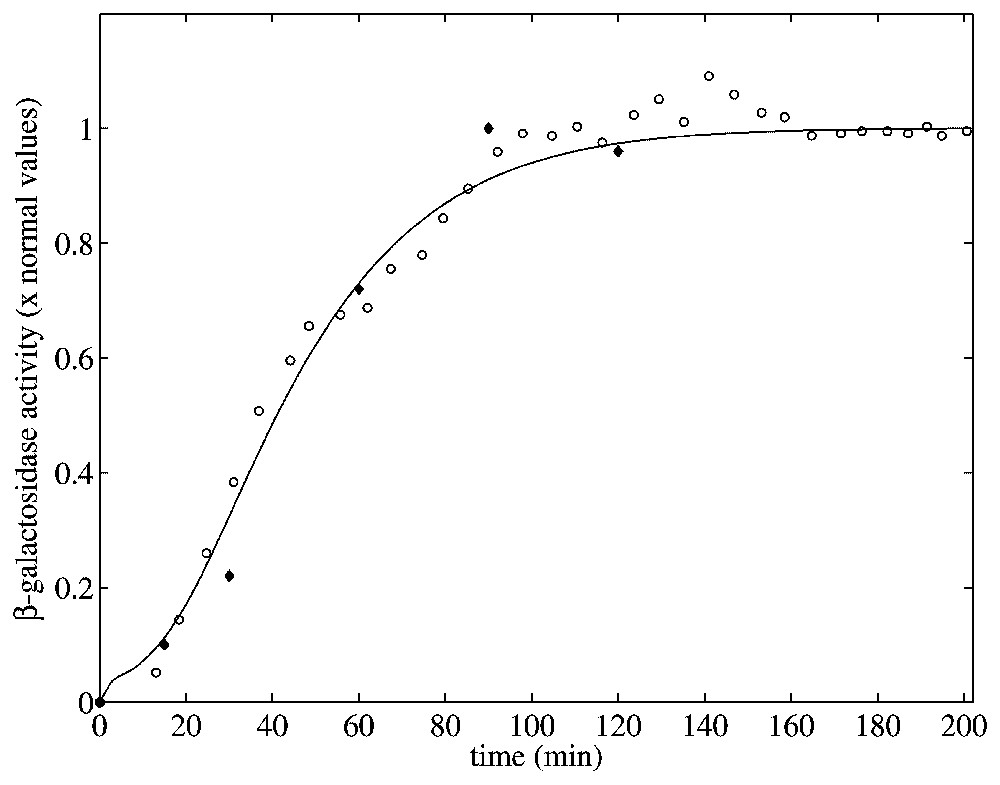
β-galactosidase activity vs. time when Le=8.0×10⁻² mM. The experimental datasets were taken from [34] for E. coli ML30 (∘) and from [35] for E. coli 294 (♦). The model simulation (solid line) was obtained using the parameters of Table 2 with a growth rate min−1. For details see, [24].
For this simulation, initial values for the variable were chosen close to the steady state values when Le=8.0×10⁻² mM. (With this value of Le there is a single uninduced steady state.) To compare these two sets of experimental data with the model simulation predictions, the data were scaled so the steady-state values of measured β-galactosidase activities and those produced by the simulation were equal. As seen in Fig. 5, there is relatively good agreement between both sets of experimental data and the model predicted temporal approach of β-galactosidase activity to its steady-state value.
In the experiments of Pestka et al. [35], the bacterial culture medium has no glucose all of the time. This means that catabolite repression is not a factor in the regulation of the lac operon and thus, the comparison with our simulations is straightforward. This is not the case with the experiments of Knorre [34] since, in such case, the bacterial were originally growing in a medium rich in glucose. Notice however that the time course of both experimental data is quite similar. This does not necessarily justifies the comparison of such experimental data with our model results, but highlights the necessity of including catabolite repression in further mathematical models of the lac operon in order to test its influence on the system dynamic behavior.
As a third test of the model, a data set from Goodwin [37] was used. In this paper, the dynamic behavior of β-galactosidase was studied in chemostat cultures of E. coli synchronized with respect to cell division by periodic phosphate feeding at a period equal to the bacterial doubling time. Experimentally, oscillations in β-galactosidase concentration were observed with a period equal to the feeding period. Since in these experiments, there is no glucose present in the environment, we can attempt to simulate them with our model.
To mimic the periodic phosphate feeding in our simulation, we assumed that the bacterial growth rate varies as a function of time in manner given by
| (17) |
The maximal value of μ(t) corresponds the times that phosphate was added. The minimal value of this function represents the minimal amount of nutrient left in the vessel. Assuming no nutrient is left ϵ minutes before the addition of phosphate and letting ϵ→0, α can be estimated if the doubling time (T) is known: . In Fig. 6, we compare the data on β-galactosidase activity from the forced culture as a function of time with the model predictions for a feeding period of T=100 min which is the population doubling time. Again, there is a reasonable good agreement between the model predicted curve and this dataset.
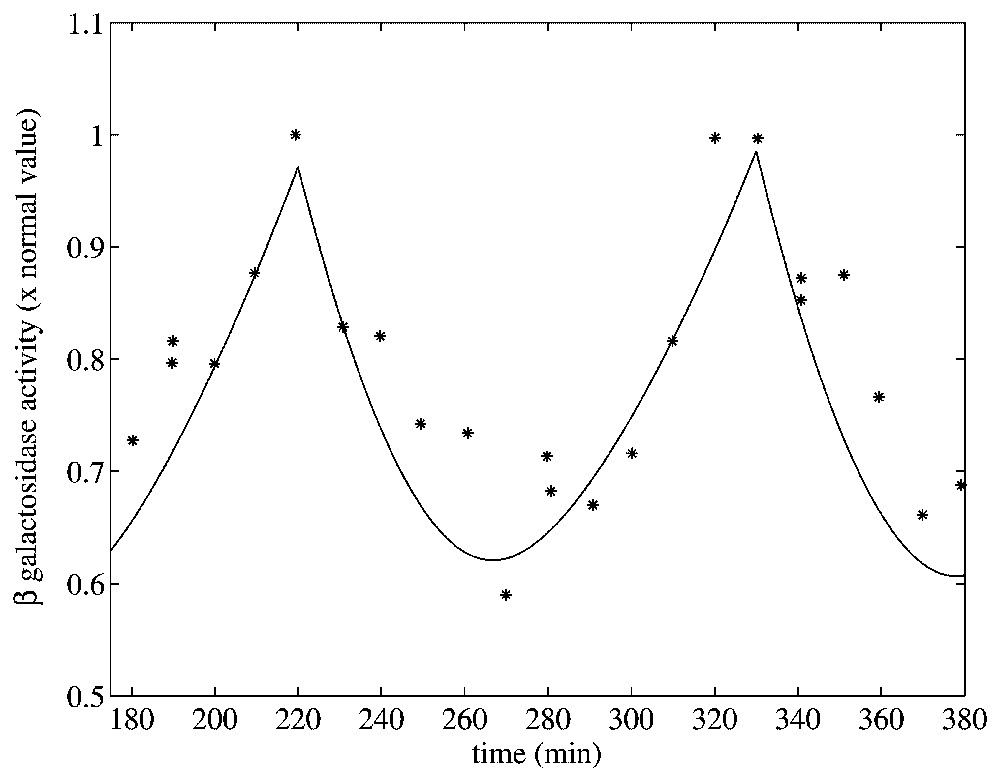
Oscillation in β-galactosidase activity in response to periodic phosphate feeding with period T=100 min, which is the culture doubling time, and min−1. The experimental data () together with the model simulation (solid line) using the parameters of Table 2 are presented. The experimental data are taken from [37]. In the numerical simulation, periodic phosphate feeding was imitated by choosing a periodic function given by Eq. (17). The simulation was calculated by numerically solving the system of delay differential equations given by Eqs. (12)–(16). For details, see [24].
4 Discussion and conclusions
Given the virtual flood of information that is emerging from the current initiatives in molecular biology, we feel that mathematical modeling of the dynamics of molecular control systems will assume an essential role in the coming years. The reasons for this are threefold:
- 1. Mathematical modeling offers a concise summary of many biological facts and insights in an easily manipulable language.
- 2. The consequences of analyzing these models can reveal potentially new dynamical behaviors that can be then searched for experimentally.
- 3. Failures of realistic mathematical models to explain experimentally observed behavior often point to the existence of unknown biological details and/or pathways, and thereby can act as a guide to experimentalists in their search for biological reality.
The paucity of dynamic data (as opposed to steady-state data) with which we were able to compare the predictions of our models for the tryptophan and lactose operons highlights a serious problem in the interaction between experimentalists and mathematical modelers. Namely, we feel that there must be a close and cooperative relationship between these two groups if maximal use is to be made of the experimental data that is being so laboriously collected and if the mathematical models constructed to explain these data.
The last area that we want to touch on is the nature of the mathematical models that are constructed. Those that we have discussed in this paper are all written with the explicit assumption that one is dealing with large numbers cells (and hence of large numbers of molecules) so that the law of large numbers is operative. However, the situation is quite different if one is interested in the dynamics of small numbers (or single) prokaryotic or eukaryotic cells, for then the numbers of molecules are small. Adequate means to analytically treat such problems do not exist in a satisfactory form as of now [38], and one is often reduced to mostly numerical studies [39–41]. The situation is analogous to examining the interactions between small numbers of interacting particles (where the laws of mechanics or electrodynamics hold), and then deriving from these formulations the behavior of large numbers of identical units as is done (not completely successfully even at this point) in statistical mechanics. We view this connection between the ‘micro’ and ‘macro’ levels as one of the major mathematical challenges facing those interested in the understanding of gene control networks.
Acknowledgements
We thank Dr Photini Pitsikas for her initial suggestion of these problems, Prof. Claire Cupples for her advice in parameter estimation section and her general comments, and Mr. Daisuke Horike for many helpful discussions. This work was supported by CGEPI–IPN and COFAA–IPN (México), TUBITAK (Turkey), MITACS (Canada), the Natural Sciences and Engineering Research Council (NSERC grant OGP-0036920, Canada), the ‘Alexander von Humboldt Stiftung’, the ‘Fonds pour la formation de chercheurs et l'aide à la recherche’ (FCAR grant 98ER1057, Québec), and the Leverhulme Trust (UK).