

Version française abrégée
La famille des Alestidae est un groupe de poissons d'eau douce présent exclusivement dans les rivières et lacs d'Afrique [1]. Avec près de 100 espèces [2,3], ce groupe de poissons pélagiques présente une grande diversité de taille (de 21 mm pour la plus petite espèce [4,5] à 130 cm pour la plus grande [1,6]) et de régime alimentaire [7]. Au sein des 13 genres actuellement reconnus, trois tribus ont été identifiées à partir de données morphologiques (Tableau 1). Les Alestidae ont été initialement inclus dans la famille des Characidae [2,8], constituant ainsi l'une des rares familles de poissons d'eau douce présente en Afrique et Amérique du Sud. Plus tard, plusieurs caractères propres ont été identifiés pour le groupe [1] et la première analyse cladistique de l'ordre a confirmé la présence de plusieurs caractères dérivés partagés [9]. Les Characidae étant polyphylétiques lorsque les Alestidae sont introduits, nous suivons donc la proposition de considérer les Alestidae comme une famille à part entière [9].
Classification of the Alestidae [2,6,40]
| Tribe Hydrocynini |
| Hydrocynus Cuvier, 1817 (5 species) |
| Tribe Alestini |
| Bryconaethiops Günther, 1873 (4 species) |
| Alestes Müller & Troschel, 1844 (7 species) |
| Brycinus Valenciennes, 1849 (31 species) |
| Tribe Petersiini |
| Micralestes Boulenger, 1899 (34 species) |
| Rhabdalestes Hoedeman, 1959 (15 species) |
| Arnoldichthys Myers, 1926 (1 species) |
| Ladigesia Géry, 1968 (1 species) |
| Lepidarchus Roberts, 1968 (1 species) |
| Tricuspidalestes Poll, 1967 (1 species) |
| Duboisialestes Poll, 1967 (1 species) |
| Petersius Hilgendorf, 1894 (1 species) |
| Clupeocharax Pellegrin, 1926 (1 species) |
Les relations phylogénétiques au sein de la famille ont été récemment explorées à l'aide de caractères morphologiques [10,11], mais les travaux réalisés se sont essentiellement cantonnés aux relations entre les genres Alestes, Brycinus, Bryconaethiops et Hydrocynus, laissant ainsi non résolues les relations entre les espèces de petite taille de la tribu des Petersiini. De plus, aucune étude de la concordance entre les données moléculaires et les données morphologiques n'a été entreprise jusqu'alors. Nous avons donc séquencé les gènes mitochondriaux ribosomaux 12S et 16S pour 12 espèces d'Alestidae, représentant les trois tribus précédemment indiquées. À ces 12 espèces ont été ajoutées les séquences de trois espèces précédemment séquencées [21] et les données mitochondriales ont été comparées puis combinées aux caractères morphologiques décrits dans la littérature, auxquelles a été ajouté un caractère morphologique nouveau, décrit dans cette étude (Appendices B et C).
Des alignements multiples ont été réalisés grâce au programme CLUSTAL W [28]. Suivant Gatesy et al. [29], trois schémas de pondérations d'ouverture et d'allongement des insertions–délétions ont été appliqués afin d'identifier les sites ambigus à l'alignement, qui ont ensuite été retirés lors des analyses phylogénétiques. Deux méthodes de construction d'arbres ont été utilisées : parcimonie non pondérée (MP) et maximum de vraisemblance (ML), cette dernière utilisant un modèle d'évolution de type
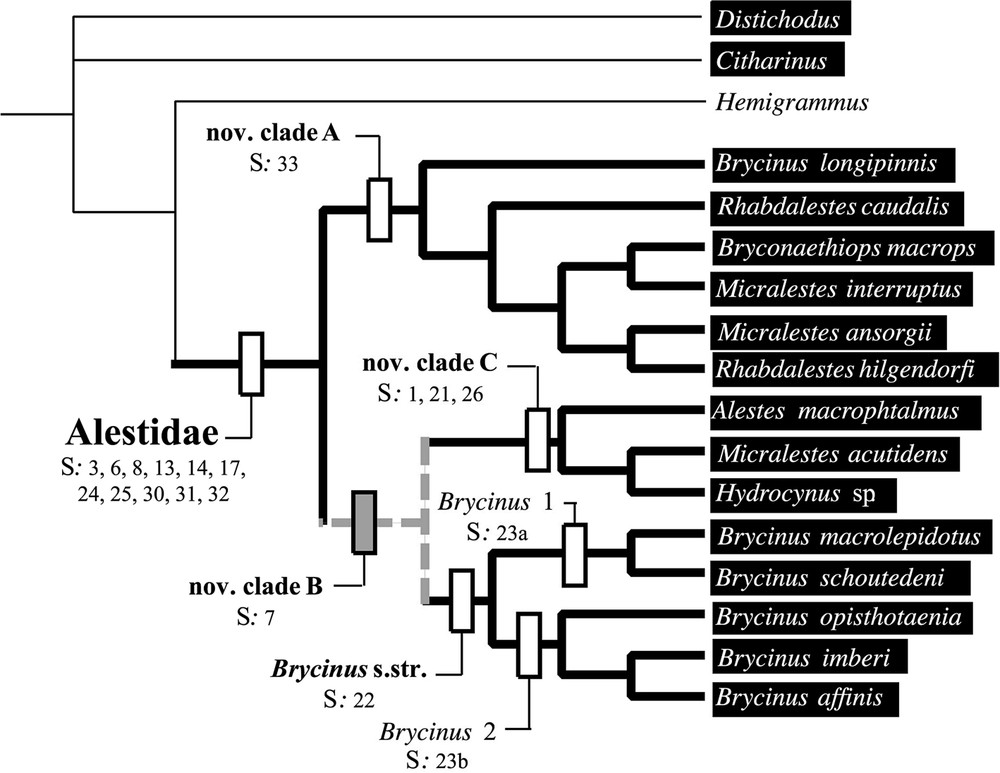
L'analyse préliminaire du support statistique du jeu de données moléculaires indique un manque de soutien pour les divergences basales (Fig. 1). L'exclusion des sites ambigus de l'alignement ne permet pas d'obtenir des relations de parenté plus soutenues (Fig. 2). Néanmoins, les deux méthodes de construction d'arbre employées donnent des résultats très similaires. Le groupe Brycinus 1 est en position basale. Le groupe Brycinus 2 est le groupe frère du nov. clade C et le nov. clade A est le groupe frère de l'ensemble. L'analyse de saturation révèle un taux d'homoplasie du jeu de données moléculaires beaucoup plus faible à l'intérieur des Alestidae qu'au sein de l'ordre (Fig. 2), indiquant ainsi que l'homoplasie seule n'est pas responsable du manque de soutien des nœuds basaux. L'estimation des longueurs de branches par maximum de vraisemblance révèle un fort contraste entre les distances estimées entre clade et celles estimées à l'intérieur des clades (Fig. 3). Les distances entre clades sont nettement plus faibles, indiquant plusieurs rythmes de divergences au sein de la famille. Les résultats indiquent que l'absence de support statistique ne peut être totalement imputé à la saturation et qu'une diversification rapide des grandes lignées d'Alestidae peut être en partie responsable de ce phénomène. Les relations obtenues sont en contradiction avec la classification actuellement en vigueur, puisque les genres Brycinus, Micralestes et Rhabdalestes, ainsi que la tribu des Petersiini sont polyphylétiques. Contraindre la monophylie de ces différents genres ainsi que la tribu Alestini produit des arbres nettement moins parcimonieux et moins vraisemblable (Tableau 2). Le consensus majoritaire obtenu à partir de l'analyse séparée du jeu de données morphologiques diffère principalement des topologies obtenues par ailleurs sur les données moléculaires par la position du clade Brycinus 1, ici groupe frère du clade Brycinus 2, ainsi que par la paraphylie du nov. clade A (Fig. 4).
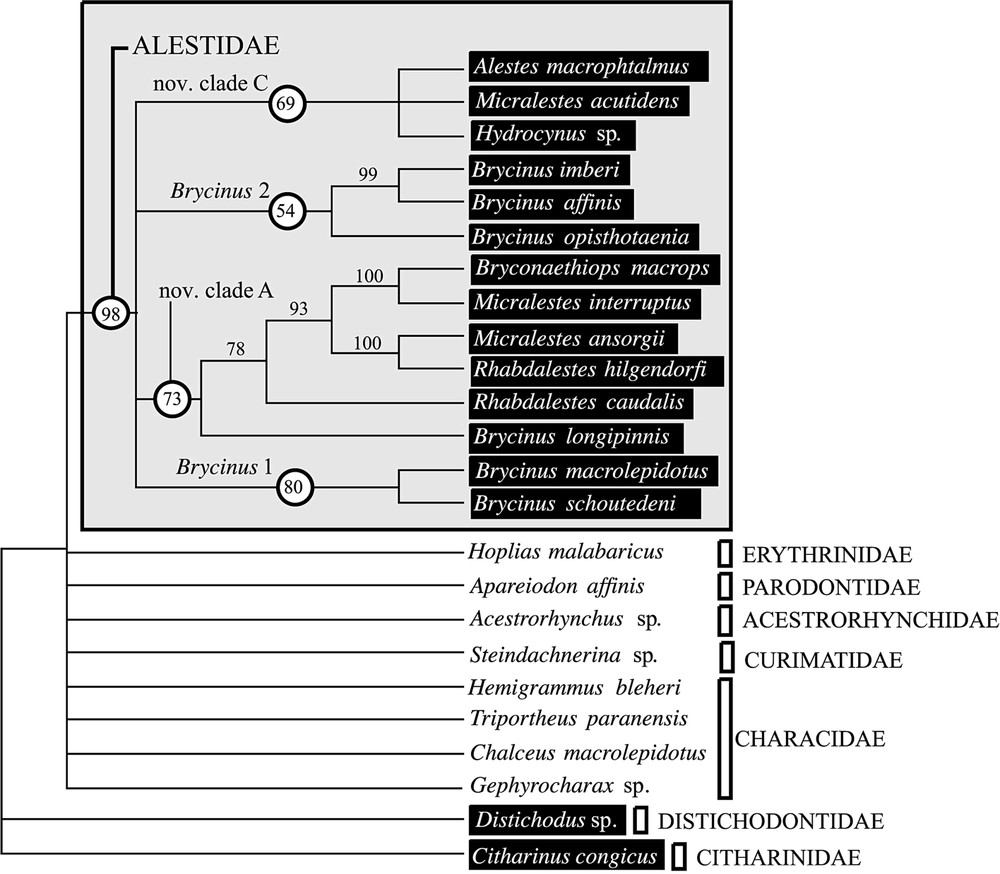
Bootstrap consensus based upon the combined 12S and 16S rDNA data set using all sites (804 BP). Consensus obtained with 1000 pseudoreplications and heuristic search with random addition of taxa. The length of the four corresponding trees is 885 steps; CI=0.458; RI=0.500. African taxa are indicated by black boxes.
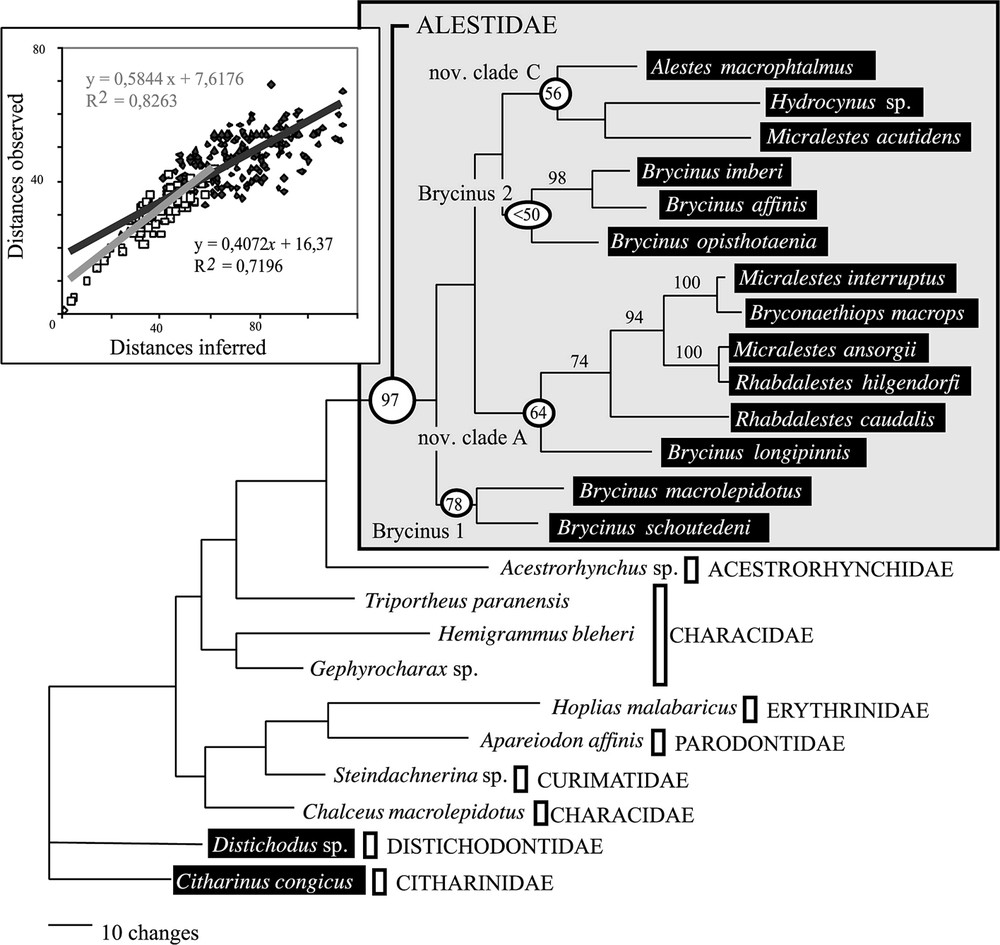
Best MP tree obtained by heuristic search with gaps coded as missing data and alignment ambiguous sites excluded (787 BP). The length of the tree is 783 steps; CI=0.458; RI=0.543. Numbers above branches are bootstrap values (only BP > 50% are shown). Window: Mutational saturation analyses. Linear regression and equations are provided for divergence within Alestidae (white) and beyond the family (grey).
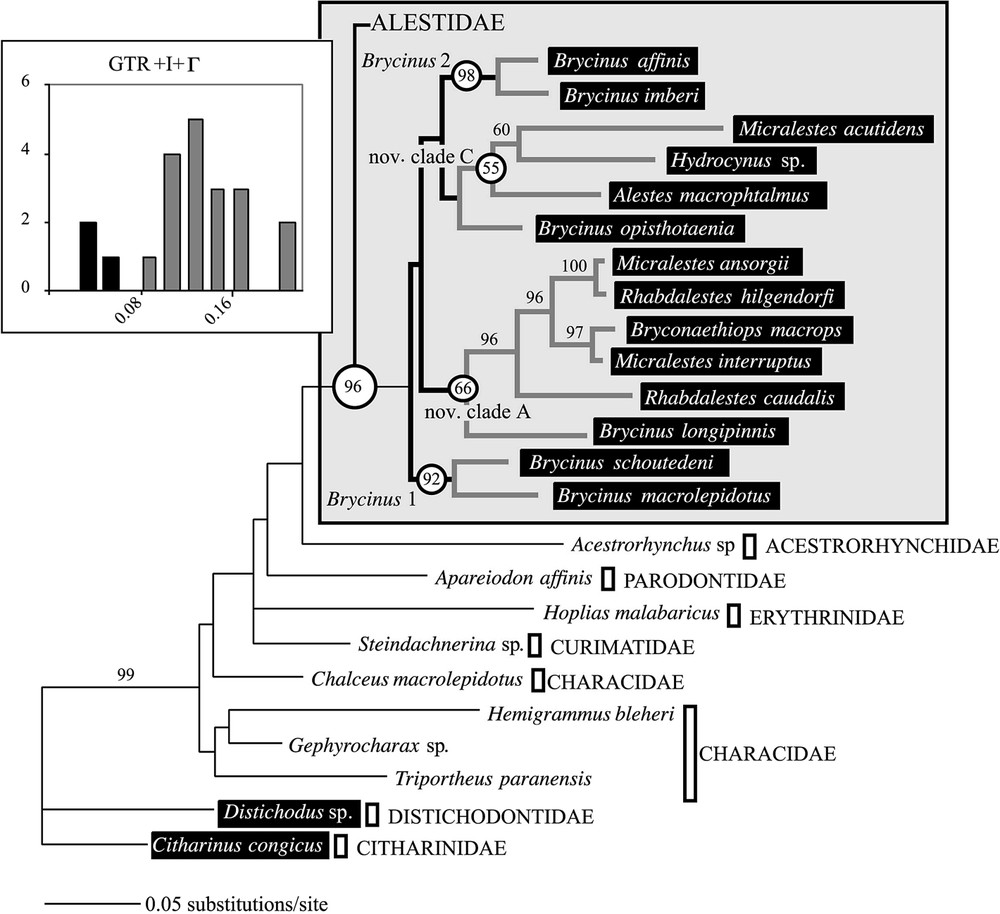
ML tree obtained with the GTR+I+Γ model (ln likelihood=−5154.737). Window: Distribution of genetic distances within Alestidae (frequencies are plotted against distance intervals estimated using the GTR+I+Γ model).
Tree lengths for MP trees and log likelihood for ML trees, obtained by constrained analyses, using the 14 taxa of Alestidae and rooting with Acestrorhynchus sp. Alignment ambiguous sites are excluded. Extra steps are counted with respect to the shortest tree in this table.
| Topology | Parsimony | Maximum likelihood | T. P. T. | |||
| Tree lengths | Extra steps | Log likelihood |
|
Trees | p-value | |
| 1. No constraintsa | 466 | −3284.74 | ||||
| 2. Brycinus monophyleticb | 478 | +12 | −3299.68 | −14.94 | 1. vs 2. | 0.0338+ |
| 3. Micralestes monophyleticb | 514 | +48 | −3395.24 | −95.56 | 1. vs 3. | 0.0001+ |
| 4. Rhabdalestes monophyleticb | 484 | +18 | −3310.51 | −25.77 | 1. vs 4. | 0.0051+ |
| 5. Alestini monophyleticb | 522 | +56 | −3359.82 | −68.15 | 1. vs 5. | 0.0001+ |
a Best tree obtained using MP or ML.
b Best tree obtained using MP or ML under given constraints.
+
Tree significantly longer with
Majority rule consensus derived from the 377 equiparsimonious MP trees inferred with the morphological data (L=35; CI=0.846; RI=0.906). The frequency of the nodes is given in the tree. The clades on the right refer to the results from the molecular data.
Le test de concordance des différences de longueur d'arbres pour les jeux de données moléculaire et morphologique ne rejette pas l'hypothèse d'homogénéité des jeux de données (p-
Du point de vue évolutif, une diversification rapide des différentes lignées d'Alestidae semblent être responsable du manque de soutien statistique observé pour les divergences précoces et pourrait ainsi expliquer le manque de caractères morphologiques informatifs entre les différents genres [11] ainsi que le manque de données sur les relations à large échelle au sein de la famille. Ce présent travail souligne aussi l'apparition multiple de la miniaturisation puisque, parmi les espèces échantillonnées, deux lignées présentent de manière convergente une réduction de taille (nov. clade A et Micralestes acutidens).
1 Introduction
The family Alestidae [1], often called African Characids [2], belongs to the order Characiformes. This widespread fish family inhabits the tropical rivers and lakes of Africa. With about 100 recognized species [2,3], this group of pelagic fishes exhibits a remarkable range of size. The smallest species, Lepidarchus Adonis, does not exceed 21 mm [4,5], and the largest, Hydrocynus goliath, reaches 130 cm and weighs more than 50 kg [1,6]. These fishes may be considered as more or less specialised entomophagous or ichtyophagous predators [7]. The 13 genera of the family (Table 1) are actually divided into three tribes: the piscivorous Hydrocinini; the invertivorous to detritivorous Alestini and the invertivorous miniaturized Petersiini.
The Alestidae were initially included in the family Characidae [2,8], forming one of the few families present in both Africa and South America. On the basis of exclusive characters, not formerly addressed as synapomorphies, Géry [1] and Buckup [9] elevated the group to the family level. According to the cladistic analyses among the order [9], the characidae are polyphyletic when the Alestidae are included. Following these results, we consider the group to be a separate family.
The phylogenetic relationships among the Alestidae were recently addressed using morphological data focussing mostly on the relationships between the genera Brycinus, Bryconaethiops, Alestes, and Hydrocynus [10,11]. These studies were the first attempts to analyse morphological characters in a cladistic framework within this family and the major results were to confirm the monophyly of the Alestidae, as previously suggested [9,12] and brought forward 11 synapomorphies supporting it. Nevertheless, unresolved pattern of relationships among genera have been proposed and the poor phylogenetic resolution observed was due to the lack of characters supporting basal relationships rather than character incongruence [11]. Furthermore, the small sampling of the tribe Petersiini in the precedent analyses did not allow the assessment of the phylogenetic affinities of the miniaturised species and early divergences in the family.
In order to resolve basal relationships among the Alestidae, mitochondrial sequences were added to the morphological characters previously described [11] as well as a new character that we describe here. Because Mitochondrial ribosomal DNA sequences of the 16S and 12S genes appeared to be useful for resolving phylogenetic relationships among various groups of teleostean fishes [13–20], we used partial sequences of 12S and 16S genes for 12 species of Alestidae representing the three tribes of the family [2]. As suggested by a previous molecular study among Characiform fishes, the limit of resolution is rapidly reached beyond the familial level of divergence for the 12S and 16S genes [21]. Therefore, the analyses presented here especially focus on the phylogenetic content of the mitochondrial 12S and 16S genes among the Alestidae by the mean of a saturation analyses [22] and we assessed congruence between morphological and mitochondrial dataset first by an empirical comparison of topologies inferred by separate analyses, then by using the Incongruence Length Difference test [23] and a successive weighted parsimony approach [24].
2 Materials and methods
2.1 Fish specimens and DNA extraction, amplification and sequencing
In order to assess the relationships within the family, 12 species of the family and one species of Characidae were sequenced for 12S and 16S fragments (Alestes macrophthalmus, MNHN: 2002-737; Brycinus affinis, MNHN: 2002-803; Brycinus opisthotaenia, MNHN: 2002-739; Brycinus macrolepidotus, MNHN: 2002-740; Brycinus schoutedeni, MNHN: 2002-802; Brycinus longipinnis, MNHN: 2002-738; Bryconaethiops macrops, MNHN: 2002-743; Micralestes interruptus, MNHN: 2002-748; Micralestes ansorgii, MNHN: 2002-745; Micralestes acutidens, MNHN: 2002-747; Rhabdalestes caudalis, MNHN: 2002-746; Rhabdalestes hilgendorfi, MNHN: 2002-744; Hemigrammus bleheri, corresponding to the GenBank accession number AY130830 to AY130842 and AY130843 to AY130855 for the 16S and 12S genes, respectively). We added these samples to 11 previously published homologous mtDNA sequences of Characiform fishes [21] (Genbank accession nos: Brycinus imberi: U33829, U34030; Hydrocynus sp.: U33960, U33997; Hoplias malabaricus: U33976, U34013; Apareiodon affinis: U33982, U34019; Acestrorhynchus sp.: U33962, U33999; Steindachnerina sp.: U33986, U34023; Triportheus paranensis: U33588, U33623; Chalceus macrolepidotus U33587, U33622; Gephyrocharax sp.: U33970, U34007; Distichodus sp.: U33827, U33994; Citharinus congicus: U33826, U33993).
Tissues samples were preserved in 70% ethanol and stored at
2.2 DNA sequences alignment and phylogenetic analyses
Multiple DNA sequence alignments were performed using CLUSTAL W [28], with the default settings. Following Gatesy et al. [29], additional alignments were performed using different gap opening and gap extension parameters to detect alignment ambiguous sites, defined as positions with gap assignments differing among alternative cost function. We applied the following schemes of alignment parameters: opening gap
Two methods of phylogenetic reconstruction were used to infer phylogenetic relationships among the Alestidae: Maximum Parsimony (MP) [30] and Maximum Likelihood (ML) [31] as implemented in PAUP* [32]. Heuristic searches in MP were performed by random addition of taxa and TBR branch swapping. MP searches were replicated 100 times and consistency indices (consistency index [CI] [33] and retention index [RI] [34]) were scored as a measure of homoplasy. The ML analyses were computed with the
Mutational saturation was assessed following the method previously outlined [22,38]. Pairwise numbers of observed nucleotide differences (‘adjusted distance’ in PAUP*) were plotted against changes (‘patristic distance’ in PAUP*) inferred in maximum parsimony for each pair of taxa. The level of homoplasy was inferred by means of a linear regression, since the slope of the equation reflects the saturation of the data (a 1:1 slope means that one observed difference corresponds to one reconstructed change, while a 1:2 slope implies that one observed difference correspond to two reconstructed changes). A Templeton Parsimony Test was performed to assess the statistical significance of differences observed between the relationships previously identified and the relationships hypothesized therein [39]. After having analysed both molecular and morphological datasets separately, the matrix of 33 morphological characters was added to the mitochondrial data. Congruence between morphological and molecular data was assessed by the mean of the Incongruence Length Difference test [23] and combined analyses were then performed using both non-weighted and successive weighting MP analyses [24].
3 Results
3.1 Sequence description
On average we obtained fragments of 310 BP for the 12S sequences and 510 BP for the 16S sequences for 12 species of Alestidae and 1 species of Characidae. Together with previously published mitochondrial sequences [21], we obtained a final alignment of 804 BP for 24 Characiform species. According to the alignment procedure previously described, four loop portions, corresponding to 16 BP, were deleted for the 16S fragment. Among the 787 remaining non-ambiguous sites, 287 nucleotides were variable and 195 were parsimony informative (75 for the 12S, 120 for the 16S). Indels (insertion/deletion) represented between 1% and 2.7% of the aligned sequences and ranged from 1 BP to 7 BP. Sequence divergence as inferred by maximum likelihood (
3.2 Phylogenetic analyses
Parsimony analyses of the 12S and 16S data set including alignment-ambiguous sites (804 BP alignment), provided a pool of four most-parsimonious trees (length
The most conservative strategy for obtaining reliable phylogenetic information would be to discard alignment ambiguous sites, mostly localised in the fast evolving regions of the loops, and containing the highest amount of homoplasy. When alignment ambiguous sites are discarded, the analyses of the 787 remaining sites (180 parsimony-informative characters) led to a single tree (Fig. 2,
ML analyses were performed with the global dataset including the alignment ambiguous sites (804 BP data set) using the
The topological test using parsimony [38] was performed using constrained trees to test whether the tree length of the constrained topologies obtained were significantly different from the best tree. Tests were performed on a data set including the 14 species of Alestidae with Acestrorhynchus as the out-group. The TPT performed with PAUP* detected significant differences between all the trees obtained in MP with constraints and the shortest tree (Table 1). The monophyly of the genera Brycinus, Rhabdalestes, Micralestes and the monophyly of the group Alestini + Hydrocynini were rejected with a p-
MP analyses of the 33 morphological characters matrix (Appendices B and C) [11] including 18 species, provided a pool of 377 most-parsimonious trees (length
We performed combined analyses of the 33 morphological characters and the 787 alignment unambiguous sites for the 18 species of the morphological data set. The ILD test was performed with the informative characters, only. The ILD test did not reject the null hypothesis of homogeneity (p-
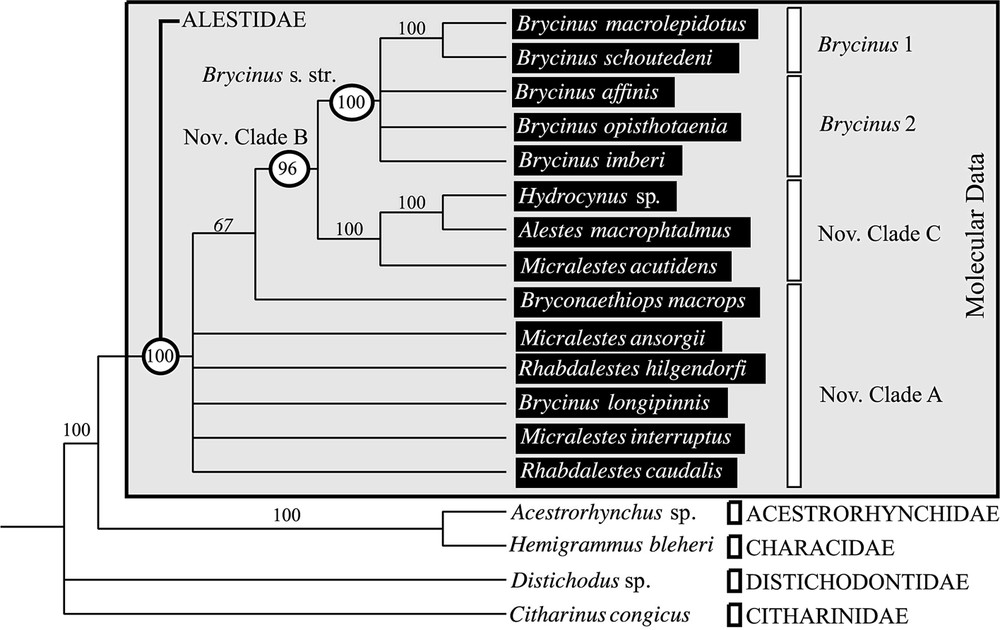
Analyses performed on the mitochondrial data showed that the overall amount of valuable information was quite low for basal nodes of the phylogeny and saturation analyses indicated that homoplasy was not the only cause for the lack of statistical support in this part of the tree. Nevertheless, low values of both CI and RI revealed that homoplasy was also acting and one could expect saturation to be stronger for the earliest divergences. Despite the lower amount of homoplasy among morphological data as revealed by CI and RI values, the phylogenetic content of the morphological data set was quantitatively lower than the one of the molecular data. As a consequence, characters conflict could be expected due to a differential accumulation of homoplasy. We applied a successive weighting approach for MP searches in order to determine which of topology 1 and topology 2 was the most consistent compared with homoplasy. Weighting characters with the CI and RI gave us similar results and topology 1 was recovered in each case. Although topology 2 corresponded to the less consistent tree, topology 1 maximised the congruence between morphological and molecular data. This topology is given in Fig. 5 (dashed lines identify the point of incongruence between topology 1 and 2) and morphological synapomorphies are mapped on the cladogram. The clade Brycinus s. str., supported by one synapomorphy (S22, [11]), was divided in two lineages which correspond to the clade Brycinus 1 and Brycinus 2 previously identified [11,39]. Each one was supported by one synapomorphy (S23a, S23b, [10,11]). The new clade C was supported by three synapomorphies (S1, S21, S26, [11]) and these derived features, primarily described for the clade (Alestes + Hydrocynus), were confirmed for Micralestes acutidens by the examination of a diaphanized specimen. The dilatator fossae reach the dorsal part of the frontal (S21), there are 15 transitional ribs (S26) but Micralestes acutidens lacks the adipose eyelid (S1). The new clade B was supported by one synapomorphy (S7, [11]) and the presence of this derive feature in Bryconaethiops suggests an independent acquisition of this derived state in the genus. The new clade A was placed as the sister group of the other Alestidae. The only character that was actually supporting the monophyly of the new clade A (S33) was the presence of a strong sexual dimorphism characterized by the prolongation of the dorsal fin ray in the males of this group (Appendices A–C).
Best Tree derived from the combined data set with 33 morphological and 787 mitochondrial characters (Topology 2: L=827, CI=0.4728, RI=0.5235). Morphological synapomorphies are mapped on the tree.
4 Discussion
4.1 Monophyly of the African Characids
The present study, based on a representative sample of the major lineages of Alestidae, strongly supports the monophyly of the family and this result is in agreement with previous osteological observations [9,11,40,41]. The monophyly of the group is actually supported by 11 morphological synapomorphies (Fig. 5). Weak statistical support observed for the basal nodes indicates that poor phylogenetic signal was available for deep divergence among the family. For example, only two morphological characters were enough to nest the clade Brycinus 1 with the clade Brycinus 2. The saturation analyses performed show that homoplasy cannot fully explain the lack of statistical support for basal divergence and the pattern of mitochondrial mutations is in agreement with a fast diversification of the family (Fig. 3, window). These observations based on molecular data could explain the paucity of morphological characters supporting the monophyly of the major lineages of Alestidae.
4.2 Polyphyly and original clades
The phylogenetic pattern hypothesized here (Fig. 5) is in agreement with morphological data for most points but also reveals some discrepancies and relevant systematic findings:
- (1) This molecular study rejects the monophyly of the Alestini [1,2,6,39] including Alestes, Brycinus, Bryconaethiops (Fig. 5, Tables 1 and 2, Appendix A). The genus Brycinus is polyphyletic and the Brycinus longipinnis complex should be removed from the genus as previously outlined [11] and the genus should be restricted to the clade Brycinus sensu stricto [1,39]. The presence of molariform teeth and a second row in the premaxillae seems to reflect the plesiomorphic conditions within the family that could have been retained only in the species actually belonging to Brycinus. The present study suggests that the clade Alestes + Hydrocynus could be paraphyletic but the ambiguous relationships obtained between the clade Alestes + Hydrocynus [10,11] and Micralestes acutidens do not allow to conclude since it remains unclear which of Alestes or Micralestes acutidens is the most closely related to Hydrocynus. Notwithstanding, the present work argues that the genus Bryconaethiops should be removed from the tribe Alestini as it belongs to the tribe Petersiini.
- (2) The Petersiini [5] are polyphyletic (Fig. 5, Tables 1 and 2, Appendix A) and two major lineages were previously included in the group. The genus Micralestes [6] is polyphyletic with Micralestes acutidens grouping with the genus Alestes and Hydrocynus while Micralestes interruptus groups with Brycinus longipinnis and Bryconaethiops. These results show that miniaturization occurred at least two times in the history of the family. The genus Rhabdalestes is polyphyletic since Rhabdalestes caudalis and Rhabdalestes hilgendorfi do not constitute a monophyletic unit.
5 Conclusions
Although the present work allows us to draw some taxonomic recommendations, the evolutionary history of the family remains partially unexplored. Among the 13 extant genera actually described among the Alestidae, seven monotypic genera are not included in the present work and some of them constitutes strongly derived miniaturized taxa. Nevertheless, we can make some predictions based on our results. The clade Brycinus s. str. is the only group in which we failed to identify miniaturization. However, Arnoldichthys is actually sharing some derived features from this clade such as the absence of a cranial fontanelle at least in adult (Characters 23) and the presence of large scales typical of the clade Brycinus 1 but not formerly addressed here. In the same way, Duboisialestes seem to be closely related to species from the new clade A as it harbours the derived state of character 33 and the large triangular humeral spot that seems to be frequent in this clade (Appendix A).
Nevertheless, strongly derived taxa like Tricuspidalestes or Clupeocharax remain undiagnosed and still challenge our knowledge about the evolutionary history of the family. Our results show that both morphological and molecular characters are informative and can provide complementary information and should therefore be included in future works on the phylogeny of the Alestidae.
Appendix A
See Fig. 6.
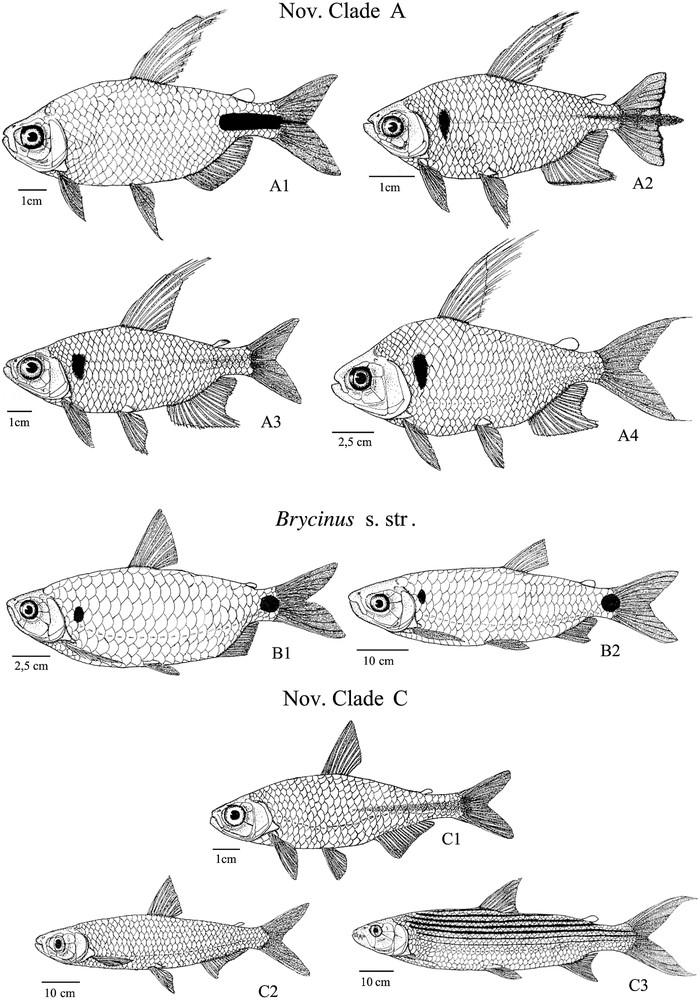
New Clade A: A1, Brycinus longipinnis; A2, Rhabdalestes caudalis; A3, Micralestes ansorgii; A4, Bryconaethiops macrops; New Clade B: B1, Brycinus imberi; B2, Brycinus macrolepidotus; New Clade C: C1, Micralestes acutidens; C2, Alestes macrophthalmus; C3, Hydrocynus vittatus.
Appendix B List and description of morphological character states [10,11]
Character 1, adipose eyelid: state
Character 2, number of gill rakers: state
Character 3, posterior end of the premaxillae: state
Character 4, posterior end of the premaxillae and tooth row diverging: state
Character 5, dorsal process of premaxillae: state
Character 6, premaxillary pedicle: state
Character 7, hinge joint of premaxillae: state
Character 8, ventral flange on maxilla: state
Character 9, maxillary teeth: state
Character 10, rhinosphenoid bone: state
Character 11, ectopterygoid teeth: state
Character 12, angle formed by quadrate limbs: state
Character 13, parasphenoid: state
Character 14, shape of vomer: state
Character 15, mesethmoid lateral flange: state
Character 16, shape of mesethmoid: state 0 = normal; state
Character 17, orbitosphenoid tube for olfactory nerve: state
Character 18, lateral ethmoid tube: state 0 = present; state
Character 19, connection between orbitosphenoid and lateral ethmoid: state
Character 20, ventral process of sphenotic: state
Character 21, frontal ridge over dilatator fossa: state
Character 22, frontal bone: state
Character 23 (modified from Murray and Stewart, 2002), cranial fontanelle: state
Character 24, third temporal fossa contained in epioccipital: state
Character 25, preopercle lower limb pores: state 0 = in raised tube; state
Character 26, number of transitional ribs: state
Character 27, anal pterygiophores: state
Character 28, swim bladder: state
Character 29, shape of first anal pterygiophore: state
Character 30, bony stays in caudal fin: state
Character 31, number of epurals: state
Character 32, sexual dimorphism of caudal fin: state
Character 33, sexual dimorphism of dorsal fin: state
Appendix C
See Table 3.
Matrix of morphological characters (* polymorphic state=(01), ? ambiguous or unknown state)
| Distichodus | 00000000*000000000000000000000000 |
| Citharinus | 000000000000000000000000000000000 |
| Acestrorhynchus | ?00010001111001001100000000000000 |
| Hemigrammus | 000100001??1101001?00000000000000 |
| Hydrocynus sp. | 102010110000110011111001110001110 |
| Alestes macrophtalmus | 111001110000110010011001111111110 |
| Micralestes ansorgii | 0010010100001?0011100001100001111 |
| Rhabdalestes hilgendorfi | 001001010??01100?1??000?100001111 |
| Brycinus longipinnis | 001001010??01100?11?000?100001111 |
| Bryconaethiops macrops | 0010011100?0110011?00001100001111 |
| Brycinus affinis | 001001110000110011100101100001110 |
| Brycinus opisthotaenia | 0010011100001100111?0101100001110 |
| Brycinus macrolepidotus | 001001110000110111100111100001110 |
| Brycinus schoutedeni | 001001110??0110111?00111100001110 |
| Brycinus imberi | 001001110?0011001110?101100001110 |
| Micralestes acutidens | 0?1??1?1????11??1???10?111???1110 |
| Micralestes interruptus | ????????????????????????????????1 |
| Rhabdalestes caudalis | ????????????????????????????????1 |