

1 Introduction
Protein alignment is the basic step in the analysis of both functional and evolutionary aspects of proteins. Protein similarities may reveal degree of functional similarity and evolutionary relatedness among different organisms.
By comparing differences between sequences of amino acids, one can infer the properties of the substitution process, which is an element of molecular evolution. This substitution process is mathematically formulated as a continuous-time Markov chain with states corresponding to different amino acids [1,2]. The Markov chain is defined by specifying its transition probability matrix. Entries of the amino acid substitution matrix are derived from transition probabilities. Substitution matrices are usually used in the form of log-odds ratios, which provide score terms in protein alignment algorithms. The process of estimating a substitution matrix mostly consists of counting amino acid substitutions in confirmed multiple sequence alignments [1,2]. The oldest method for estimating substitution matrices (Dayhoff's PAM [3]) uses maximum parsimony trees of amino acid sequences to estimate times and structure of substitution events. This approach works properly for closely-related proteins only. Later improvements, i.e., JTT [4], based on much larger database or VT matrices [5,6] based on reworked theoretical model, allow using data involving proteins separated by a wider range of evolutionary distances. The drawback of these approaches is their computational load.
In this paper, the analysis is based on the BLOSUM family of matrices [7] derived from amino acid substitution rates observed in highly-conserved protein regions, called blocks. The BLOSUM approach is simpler than methods in [3–6] and ignores some evolutionary information. However, it has important advantages. Widely-used BLOSUM matrices are known for their excellent performance and are easier to compute than matrices derived according to the Dayhoff approach. Therefore, they allow incorporating more sequence data as a prior for estimation of substitution rates, compared to PAM and its later improvements.
In the present analysis, BLOCKS database [8] of highly-conserved protein regions was first created and then counts of amino acid pairs were calculated.
The main goal of the current work is to develop a tool for comparing substitution matrices created for data taken from different groups of organisms, and thus to compare substitution patterns characteristic of these groups. As an example, we consider bacteria with AT-rich and GC-rich genomes. It is widely accepted that environmental conditions affect genome composition and thereby amino acid content in protein sequences. For extensive study of this mechanism, we refer to [9]. As a consequence, there exists a need for substitution matrices suited for a particular compositional context. Yu et al. [10] provide a rationale for modifying standard substitution matrices like PAM or BLOSUM to be used with proteins encoded by AT-rich and GC-rich genomes. In this paper, we consider construction of substitution matrices appropriate for subgroups of organisms and then comparison of substitution patterns characteristic of these groups. As a source of protein sequence data, the COG (Clusters of Orthologous Groups) database [11,12] was used.
The problem of the comparison between different substitution matrices was considered in the literature and was approached using correlation, Jensen–Shannon divergence [13], relative entropy comparison and principal component analysis [14]. Here we propose a method of comparison based on testing consistency of distributions of amino acid pair counts, using the G-statistic [15]. Whereas other methods are suited to compare matrices in general, our approach tackles the problem of comparison in a more detailed way. Complexity of the comparison task requires hierarchical manner of analysis. Different levels of hierarchy are focused on different aspects of amino acid substitution. We propose five levels (steps) of comparison of substitution patterns, including: overall substitution pattern, amino acid conservation pattern, substitution patterns for single amino acids, intensity of substitution, and comparison of single substitutions. Multilevel analysis allows answering more directly the question, which aspect of amino acid substitution distinguishes the considered groups of organisms. This is not feasible using other methods.
2 Results and discussion
As explained in the ‘Introduction’ section, we analyse counts of amino acid pairs evaluated using two BLOCKS databases corresponding to AT-rich and GC-rich bacterial genomes. Data was organized into multiple contingency tables with different categories, depending on the particular step of the analysis. In each step, the G-tests were carried out under different null hypotheses, assuming identity of distributions of respective features in both groups of bacteria under consideration. Details of the procedure are explained in the ‘Methods’ section, at the end of the paper.
Results of all tests are presented as series of graphs (exact numerical results available upon request) showing the value of G-statistic versus clustering percentage [7,8] ranging from 30% to 100%, and for the case when no clustering is applied (none). Clustering percentage level L% means that sequences in BLOCKS database are clustered together if their similarity is equal to or exceeds L%. Clustered sequences contribute to a substitution matrix with weight depending on the size of the cluster. Lower clustering percentage levels correspond to longer evolutionary distances, higher to shorter. The clustering percentage level is the parameter of the BLOSUM family of matrices, i.e., in the BLOSUM62 matrix, the 62% clustering percentage level was applied. When no clustering is applied (BLOSUMn), every amino acid pair contributes to a substitution matrix.
Graphs are depicted in the same order as descriptions of respective tests in the ‘Methods’ section. In cases for which , only the G-statistic value was given. Clustering of protein blocks within BLOCKS database (clustering percentage) can be considered a measure of resolution of the data used to derive a substitution matrix. Smaller clustering percentage means lower resolution. In case of no clustering at all, every sequence from BLOCKS database contributes to a substitution matrix. Such situation corresponds to a maximum resolution of the source data.
2.1 Step1. Comparison of the overall substitution pattern
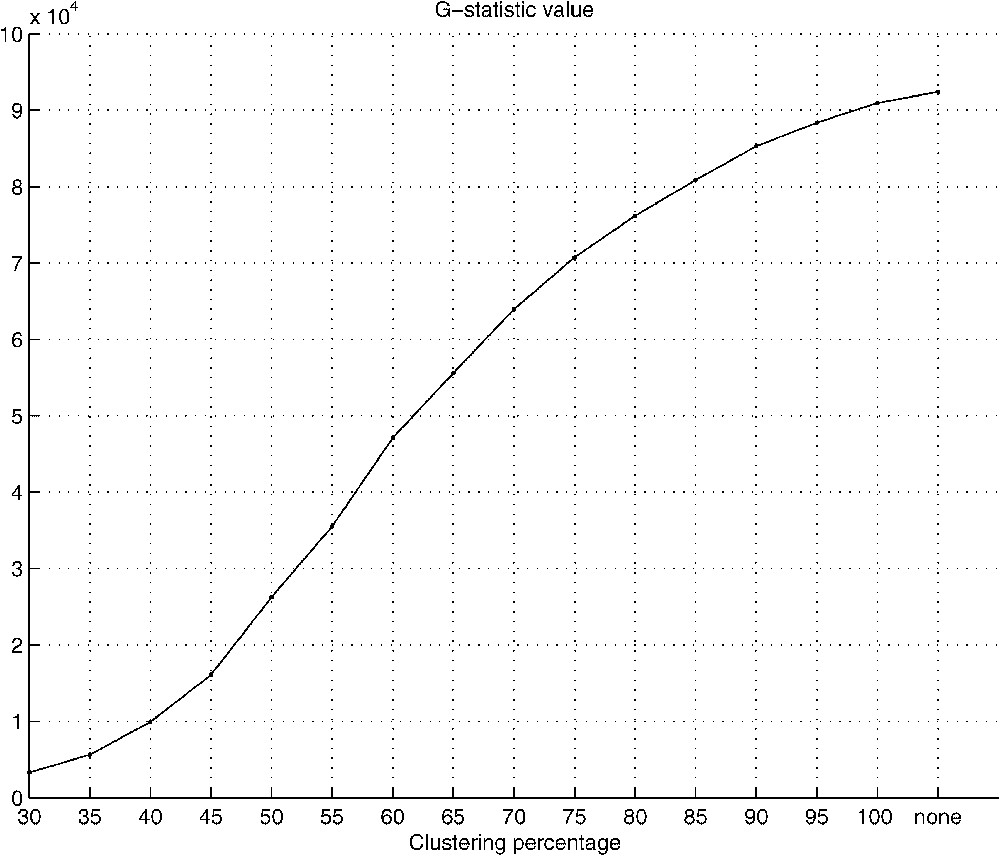
Fig. 1 shows the plot of the G-statistic used for comparison of the overall substitution patterns. The category of data is, in this case, a particular substitution or amino acid pair. The results of the test allow rejecting the null hypothesis of identity of substitution patterns in the two groups of bacteria under consideration. The value of the G-statistic is much higher than the critical value (237.14), corresponding to the 0.01 significance level. Additionally, the G-statistic value increases with increasing clustering percentage, which means that differences between bacterial groups increase when the resolution of input data used to calculate a substitution matrix increases.

G-statistics value for overall substitution pattern comparison. Category of the data is understood as a particular substitution or amino acid pair. Main diagonal entries were analysed separately.
2.2 Step 2. Comparison of amino acid conservation pattern
Similarly to the comparison of overall substitution pattern, results for comparison of conservation of amino acids (the category of data is now identity (diagonal) amino acid pair) at their respective positions in proteins (Fig. 2) have shown significant differences between the AT-rich and the GC-rich groups. Also in this test, the G-statistic value increases with the higher clustering percentage.
G-statistics value for conservation pattern comparison. In this comparison, only main diagonal entries, responsible for conservation of amino acids, were taken into consideration (excluded from previous comparison).
2.3 Step 3. Comparison of substitution patterns for single amino acids
Fig. 3 shows the results of comparison of substitution patterns for single amino acids (a category of data are now counts of pairs related to substitution of particular amino acid by one of the possible 19 amino acids). The results also have shown significant differences between the AT-rich and the GC-rich groups at the level of substitution patterns for single amino acids. The G-statistic shows the previously observed trend, an increase with the higher clustering percentage. The smallest difference is observed in substitution patterns of C (cysteine) and W (tryptophan) and the greatest difference in amino acids E (glutamic acid) and L (leucine).
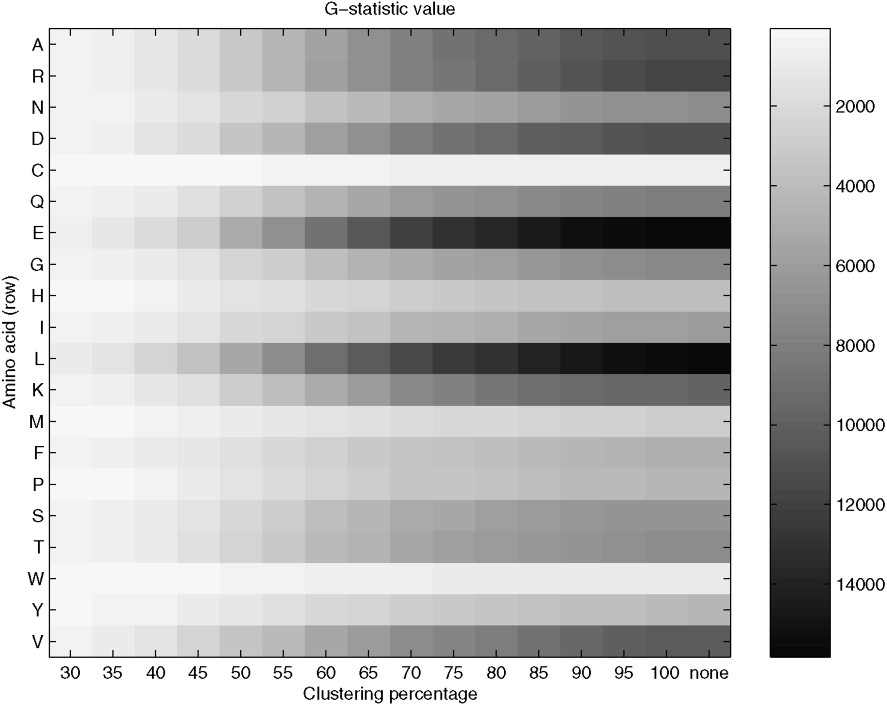
G-statistics value for comparison of substitution patterns for single amino acids. Comparison of single rows allows us to analyse differences in substitution patterns of a given amino acid between the AT-rich and the GC-rich groups of bacterial genomes. More details are given in the text.
2.4 Step 4. Comparison of the intensity of substitution for single amino acids
The results of the comparison of intensity of substitutions (identity pairs versus sum of pairs of different amino acids) are shown in Fig. 4. This analysis reveals a different pattern of significant differences in amino acid substitution patterns between the two groups of bacteria. The absence of significant differences, as one could expect, is observed at lower clustering percentages. However, the increasing trend of the G-statistic observed before, is not present for all the amino acids (Fig. 4C and D). Initially, the G-statistic value increases with clustering percentage, to reach a maximum at the clustering level depending on the particular amino acid (e.g., for cysteine (C) at the clustering level of 55%) and then decreases to the initial level. Consequently, significant differences in substitution patterns analysed are observed at low and medium clustering percentages and are absent at higher clustering percentages.
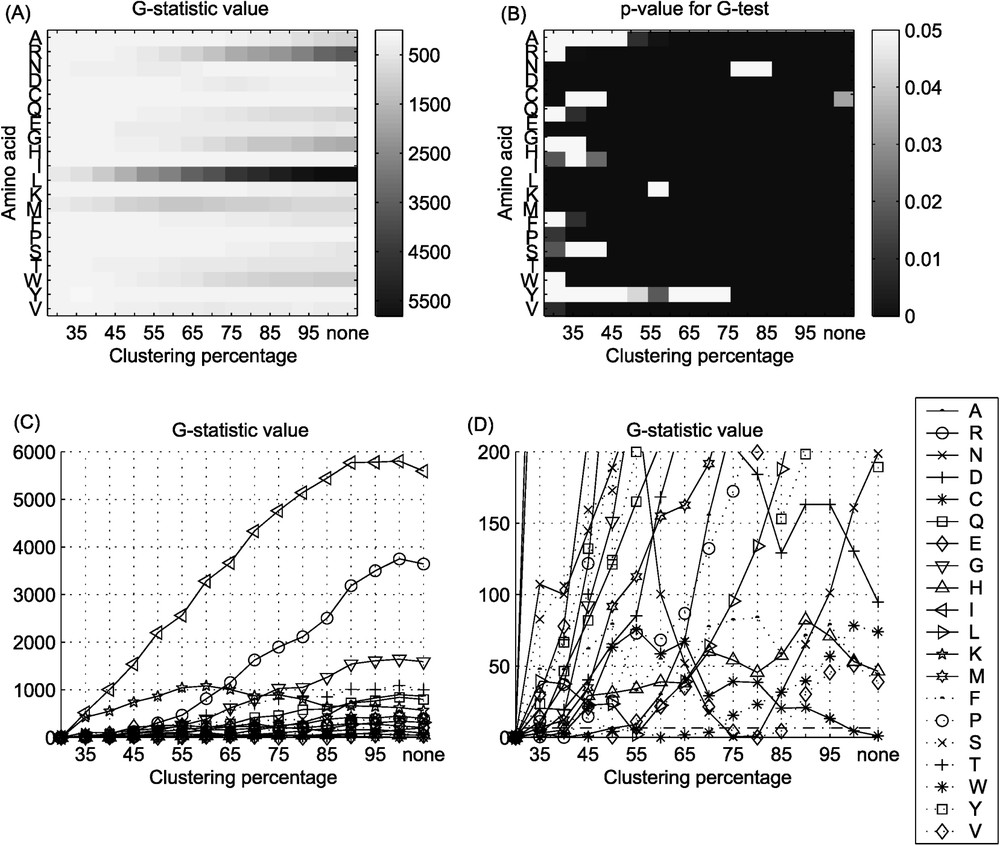
G-statistics value, and the p-value for G-test for the comparison of intensity of substitutions: (A), (C), (D) G-statistics value, (B) p-value for the G-test. In this test, two types of events were taken into consideration, the fact that a particular amino acid undergoing substitution versus this amino acid remaining unchanged. More details are given in the text.
2.5 Step 5. Comparison of single substitutions
Fig. 5 shows results of the comparison of single substitutions (particular kind of amino acid pair versus sum of all the remaining kinds of pairs). Again, we observe a non-monotonous pattern of statistically significant differences between two groups of bacteria. The differences gradually increase with higher clustering percentages, and therefore with higher resolution of the data used to create substitution matrix. The results of this comparison parallel the results of the comparison of substitution patterns for single amino acids. The smallest difference is observed for substitution patterns of C (cysteine) and W (tryptophan) and the greatest difference for amino acids E (glutamic acid) and L (leucine). Additionally, a large difference in substitution patterns for single amino acids is observed for K (lysine) amino acid.
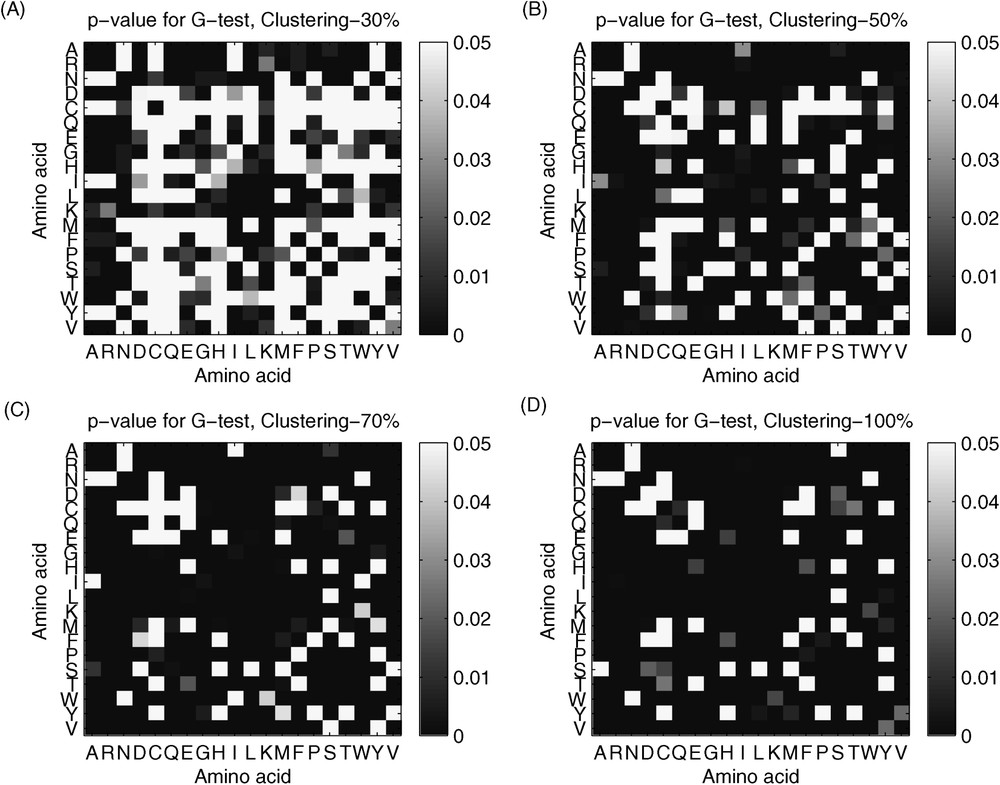
The p-value for G-test for the comparison of single substitutions: (A) clustering 30%, (B) clustering 50%, (C) clustering 70%, (D) Clustering 100%.
3 Conclusions
The algorithm presented in this paper can be considered a novel method for multi-level comparison of amino acid substitution patterns (using nonparametric statistical tests) among different organisms. The method was tested and proved its usefulness for analysis of differences in substitution patterns between two groups of bacteria. The basis for statistical analysis were counts of amino acid pairs calculated using a slightly modified BLOSUM algorithm. Presented approach to comparison is not limited to bacterial organisms and BLOSUM substitution matrices. The analysis should be regarded as a test and a demonstration of features of the algorithm. However, some interesting conclusions on evolutionary differences between the two groups of bacteria can be made.
The analysis has shown statistically significant differences in overall substitution patterns as well as in single amino acid substitution patterns between the two groups of bacteria. Main diagonal entries of the substitution matrix measure the absence of change (conservation) of amino acids. Significant differences between the two groups of bacteria with respect to amino acid conservation pattern provides evidence for different rate of evolutionary changes among bacteria with AT-rich and GC-rich genomes.
The absence of significant differences between the two groups obtained from intensity of substitution and single substitutions analysis suggests that substitution patterns of some of the amino acids are similar in these two groups of organisms.
Additionally, we found by observation that protein sequences encoded by AT-rich genomes differ in amino acid composition between those encoded by GC-rich genomes. According to Yu et al. [10], AT-rich organisms tend to have higher contents of phenylalanine, leucine, isoleucine, aspargine, lysine, tyrosine, and methionine (FLINKYM) encoded by AU-rich codons, and lower contents of proline, arginine, alanine, tryptophan, and glicine (PRAWG), encoded by GC-rich codon sets.
In our case, for protein sequences encoded by AT-rich genomes, we observed excesses of: phenylalanine (0.8%), isoleucine (3.2%), aspargine (1.8%), lysine (3.4%), thyrosine (0.7%), methionine (0.1%), serine (1%) and glutamic acid (0.7%) (FINKYMSE) and shortages of: proline (1,1%), arginine (2.1%), alanine (3.2%), tryptophan (0.5%), glicine (1.8%), histidine (0.3%), valine (1.5%), aspartic acid (0.2%), cysteine (0.1%), leucine (0.5%) (PRAWGHVDCL) and equal (to these encoded by GC-rich genomes) content of qlutamine (Q).
The results of our observation are convergent, except for leucine (L), a greater (0.5%) content of which we found in protein sequences encoded by GC-rich genomes.
3.1 Multiple testing
Multiple testing might have an impact on results particularly in Steps 4 and 5, where Bonferroni corrections [15] markedly limit the number of significant differences. However, since the analysis has an exploratory character, this will not affect the conclusions, except in a straightforward way.
4 Methods
4.1 Preparation of the input data
The source of protein sequences data was the COG (Clusters of Orthologous Groups) database. The COG database contains clustered protein sequences crucial to the most important functions of bacterial life. Data from the COG database, involving 43 bacterial organisms, were divided into two groups, first of 10 bacteria with AT-rich genomes and second of 10 bacteria with GC-rich genomes. GC content in genomes was estimated by counting G and C bases in text files containing complete genome sequence recorded for given bacteria. Such files can be found in GenBank resources [16]. Table 1 presents the two groups of bacteria with the corresponding GC contents.
Bacterial genomes used to create BLOSUM matrices with GC content percentage
| AT-rich | GC% | GC-rich | GC% |
| Ureaplasma urealyticum | 25.50 | Escherichia coli K12 | 50.79 |
| Buchnera sp. APS | 26.31 | Neisseria meningitidis Z2491 | 51.81 |
| Borrelia burgdorferi | 28.59 | Xylella fastidiosa | 52.67 |
| Rickettsia prowazekii | 29.00 | Treponema pallidum | 52.77 |
| Campylobacter jejuni | 30.55 | Mycobacterium leprae | 57.80 |
| Mycoplasma genitalium | 31.69 | Mesorhizobium loti | 62.75 |
| Lactococcus lactis | 35.33 | Mycobacterium tuberculosis | 65.61 |
| Haemophilus influenzae | 38.15 | Deinococcus radiodurans | 66.02 |
| Streptococcus pyogenes | 38.51 | Pseudomonas aeruginosa | 66.55 |
| Helicobacter pylori | 38.87 | Caulobacter crescentus | 67.21 |
Target protein sequences were extracted from each cluster, separately for AT-rich and GC-rich groups. Clusters in the database containing less than two sequences drawn from selected genomes were omitted. Multiple sequences from the same organism were allowed. Freely-available BLOSUM program requires specific kind of multiple alignments called blocks; thus we found original alignments deposited in COG inappropriate for our purpose. Extracted raw protein sequences were passed to the PROTOMAT package [8]. Application of motifj and motomat programs to extracted sequences resulted in 6840 protein blocks in the AT-rich group and 9948 protein blocks in the GC-rich group. Motifj and motomat were run in the non-interactive, iterative, mode, with parameters values being defaults determined automatically by the software. Protein blocks were then concatenated into two BLOCKS databases [8] corresponding to AT-rich and GC-rich organisms. Slightly modified BLOSUM program was used to calculate raw counts of amino acid pairs within protein blocks in both BLOCKS databases for clustering percentage ranging from 30 to 100, and without clustering. As a result, a family of matrices of amino acid pair counts was obtained. Entries of each count matrix were rounded to the nearest integer and symmetrized according to the following formula:
4.2 Statistical analysis
Statistical analysis was carried out in the terms of categorical data. By category of data, we understand a particular amino acid pair, i.e., AG or AR, and so forth. The categories include all possible amino acid substitutions.
Let us note that, for two matrices, only two items from each category are available. This is caused by the process of creation of the substitution matrix, where one sample of amino acid pair counts represents the whole group of organisms. Due to the complexity of the problem (210 categories including identity pairs AA, RR, etc.) and the different kinds of information about protein substitutions that can be read from a matrix, the analysis was divided into several hierarchical steps. Throughout the analysis, the counts of amino acid pairs were placed in contingency tables, each of which consisted of two rows (AT-rich and GC-rich bacterial genomes) and different, for each step of analysis, number of columns, corresponding to particular amino acid pairs.
Taking into consideration the character of the data, the analysis was carried out using non-parametric tests of consistency of distribution. Standard test of consistency of distributions for contingency data use the chi-square or G-statistic. The G-statistic is calculated using the following expression [15]:
The null hypothesis for all the described steps of analysis assumed consistency of distributions of features in both populations, which in this particular case means consistency of substitution patterns between AT-rich and GC-rich groups of bacterial genomes. The significance level for all tests was set to .
To confirm the results, an additional set of permutation tests was carried out. Results obtained using computationally the intensive Fisher–Freeman–Halton test [17] (with Monte Carlo option due to the large size of the dataset), implemented in StatXact 5 software [18], are not appreciably different from simple G-test results.
4.3 Step 1. Comparison of the overall substitution pattern
Category of data is understood as a particular substitution or amino acid pair. Assuming symmetry of the matrices, this makes 190 off-diagonal categories. Diagonal entries are equal to the rates of conservative changes. Due to relatively large values of these entries (the case that amino acid remains in the same state is most probable) and their dominance over a row, these values were excluded from this analysis as they would have major influence on the test results. Diagonal entries were analysed separately. An example of a contingency table can be found in Table 2.
Sample contingency table for comparison of the overall substitution pattern (clustering 50%)
| AT | 814 | 1312 | … | 836 |
| GC | 8707 | 3361 | … | 2200 |
4.4 Step 2. Comparison of amino acid conservation pattern
This test was carried out similarly to the previous one, but now only main diagonal entries, excluded from the previous comparison, were taken into consideration. As mentioned before, main diagonal entries are counts of identity pairs. This test detects differences in mutability of amino acids in the two groups of bacteria under consideration. However, this information is not sufficient: except for the fact that the differences exist, we do not obtain any more detailed information about the level of participation of particular amino acids in the differences. An example of a corresponding contingency table is presented in Table 3.
Sample contingency table for conservation rate comparison (clustering 50%)
| AT | 12774 | 8141 | … | 9804 |
| GC | 51976 | 29626 | … | 30620 |
4.5 Step 3. Comparison of substitution patterns for single amino acids
Off-diagonal entries in particular rows count the substitutions of a given amino acid by one of the remaining 19 amino acids. Comparison of single rows allows analysing differences in substitution patterns of given amino acid between the AT-rich and the GC-rich groups of bacterial genomes. The test is similar to the test used for analysis of diagonal entries, except, this step requires a separate test for each row of the matrix. Examples of corresponding contingency tables are presented in Table 4.
Sample contingency tables for substitution patterns for single amino acids comparison (clustering 50%)
| AT | 814 | 1312 | … | 2736 |
| GC | 8707 | 3361 | … | 13424 |
| AT | 814 | 1064 | … | 566 |
| GC | 8707 | 2642 | … | 4104 |
4.6 Step 4. Comparison of intensity of substitution for single amino acids
In this test the data are divided into two categories defined by types of events, first when an amino acid remains unchanged and second that when it undergoes an arbitrary substitution.
The idea of this test is to indicate differences between AT-rich and GC-rich groups of bacterial genomes with respect to a particular amino acid undergoing or not undergoing substitution. The design of a contingency table for this test is shown in Table 5.
Method of building a contingency table for the intensity of substitution comparison
| No change | Change (substitution) |
4.7 Step 5. Comparison of single substitutions
The next step, after revealing differences in the fact of undergoing or not undergoing substitution of particular amino acids, is a more detailed analysis of the matrix elements. The idea of this test is show in detail which substitutions (amino acid pairs) cause the differences between AT-rich and GC-rich group of bacterial genomes. The design of a contingency table for this test is shown in Table 6.
Method of building a contingency table for single substitutions comparison
4.8 Software
The analysis was carried out using the Matlab 5 system from Mathworks [19]. Matlab scripts used to calculate test statistics and to visualize results are available from the first author upon request. Table 7 shows summary of all five steps of the analysis.
Summary of the five steps of statistical analysis
| Step 1 | Step 2 | Step 3 | Step 4 | Step 5 | |
| Test range | Matrix | Main diagonal | Single rows (off-diagonal entries) | Main diagonal and off-diagonal entries from single rows | Single matrix elements |
| Number of categories | 190 | 20 | 19 | 2 | 2 |
| distribution degrees of freedom | 189 | 19 | 18 | 1 | 1 |
| Critical value for significance level 0.01 | 237.14 | 36.19 | 34.80 | 6.63 | 6.63 |
| Table dimensions | 2 × 190 | 2 × 20 | 2 × 19 | 2 × 2 | 2 × 2 |
| Tables per matrix | 1 | 1 | 20 | 20 | 210 |
4.9 Multiple testing
Steps 3, 4 and 5 of our algorithm consist of , and 210 repeated identical tests, respectively. Therefore, at a nominal significance level α per test, under the hypothesis that there is no difference in each tested comparison (i.e., holds n times), there will be on the average αn falsely significant test outcomes. This amounts to inflation of the real significance level. To account for this in our analysis, the Bonferroni corrections [15] may be used, which requires setting the nominal significance level at (see ‘Results’ and ‘Discussion’ sections).
Authors' contributions
M.P. prepared the data used, carried out the statistical analysis and visualisation of results. M.K. designed the analysis. M.P. and M.K. jointly prepared the manuscript.
Acknowledgements
We thank Joanna Polanska from the Institute of Automatic Control for her help with statistical analysis. This work was supported by KBN (Polish Committee for Scientific Research) grant 4T11F 018 24 and by the NHLBI contract N01-HV-28184.