

1 Introduction
Some of the greatest challenges for biologists are to understand and to evaluate biodiversity [1]. One of the measures commonly used to assess biodiversity is species richness, as defined by the number of species at a site or habitat. However, the evaluation of species richness is strongly dependent on the definition of a species, an intensively debated question [2]. Therefore, higher taxon richness, mostly on morphological criteria, is often used as a surrogate to evaluate biodiversity rather than species richness [3,4]. This approach is valid only if there is no systematics bias, i.e., when only monophyletic groups are used and when the taxonomic boundaries are similar among groups.
Another way of measuring biodiversity involves the screening of genetic variability among populations. Genetic variability may be at least partly reflected by the phylogenetic diversity (PD), which is estimated as the sum of the branch lengths in a phylogenetic tree [5]. The genetic and morphological approaches generate different assessments of biodiversity values, perhaps reflecting differences in the temporal and spatial scales of the determining processes [6]. It is therefore necessary to clarify their practical utility for the assessment of biodiversity in taxa in which an exhaustive inventory cannot be compiled due to the high number of species and/or the environmental conditions.
This is often the case in tropical environments, where the greatest species diversity is recorded [7–10], as for amphibians. The rate of description of new species is also higher in these zones than anywhere else [11].
The Guianan region is one of the last wild areas in South America and among the three richest tropical regions on Earth (Guiana Shield Conservation Priority Setting Workshop, 5–9 April 2002, Paramaribo, Surinam). However, it is extremely difficult to assess the diversity of many taxa in this region for practical reasons. This is the case for amphibians, for which biologists are extremely concerned since few years. Indeed, this group is subject to a fast worldwide decline particularly worrying in South America [12–16]. Even though collecting efforts have intensified in many previously unknown areas, especially in this part of the world [17], large regions remain unknown and many reduced areas of potentially high diversity have not been examined [18]. There is therefore an urgent need to characterise the diversity of amphibians by using rigorous approaches. It is unclear whether this should involve higher taxonomic biodiversity analysis, phylogenetic diversity analysis or both.
Here, we used a recent taxonomical, geographical and ecological assessment based on 30 years of work on the species present in French Guiana. It concerns 110 amphibian species over 90 000 km2 [19]. We considered taxonomy as a surrogate of morphological diversity. Thus, we chose a group for which we know the number of morphologically distinct species, their distribution area and basic aspects of their ecology (the habitat). We concentrated on amphibians belonging to the second largest frog family in South America: the Hylidae (neotropical tree frogs), with 25 genera in this part of the world [17]. The family Hylidae is divided into four subfamilies [20], only two of which are present in French Guiana: the Phyllomedusinae, with four species, and the Hylinae, with 38 species [19,21,22].
Members of the subfamily Phyllomedusinae are widely distributed in tropical parts of Middle and South America [23]. In this group, the constricted pupil is vertically elliptical. These tree frogs, with a green dorsal coloration, are adapted to an arboreal lifestyle. Only one genus, Phyllomedusa, among the three genera constituting this group, is present in French Guiana [19].
Members of the subfamily Hylinae are found throughout the temperate and tropical parts of North and South America, in temperate Eurasia, Japan, extreme northern Africa, and the West Indies [24]. Five genera are found in French Guiana: Hyla, Scinax, Osteocephalus, Phrynohyas and Sphaenorhynchus. The two largest Hyline genera are Hyla and Scinax, containing respectively 45 and 7 species groups (or currently five species groups [25]).
The genus Hyla does not share any unique features and two major groups within Hyla are present in French Guiana, the Gladiator frogs sensu lato and the 2 -chromosome lineage [24,26]. The Gladiator frogs are represented by seven species groups in French Guiana and the 30-chromosome Hyla by six species groups [19]. This is the only genus within hylines found in North, Central and South America, Eurasia and the extreme north of Africa [24,27]. We have previously shown that some representatives of the genus Hyla form a monophyletic group according to partial 16S rRNA gene sequences, but the bootstrap proportion was low [28]. In contrast, morphological analysis revealed that this genus was paraphyletic [27]. These results seem to be contradictory and require clarification.
The genus Scinax is divided into seven [19] or five groups [25,29]. Two of these are represented in French Guiana. The first is the rostrata group, which includes Scinax jolyi, Scinax proboscideus and Scinax nebulosa. The second is the rubra group, which includes Scinax rubra, S x-signatus, Scinax boesemani and Scinax cruentomma [19,25]. Faivovich [29] found the rostrata group to be nested within the rubra group, making it non-monophyletic. Scinax species were initially informally grouped in a Hyla rubra group [29], mainly on the basis of sperm cell morphology, then included in a genus named Ololygon. It was only in 1992 that the name Scinax took priority over Ololygon [30]. In a previous study based on 16S rRNA gene sequences and a few species, we showed that the Scinax genus was homophyletic and supported by a high bootstrap proportion [28]. Moreover, based on morphology, this homophyly is supported by ten synapomorphies [29].
In the light of this systematic framework, we use a subset of species constituted by 33 specimens belonging to the family Hylidae (genera Scinax, Osteocephalus, Hyla, and Phrynohyas), three specimens from the family Centrolenidae (Hyalinobatrachium and Cochranella genera) were used to verify the impact of outgroup on Hylinae phylogenetics relationships [28,31,32], and two Eleutherodactylus (Leptodactylidae) specimens were used as outgroups. Phylogenetic diversity was estimated by sequencing two mitochondrial genes (16S and 12S rDNA) and two nuclear genes (18S rDNA and tyrosinase). These sequences have been successfully used to assess the relationships among some orders, families and species of amphibians [31–40].
In this paper, we tested congruence between molecular and morphological/taxonomic data at the species, genus and family levels in one subset representative of amphibian diversity in the Guianan region.
If there is congruence between molecular markers and morphology, the morphological criteria will be sufficient for the study of neotropical frog biodiversity and the higher taxonomic diversity criteria will be a rigorous alternative for the conservation of divergent lineages.
If there is no congruence between molecular markers and morphology in this representative subset, morphology must be systematically coupled to molecular markers when studying the biodiversity of neotropical frogs and the higher taxonomic diversity must be coupled to phylogenetic diversity for the conservation of divergent and reticulate lineages.
2 Materials and methods
2.1 Biological samples
Twenty-nine new species were added to those studied by Salducci et al. [28]. Thus, a total of 143 new sequences were obtained from 33 Hylidae constituted by 11 individuals belonging to the genus Scinax (four species assigned to the rubra group and four species to the rostrata group), 14 to the genus Hyla (Gladiator frogs: four species of the geographica group, two of the albopunctata group and one for the boans group and one for the granosa group; Hyla 30 chromosomes: two species of the nana group, one of the leucophyllata group, one of the luteocellata group 1 of the minuta group, one of the parviceps group), three to the genus Osteocephalus, two to the genus Phrynohyas, and three to the genus Phyllomedusa. Three specimens from the Centrolenidae (Hyalinobatrachium and Cochranella genera) and two Leptodactylidae (Eleutherodactylus) were used as outgroups. Thirty-six specimens were collected in French Guiana over a four-year period. Samples of Scinax rostrata and Scinax elaeochroa were collected respectively in Venezuela and in Costa Rica (National Museum of Natural History of The Netherlands). The geographical ranges of the specimens examined are given in Table 1, and a map of collecting localities is given in Fig. 1. Tissue samples were derived from muscle by performing a biopsy. From preserved specimens in collections, we used liver tissues preserved in ethanol.
List of batrachians used for this study, with the locality number (see Fig. 1)
| Family | Subfamily | Species | Genbank accession number 16S | Genbank accession number 12S | Genbank accession number 18S | Genbank accession number tyrosinase | Origin locality number |
| Hylidae | Hylinae | Scinax rubra 1 | AF467264 | – | – | – | Guiana Antecum Pata 6 |
| Scinax rubra 2 | – | – | – | – | Guiana Grand Santi 7 | ||
| Scinax cruentomma 1 | AF467263 | – | – | – | Guiana Mountain of Kaw 3 | ||
| Scinax cruentomma 2 | – | – | – | – | Guiana Mountain of Kaw 3 | ||
| Scinax jolyi 1 | AF467261 | – | – | – | Guiana Swamp of Kaw 3 | ||
| Scinax jolyi 2 | AF467261 | – | – | – | Guiana Creek of Gabrielle 2 | ||
| Scinax nebulosa | AF467262 | – | – | – | Guiana Regina Road St Georges 4 | ||
| Scinax proboscideus | – | – | – | – | Guiana Mountain of Kaw 3 | ||
| Scinax boesemani | – | – | – | – | Guiana Grand Santi 7 | ||
| Scinax rostrata | – | – | – | – | Venezuela | ||
| Scinax elaeochroa | – | – | – | – | Costa Rica | ||
| Hyla leucophyllata | – | – | – | – | Guiana Mountain of Kaw 3 | ||
| Hyla sp1 | – | – | – | – | Guiana Mountain of Kaw 3 | ||
| Hyla minuscula | – | – | – | – | Guiana Mana 9 | ||
| Hyla ornatissima | – | – | – | – | Guiana ChutesVoltaires 8 | ||
| Hyla raniceps | AF467269 | – | – | – | Guiana Yi-Yi's Creek 1 | ||
| Hyla dentei | AF467270 | – | – | – | Guiana Mountain of Kaw 3 | ||
| Hyla brevifrons | – | – | – | – | Guiana Mountain of Kaw 3 | ||
| Hyla multifasciata | – | – | – | Guiana Mountain of Kaw 3 | |||
| Hyla nana | – | – | – | – | Guiana Mountain of Kaw 3 | ||
| Hyla minuta | – | – | – | – | Guiana Mountain of Kaw 3 | ||
| Hyla boans | – | – | – | – | Guiana Mont Bakra 11 | ||
| Hyla geographica | – | – | – | – | Guiana Grand Santi 7 | ||
| Hyla fasciata | – | – | – | – | Guatemala 14 | ||
| Hyla calcarata | – | – | – | – | Guiana Creek of Margot 13 | ||
| Hylidae | Hylinae | Osteocephalus oophagus | AF467267 | – | – | – | Guiana Mountain of Kaw 3 |
| Osteocephalus taurinus | – | – | – | – | Guiana Saül 12 | ||
| Osteocephalus leprieurii | – | – | – | – | Guiana Creek of Margot 13 | ||
| Phrynohyas coriacea | – | – | – | – | Guiana Mountain of Kaw 3 | ||
| Phrynohyas venelosa | – | – | – | – | Guiana Guatemala 14 | ||
| Phyllomedusinae | Phyllomedusa tomopterna | – | – | – | – | Guiana Mountain of Kaw 3 | |
| Phyllomedusa hypochondrialis | – | – | – | – | Guiana Grand Santi 7 | ||
| Phyllomedusa bicolor | Guiana Saül 12 | ||||||
| Centrolenidae | Hyalinobatrachium taylori | AF467268 | – | – | – | Guiana Creek of Gabrielle 2 | |
| Hyalinobatrachium taylori 2 | – | – | – | – | Guiana Tibourou 10 | ||
| Cochranella sp | – | – | – | – | Guiana Mont Bakra 11 | ||
| Leptodactylidae | Eleutherodactylinae | Eleutherodactylus zeuctotylus1 | – | – | – | – | Guiana Mountain of Kaw 3 |
| Eleutherodactylus zeuctotylus 2 | – | – | – | – | Guiana Tibourou 10 |
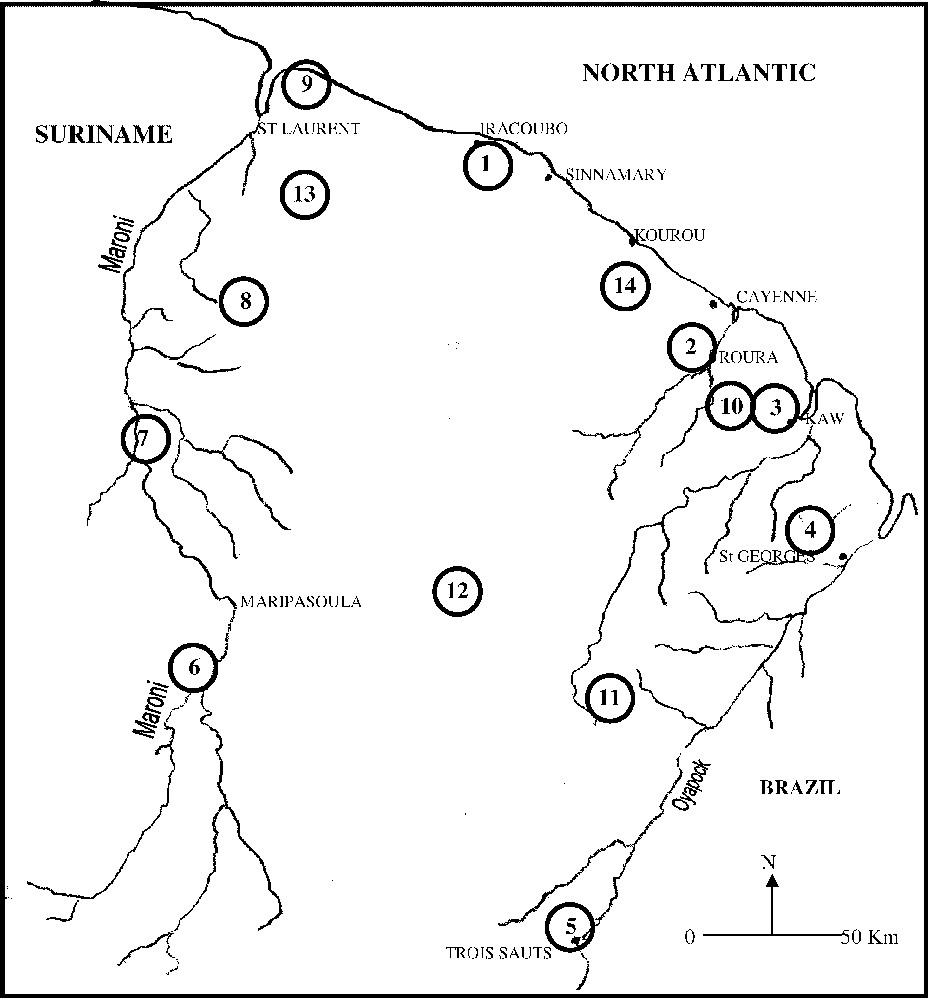
Map of French Guiana showing the localities of the samples collected.
© 2000 ‘Service du patrimoine naturel’, MNHN, Paris.
2.2 Molecular data
Total DNA was extracted from muscle tissue samples by digestion with proteinase K for 12 h at 37 °C followed by standard phenol/chloroform extraction [41]. Two partial mitochondrial (mt) and two nuclear (nu) DNA fragments were amplified by standard PCR techniques. The mt DNA fragments were: 430 bp of the 16S rDNA gene and 397 bp of the 12S rDNA gene. These fragments were amplified using the primers listed in Table 2. The nuclear DNA fragments were: 403 bp of exon 1 of the tyrosinase gene and 1187 bp of the 18S rRNA gene. The primers used for amplification were as described by Bossuyt and Milinkovitch [42] for tyrosinase and by Miquelis et al. [43] for 18S rDNA.
Primers used for amplifying and sequencing segments of mitochondrial genes F at the end of the primer name = forward, R at the end of the primer name = reverse
| Name | Gene | Sequence - | Reference |
| N-934F | 16S | CGCCTGTTTACCAAAAACATCG | [72] |
| 3259R | 16S | CCGCTTTGAGCTCAGATCA | [73] |
| N16F | 16S | TATCCCTAGGGTAACTTG | This study |
| N16R | 16S | TTACCAAAAACATCGCCT | This study |
| N316F | 16S | GGAGGTTATTTTTTGTTC | This study |
| N316R | 16S | CGAGAAGACCCTATGGAG | This study |
| N12F | 12S | GGTATCTAATCCCAGTTTGT | This study |
| N12R | 12S | AGGTTTGGTCCTAGCCTT | This study |
| 12LPF tRNA phe-L | 12S | GCRCTGAARATGCTRAGATGARCCC | [74] |
| 12HSR 12SF-H | 12S | CTTGGCTCGTAGTTCCCTGGCG | [74] |
| Tyr1A | Tyrosinase | AGGTCCTCTTRAGCAAGGAATG | [42] |
| Tyr1E | Tyrosinase | GAGAAGAAAGAWGCTGGGCTGAG | [42] |
| 18SF | 18S1 | CCACATCCAAGGAAGGCAGCAGGC | [43] |
| 18SR | 18S1 | CCCGTGTTGAGTCAAATTAA | [43] |
| 18S2F | 18S2 | CGTAGTTCCGACCATAAA | This study |
| rev-Hillis18g-S | 18S2 | GGAAACCTTGTTACGACTT | [74] |
PCR was performed in a 50-μl total volume as in Gilles et al. [44]. Cycle parameters were as follows:
- – for 16S rDNA, 2 min at 92 °C; then five cycles of 15 s at 92 °C, 45 s at 46 °C, 1 min 30 s at 72 °C; then 30 cycles of 15 s at 92 °C, 45 s at 48 °C, 1 min at 72 °C; and finally 7 min at 72 °C;
- – for 12 S rDNA and 18S rDNA, 2 min at 92 °C; then 5 cycles of 15 s at 92 °C, 45 s at 48 °C, 1 min 30 s at 72 °C; then 30 cycles of 15 s at 92 °C, 45 s at 52 °C, 1 min at 72 °C; and finally 7 min at 72 °C;
- – for tyrosinase, 2 min at 92 °C; then five cycles of 15 s at 92 °C, 45 s at 50 °C, 1 min 30 s at 72 °C; then 30 cycles of 15 s at 92 °C, 45 s at 54 °C, 1 min at 72 °C; and finally 7 min at 72 °C.
The purified PCR products were sequenced using an automated sequencer (Genome Express S.A.) and the same PCR primers as used in amplifications. Fifteen new sequences were obtained for the 410-bp fragment of 16S rDNA and 24 new sequences were obtained for the 403-bp fragment of 12S rDNA, for the 1197-bp fragment of 18S rDNA and for the 393-bp fragment of tyrosinase. See Table 1 for accession numbers.
2.3 Data analysis
The 16S rDNA and 12S rDNA gene sequences were aligned using Clustal X [45] and compared with the alignment based on secondary structure [46]. The 16S secondary structure was visualised as described in [28]. We carried out a similar procedure with the Rana pipiens sequence as a model for the 12S secondary structure. The amplified 12S fragments corresponded to the helices 1 to 26. For this study, we used the software SOAP [47] to identify unstable blocks in alignments for the 16S and the 12S datasets. Saturation was visualised using the software package MUST [48].
Phylogenetic analyses were performed using three different approaches:
- (1) the Neighbour-Joining (NJ) method [49], using a matrix based on the Tamura–Nei distance with gamma parameter [50];
- (2) a cladistic approach using the Maximum-Parsimony (MP) criterion and the heuristic search with 10 random additions of taxa and TBR branch-swapping as implemented in PAUP 4b10 [51];
- (3) the maximum-likelihood (ML) method using the evolutionary model retained by MODELTEST [52]:
- – Lset mitochondrial (GTR + I + G selected by AIC) Base = (0.2671 0.1631 0.2136) Nst = 6 Rmat = (0.1829 5.4352 1.1539 0.2491 1.7544) Rates = gamma Shape = 0.6890 Pinvar = 0.2813;
- – Lset nuclear Base = equal Nst = 2 TRatio = 1.9683 Rates = gamma Shape = 0.6991 Pinvar = 0;
- – Lset combined (GTR + I + G selected by AIC) Base = (0.2427 0.2246 0.2452) Nst = 6 Rmat = (0.2603 4.6592 1.3927 0.3127 1.7642) Rates = gamma Shape = 0.5049 Pinvar = 0.5292.
3 Results
3.1 Combined analysis of mitochondrial datasets
3.1.1 Phylogenetic analysis
The incongruence test detected no significant heterogeneity between the 12S and 16S datasets (). Indeed, according to the Shimodaira–Hasegawa and Wilcoxon sign-rank tests, the 16S constraint trees were significantly different to the 12S and total data trees (considering the 12S rDNA dataset and the total dataset). However, the 12S and total data trees did not differ significantly from the 16S rDNA tree according to the Shimodaira–Hasegawa test (considering the 16S rDNA dataset). This pattern seems to be due to the lack of phylogenetic information in the 16S dataset since few nodes were supported.
Saturation was observed from the transition and transversion substitution patterns (Fig. 2A, C, and E). The homophyly of the Hylinae genera was tested using an 813-bp region of the total dataset. Of the 813 positions, 394 were informative (gaps were treated as missing for the unweighted parsimony analysis). We found one single parsimonious tree (2035 steps). The g1 value was −0.76, the CI was equal to 0.387, the RI was equal to 0.620.
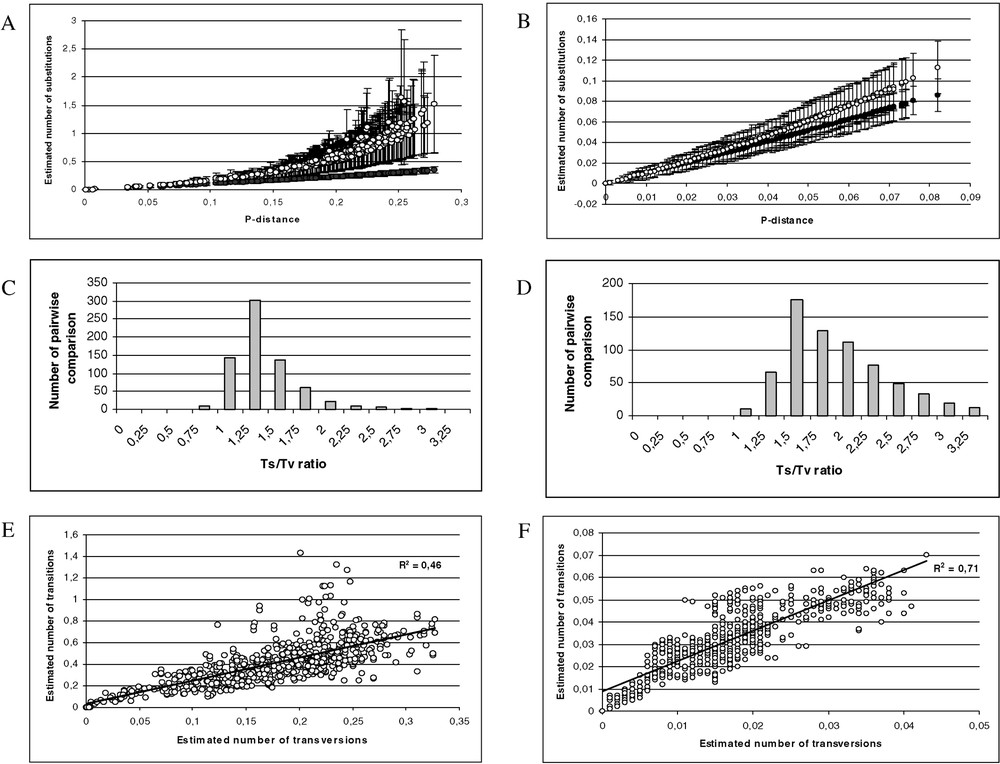
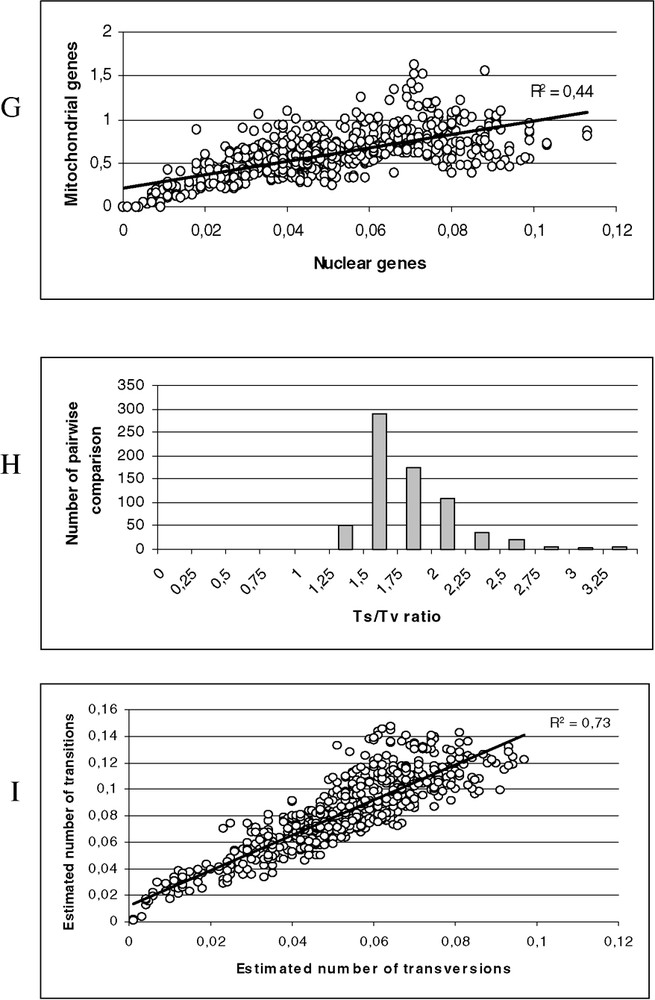
(A) Scatter plots obtained from 813 positions of the 16S rDNA and 12S rDNA of 38 species. X axis: pairwise number of substitutions using the p distance; Y axis: pairwise number of substitutions using the Tamura–Nei model with alpha = 0.30 (open circle) and Jukes and Cantor (black circle). (B) Scatter plots obtained from 1590 positions of the tyrosinase and 18S rDNA of 38 species. X axis: pairwise number of substitutions using the p distance; Y axis: pairwise number of substitutions using the Tamura–Nei model with alpha = 0.21 (open circle) and Jukes and Cantor (black circle). (C) Distribution of the transition–transversion ratio using the 16S rDNA and 12S rDNA of 38 species (μ=1.26; σ=0.49). (D) Distribution of the transition–transversion ratio using the tyrosinase and 18S rDNA of 38 species (μ=1.81; σ=0.57). (E) Scatter plots obtained from 813 positions of the 16S rDNA and 12S rDNA of 38 species. X axis: pairwise number of substitutions using transversions; Y axis: pairwise number of substitutions using the transition. (F) Scatter plots obtained from 1590 positions of the tyrosinase and 18S rDNA of 38 species. X axis: pairwise number of substitutions using transversions; Y axis: pairwise number of substitutions using the transition. (G) Scatter plots obtained for 38 species, X axis: pairwise number of substitutions using the Tamura–Nei model with alpha = 0.21 from 1590 positions of the tyrosinase and 18S rDNA; Y axis: pairwise number of substitutions using the Tamura–Nei model with alpha = 0.30 obtained from 813 positions of the 16S rDNA and 12S rDNA. (H) Distribution of the transition–transversion ratio using the tyrosinase, 18S rDNA, 16S rDNA and 12S rDNA of 38 species (μ=1.62; σ=0.40). (I) Scatter plots obtained from 2403 positions of the tyrosinase, 18S rDNA, 16S rDNA and 12S rDNA of 38 species. X axis: pairwise number of substitutions using transversions; Y axis: pairwise number of substitutions using the transition.
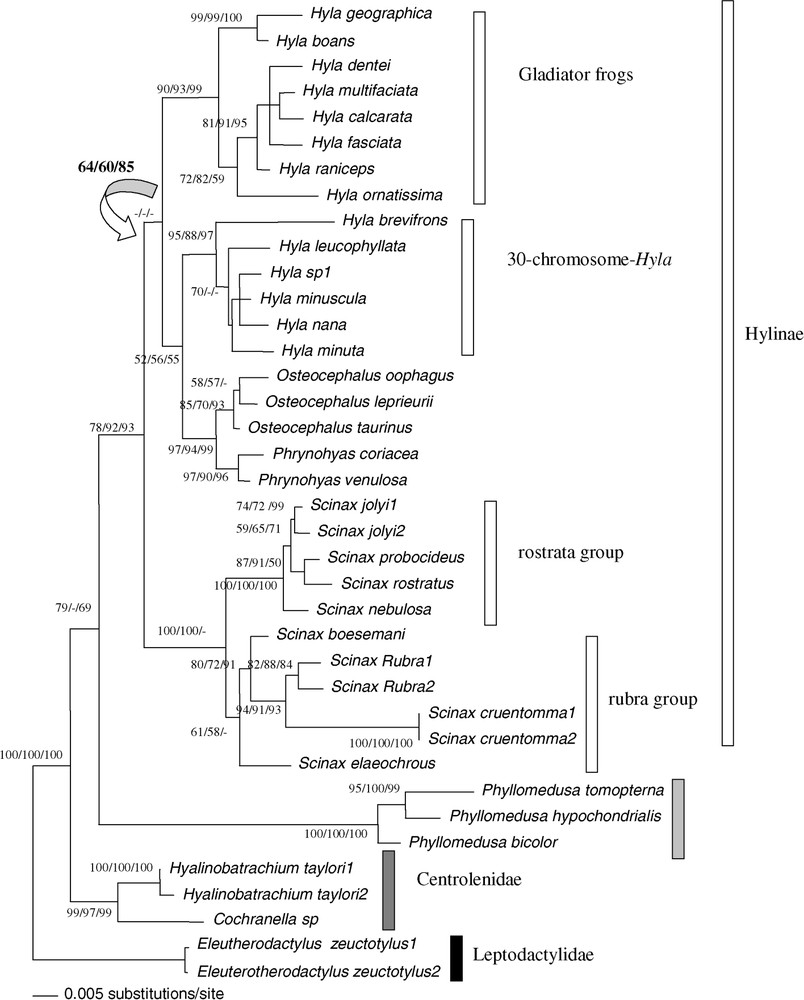
The combination of the two datasets showed phylogenetic relationships within the French Guianan Hylidae at a better resolution than fragments analysed separately (Fig. 3). The genus Scinax constituted a homophyletic group with a high bootstrap support (BP = 100/100/97, ML/MP/NJ). We detected two groups: the first one, the rostrata species group was constituted by Scinax jolyi, Scinax proboscideus, Scinax rostrata and Scinax nebulosa (BP = 92/100/100) and the second one, the rubra species group by Scinax rubra, Scinax cruentomma, Scinax boesemani and Scinax elaeochroa (BP = 98/100/100).
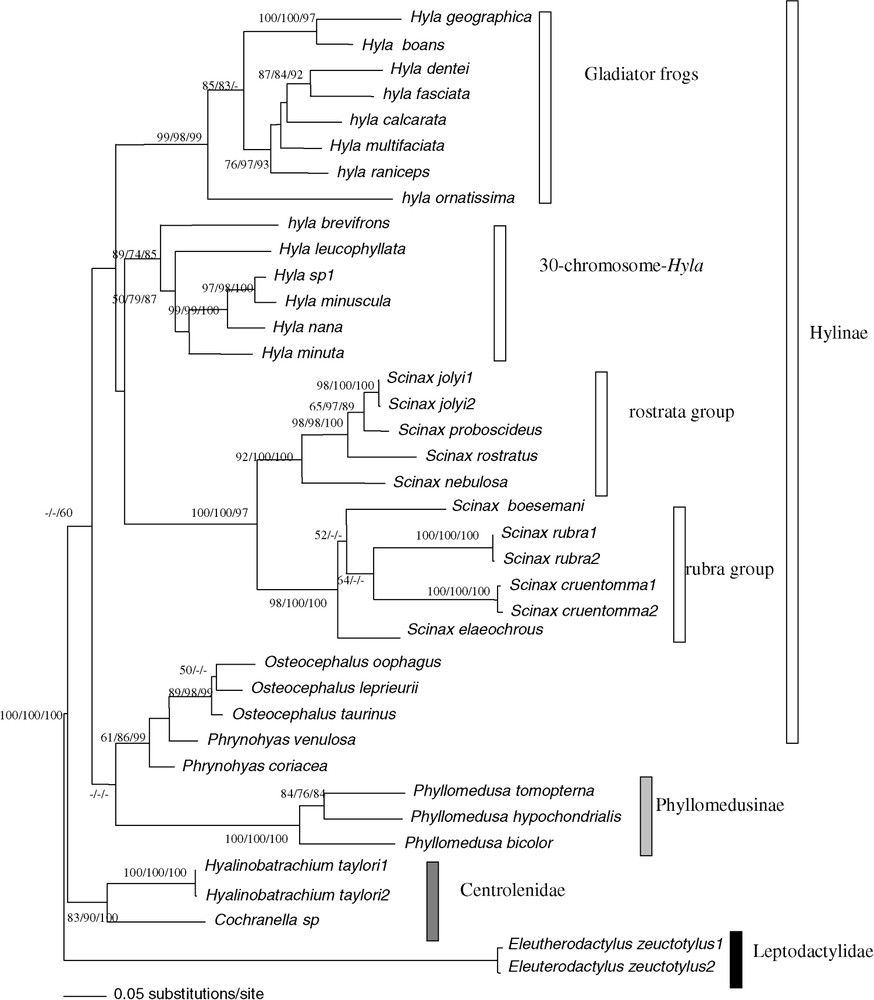
Bootstrap analyses carried out with 1000 iterations using the 813 pb of the 16S rDNA and 12S rDNA among 38 ‘species’ of Hyla, Osteocephalus, Scinax, Phrynohyas, Phyllomedusa, Cochranella and Hyalinobatrachium genera: using Maximum-Likelihood bootstrap value on the left, Maximum-Parsimony bootstrap value on the middle, Neighbour-Joining on a matrix of the Tamura–Nei (alpha = 0.30) model right bootstrap value. The Maximum-Likelihood tree is shown (−ln=9450.77869). The tree was rooted on Eleutherodactylus as outgroup.
The homophyly of genus Hyla was not supported (Fig. 3). The homophyly of the two major groups of Hyla was confirmed by the ‘mitochondrial total evidence’ approach (BP = 89/74/85 for the first 30 chromosomes group H. minuscula, Hyla nana, H. sp1, H. leucophyllata, H. brevifrons, H. minuta, and bp = 99/98/99 for the ‘Gladiator frogs’ group H. multifasciata, H. raniceps, H. calcarata, H. fasciata, H. dentei, H. geographica, H. boans, H. ornatissima). Furthermore, the species Phrynohyas was the sister group to Osteocephalus (BP = 61/86/99). We observed the homophyly of the Centrolenidae (BP = 83/90/100), which was the sister group to the Hylidae, but this topology was only supported in NJ. On a lower systematic level, we noted that the Hyla geographica and the H. nana species group are paraphyletic. Indeed H. geographica clustered with H. boans and H. sp.1 with H. minuscula with high bootstrap supports.
3.1.2 Genetic diversity of the 16S rRNA and 12S rRNA genes
Considering the homogeneity between the two partitions (12S and 16S) and the correlation coefficient between the two distance matrices (0.837), we estimated the genetic variability [63] using the complete dataset. According to the Tamura–Nei genetic distance alpha = 0.30 (Table 3), the variability between the different genera of family Hylidae ranged from to . The genetic divergence between the Centrolenidae (Hyalinobatrachium and Cochranella) and the Hylidae ranged from with Phrynohyas to with Phyllomedusa. The genus Scinax displayed a within group average of (data not shown) and the genus Hyla yielded an average of . Genetic diversity within the two clades was respectively (Hyla 30-chromosome group) and (‘gladiator frogs’). The diversity within the genus Hyla is huge, but we need to reconsider this result in light of the polyphyletic pattern of this group. The genetic diversity between the two groups of Hyla was and the variability between the two groups of Scinax was . By comparison, the genetic diversity between Osteocephalus and Phrynohyas is equal to . These results were corroborated by the mismatch analyses (Table 5), which revealed no congruence between the taxonomic levels (subfamily and family) and the molecular features.
Between group average using the Tamura–Nei (alpha parameter for the gamma shape equal to 0.30) for the seven genera standard errors estimated by bootstrap method (1000 replications) for the 16S and 12S mitochondrial DNA (813 bp)
| 1 | 2 | 3 | 4 | 5 | 6 | 7 | |
| [1] Hyla | 0.048 | 0.068 | 0.064 | 0.102 | 0.124 | 0.153 | |
| [2] Phrynohyas | 0.371 | 0.019 | 0.041 | 0.092 | 0.078 | 0.111 | |
| [3] Osteocephalus | 0.466 | 0.129 | 0.066 | 0.102 | 0.081 | 0.156 | |
| [4] Centrolenidae | 0.490 | 0.279 | 0.382 | 0.102 | 0.125 | 0.123 | |
| [5] Scinax | 0.683 | 0.529 | 0.590 | 0.646 | 0.151 | 0.258 | |
| [6] Phyllomedusa | 0.785 | 0.453 | 0.495 | 0.685 | 0.852 | 0.218 | |
| [7] Eleutherodactylus | 0.866 | 0.624 | 0.707 | 0.648 | 1.188 | 0.985 |
Test of the homogeneity between the different mismatch distributions using the Kolmogorov–Smirnov test with alpha equal to 0.05 (see text for more details)
| 2 | Within Genus Hyla | Within Genus Scinax | Within Hylinae | Between Hylinae-Phyllomedusinae | Between Hylidae-Centrolenidae |
| 1 | |||||
| Within Genus Hyla | 1>2 | 1<2 | 1<2 | 1<2 | |
| Within Genus Scinax | NS | 1<2 | 1<2 | 1<2 | |
| Within Hylinae | 1>2 | 1>2 | 1<2 | 1<2 | |
| Between Hylinae-Phyllomedusinae | 1>2 | 1>2 | 1<2 | 1>2 | |
| Between Hylidae-Centrolenidae | 1>2 | NS | 1<2 | NS |
The genetic diversity between the different genera within the subfamily Hylinae was significantly higher than that estimated between the subfamilies Hylinae and Phyllomedusinae. A similar result was found when the genetic diversity within the subfamily Hylinae was compared with that estimated between the families Hylidae and Centrolenidae.
Moreover, we found no significant difference between the genetic diversity within the genus Scinax and the genetic diversity between the families Hylidae and Centrolenidae. However, this pattern could be due to saturation effects.
3.2 Combined analysis of nuclear datasets
The incongruence test did not detect significant heterogeneity between the two nuclear datasets and no saturation was observed for the transition and transversion substitution patterns (Fig. 2B, D, F). Of the 1590 positions, 221 were informative (gaps were treated as missing for the unweighted parsimony analysis). We found 192 equiparsimonious tree (623 steps). The g1 value was −0.68, the CI was equal to 0.594, the RI was equal to 0.797.
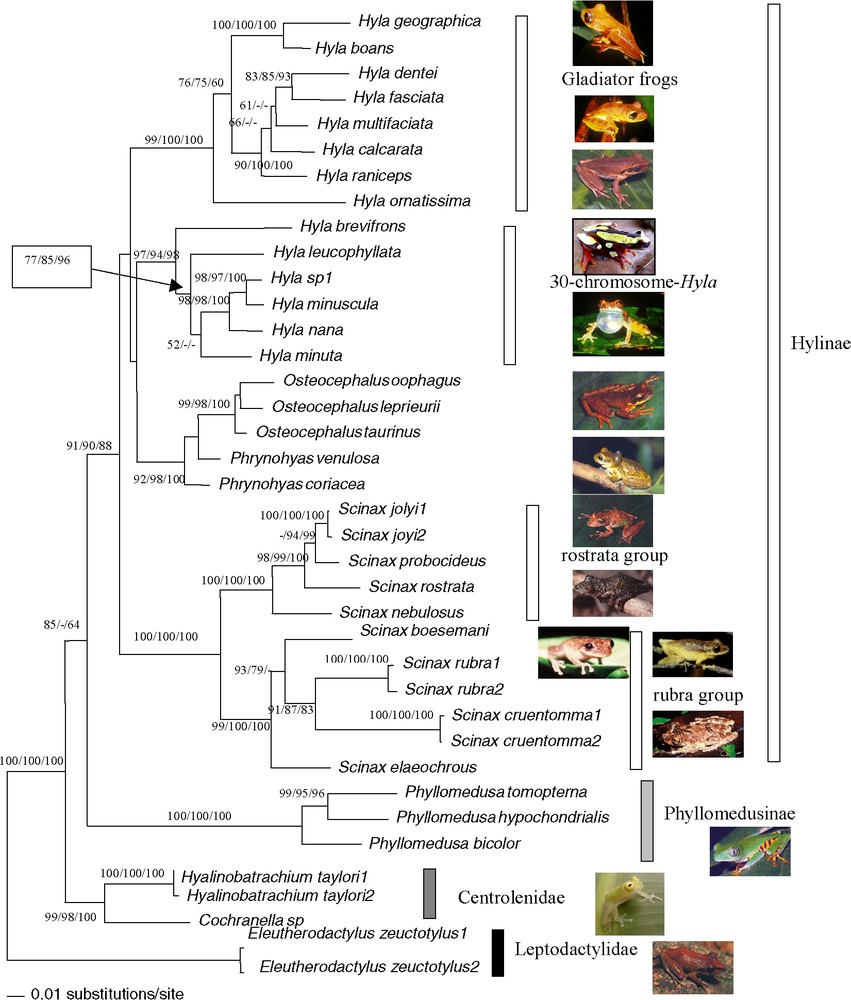
Considering the Eleutherodactylus species as outgroup, we observed the homophyly of the Centrolenidae (BP = 99/97/99) (Fig. 4). Moreover, these species were sister groups to the Hylidae, which constituted a homophyletic group (BP = 79/–/69). Within French Guiana Hylidae, we observed that the genus Phyllomedusa (Phyllomedusinae) was the sister group to the subfamily Hylinae (BP = 78/92/93). Within the Hylinae, the genus Scinax was homophyletic (BP = 100/100/100). The rostrata species groups constituted by Scinax jolyi, Scinax proboscideus, Scinax rostrata and Scinax nebulosa (BP = 100/100/100) and the rubra species group (BP = 61/58/–) were supported.
Bootstrap analyses carried out with 1000 iterations using the 1590 pb of the tyrosinase and 18S rDNA among 38 ‘species’ of Hyla, Osteocephalus, Scinax, Phrynohyas, Phyllomedusa, Cochranella and Hyalinobatrachium genera: Maximum-Likelihood using bootstrap value on the left, Maximum-Parsimony bootstrap value on the middle, Neighbour-Joining on a matrix of the Tamura–Nei (alpha = 0.21) model right bootstrap value. The Maximum-Likelihood tree is shown (−ln=5853.9177). The tree was rooted on Eleutherodactylus as outgroup. The arrow indicated the incongruence for one node between the Maximum-Likelihood tree and the three bootstrapped trees (ML, MP, NJ).
The paraphyly of genus Hyla was supported by ML, MP, and NJ methods (BP = 52/56/55), due to the relationship between the homophyletic group constituted by Osteocephalus and Phrynohyas species and the Hyla 30-chromosome group bp = 97/94/99). The homophyly of the two groups of Hyla was confirmed by the ‘nuclear total evidence’ approach (BP = 95/88/97 for the 30-chromosome Hyla and bp = 90/93/99 for the Gladiator frogs. Paraphyly of the H. geographica species group and the nana species group are confirmed. For the second group, this paraphyly is not supported.
3.2.1 Genetic diversity of the Tyrosinase and 18S rDNA genes
According to the Tamura–Nei distance with alpha = 0.21 (Table 4), the variability between the different genera of Hylidae ranged from to . The genetic divergence between the Centrolenidae (Hyalinobatrachium and Cochranella) and the Hylidae ranged from with Phrynohyas to with Phyllomedusa. The genus Scinax displayed a within group average of (data not shown) and the genus Hyla yielded an average of . Genetic diversity within the two groups of Hyla was respectively for 30-chromosome Hyla, and for Gladiator frogs. The genetic diversity between the two groups was and the variability between the two groups of Scinax was equal to . By comparison, the genetic diversity between Osteocephalus and Phrynohyas is only .
Between group average using the Tamura–Nei (alpha parameter for the gamma shape equal to 0.21) for the seven genera standard errors estimated by bootstrap method 1000 replications for the 18S and Tyrosinase nuclear DNA (1590 pb)
| 1 | 2 | 3 | 4 | 5 | 6 | 7 | |
| [1] Hyla | 0.004 | 0.003 | 0.006 | 0.005 | 0.008 | 0.008 | |
| [2] Phrynohyas | 0.032 | 0.003 | 0.006 | 0.005 | 0.010 | 0.008 | |
| [3] Osteocephalus | 0.032 | 0.014 | 0.006 | 0.005 | 0.010 | 0.009 | |
| [4] Centrolenidae | 0.049 | 0.045 | 0.046 | 0.007 | 0.009 | 0.006 | |
| [5] Scinax | 0.051 | 0.042 | 0.039 | 0.058 | 0.009 | 0.009 | |
| [6] Phyllomedusa | 0.079 | 0.083 | 0.085 | 0.080 | 0.089 | 0.011 | |
| [7] Eleutherodactylus | 0.066 | 0.063 | 0.066 | 0.055 | 0.073 | 0.091 |
Pairwise comparison showed that genetic diversity was significantly higher between the two different subfamilies Hylidae (Hylinae and Phyllomedusinae) than between the families Hylidae and Centrolenidae, which is another incongruence between morphology and molecular data (Table 5).
3.3 Combined analysis of total datasets (nuclear and mitochondrial)
The incongruence test did not detect significant heterogeneity between the two partition (mitochondrial versus nuclear ) and weak saturation was observed for the mitochondrial versus nuclear substitution patterns (Fig. 2G–I). Of the 2403 positions, 615 were informative (gaps were treated as missing for the unweighted parsimony analysis). We found one single parsimonious tree (2674 steps). The g1 value was –0.79, the CI was equal to 0.430, and RI was equal to 0.662.
Combined nuclear and mitochondrial analysis confirmed the previous results: paraphyly of the genus Hyla and the relationship between Phrynohyas and Osteocephalus with the Hyla 30 chromosomes group (Fig. 5). The genus Scinax was the sister group to Hyla plus Osteocephalus plus Phrynohyas; however, this topology was not supported. The Phyllomedusinae was the sister group to the Hylinae (55/90/88).
Bootstrap analyses carried out with 1000 iterations using the 2403 pb of the mitochondrial and nuclear genes among 38 ‘species’ of Hyla, Osteocephalus, Scinax, Phrynohyas, Phyllomedusa, Cochranella and Hyalinobatrachium genera: Maximum-Likelihood using bootstrap value on the left, Maximum-Parsimony bootstrap value on the middle, Neighbour-Joining on a matrix of the Tamura–Nei (alpha = 0.25) model right bootstrap value. The Maximum-Likelihood tree is shown (−ln=15 785.73299). The tree was rooted on Eleutherodactylus as outgroup.
4 Discussion
4.1 The genus Hyla
Our results confirmed that two major groups constitute the paraphyletic genus Hyla in French Guiana. The first group is constituted by H. brevifrons, H. leucophyllata, H. nana, H. minuta, H. sp1 and H. minuscula and the second group by H. boans, H. fasciata, H. calcarata, H. dentei, H. geographica, H. raniceps, H. multifaciata and H. ornatissima. These species represent the 30-chromosome Hyla group [9] and the second one the Gladiator frogs, respectively groups [26]. The paraphyly of the genus Hyla confirmed herein underlines the necessity to reconsider the taxonomy of one of these group.
We detected incongruence between the mitochondrial and the nuclear gene trees. Indeed, the genera Osteocephalus and Phrynohyas clustered with the genus Hyla on the nuclear gene tree. This pattern was different considering the mitochondrial gene tree but the bootstrap values are too low and thus might be due to saturation and homoplasy on mitochondrial data. These nuclear gene results were in agreement with the tree constructed on the basis of morphology by Da Silva [27], which revealed two groups in the paraphyletic genus Hyla. The first group was polyphyletic according to the analysis by Da Silva (Hyla + Phyllodytes + Xenohyla) and the node for the second group was not supported by the synapomorphy of this group, i.e., shape of the first distal prepollex nearly cylindrical (CI = 0.033); four elements anterior to the distal prehallux (CI = 0.088). However, our results add information on the phylogenetic relationships between ‘Gladiator frogs’, Scinax, Hyla 30 chromosomes and Osteocephalus + Phrynohyas.
We found that the clustering of H. sp1 with H. minuscula (with 3% divergence) is in agreement with their acoustic signals [19]. A more accurate phylogenetic analysis coupling systematics and phylogeography of these particular groups needs to be done, as for the H. leucophyllata complex [9].
4.2 The genus Scinax
The molecular homophyly [64] of Scinax was supported by high bootstrap proportions, whatever the molecular marker used. The molecular results were in agreement with the morphological results based on a single shared derived trait, i.e., the absence of, or reduced webbing between toes I and II in adults [65] and on ten synapomorphies [29].
The phylogenetic reconstruction indicated that the rubra group (S. rubra, S. cruentomma, S. boesemani, S. elaeochroa) and the rostrata group (S. jolyi, S. proboscideus, S. rostrata and S. nebulosa) are respectively homophyletic. This result is in contradiction with the morphological cladistic analysis made by Faivovich [29] in which the author stated the nesting of the rostrata group within the rubra species group. Hierarchical positions of the species of the rubra group are also incongruent with the topology proposed by Faivovich. However this could be due to taxa sampling. According to the Tamura–Nei distance, genetic variation within Scinax was for the total mitochondrial DNA alignment. A previous study based on the partial 16S [28] displayed a genetic variation within Scinax to . Our results indicate a higher degree of genetic diversity (whatever the distance and the marker used) within a restricted sample of Scinax than other studies [66]. Indeed, Kosuch et al. [67] found 8 to 10% of genetic divergence in the 16S rDNA gene among the different species (African + Asian species) belonging to the genus Hoplobatrachus and 11% between the Asian species Rana gracilis and the African species R. lepus. This analysis of the genetic divergence should be considered in light of:
- (1) the varied pattern of substitutions along the 16S rDNA molecule that could result in over or under-estimation of genetic distances depending on the portion of the gene studied, and
- (2) the homogeneity/heterogeneity of this pattern of substitutions between the lineages.
4.3 Molecular vs morphological taxonomic levels
In the case of congruence between morphological and molecular data, it is clear that the genetic diversity within lower taxonomic levels will be lower than that within higher taxonomic levels. Nevertheless, Hylidae and Hylinae are supported as homophyletic with respect to the positions of Centrolenidae and Pyllomedusinae. These families and sub families level are thus corroborated. The mitochondrial unresolved pattern is certainly biased because of strong saturation and homoplasy. The heterogenity in branch length and distances between Centrolenidae, Hylinae and Phyllomedusinae for mitochondrial and nuclear data (no significant differences between the genetic distances of the two families Hylidae and Centrolenidae and the genus Scinax) is certainly due to heterogeneous rate of molecular evolution.
Our results (Table 5) clearly show that the phylogenetic signals based on mitochondrial genes and nuclear genes are not congruent. This incongruence could be due to the saturation effect. The mitochondrial genes displayed two patterns:
- (1) the first was observed at the family level, as some Hylinae species (Osteocephalus and Phrynohyas) clustered with the subfamily Phyllomedusinae (with no support).
- (2) The second pattern was due to the homophyletic genus Scinax (considering the two species groups present in French Guiana), which displayed similar degree of genetic diversity than the genus Hyla, which was paraphyletic according to total evidence analysis.
This extreme difference in mitochondrial and nuclear diversity may be the result of numerous phenomena, as listed by Avise [68]. It seems therefore obvious that the genus Scinax represents a genus of a long evolutionary history, given that the sampling effort was identical for the two genera in this region.
5 Conclusion
Strategies for the protection of biological diversity require the identification of areas that shelter the highest species and genetic diversity, and maximal protection of contiguous environmental gradients within these areas [69]. It will be very difficult to protect neotropical frogs efficiently, if only a few clades have been validated using molecular markers. A recent study using molecular markers [42] revealed evidence of striking convergences in larval and adult traits for the Madagascan and Asian Ranidae. The level of homoplasy in morphological, ecological and physiological data for the Neobatrachia is still underestimated and amphibian systematic is largely still based on morphological traits. These lead to an underestimation of the biodiversity within amphibians. Moreover, it is very important to use both mitochondrial and nuclear markers to avoid incongruence between gene trees and species trees in molecular phylogenetic reconstructions.
Indeed, the level of genetic diversity between genera within the same subfamily can vary considerably. For example, the genera Scinax and Hyla displayed a mitochondrial genetic diversity of and , whereas Osteocephalus and Phrynohyas yielded a value of . This can be interpreted in two ways: the genera Scinax and Hyla must be split into more than one genus (due to the high genetic distance), or the genera Osteocephalus and Phrynohyas must be merged into only one genus (due to the small genetic distance). Considering the phylogenetic relationships within the Hylidae, i.e., homophyly of Scinax, paraphyly of Hyla, and the nuclear genetic diversity, the first hypothesis seems more likely.
The species identified on the basis of morphology could be an indicator of species richness but certainly underestimate the real number of specific entity especially in the tropics [11]. Another approach, DNA bar-coding, was recently proposed by Hebert [70]. This methodology use large scale screening of one or a few reference genes in order to assign unknown individuals to species and thereby could enhance discovery of new species. However, some authors raise doubts about the contribution of this approach [71]. For example, problems may arise in groups of frequent hybridisation and recent radiations. The real challenge lies with tropical taxa and those with limited dispersal and thus substantial phylogeographic structure [71].
Considering our results, the fact that a complete inventory of amphibians in French Guiana is currently impractical and the fact that populations are declining in many parts of the world, we recommend that species richness should be initially assessed on the basis of morphology, systematically coupled with a study of molecular genetic diversity (nuclear and mitochondrial gene sequences). The higher taxonomic diversity must be coupled to phylogenetic diversity for the conservation: “all genera (based on morphology) are equal but some genera are more equal than others (based on molecular).” This approach will avoid major biases in the estimation of the biodiversity in neotropical regions, therefore providing an important conservation tool.
Acknowledgements
We are grateful to Jean-François Martin, Anne Miquelis and Nicolas Pech for useful comments on the manuscript, and Michel Blanc for the Cochranella species and H. boans. This work was supported by a grant from the French ‘Ministère de l’Écologie et du Développement durable'. The manuscript was revised by Alex Edelman & associates.