

1 Introduction
Multiple sclerosis (MS) is one of the most common chronic and disabling disorders of the central nervous system (CNS). The disease affects about 0.1% of the population in temperate climates [1] and shows a striking female predominance (∼1.6:1) [2]. Its clinical manifestations typically appear in young adulthood between the ages of 20 and 40. Although these clinical manifestations may be variable and unpredictable, the most common symptoms include chronic or relapsing paralysis, visual and sensory impairment, and problems of strength and coordination [3,4].
A central event in the pathogenesis of MS is the degradation of myelin. Myelin is a fatty material that surrounds the axons allowing the nerve cell to transmit its action potentials rapidly. The myelin in the CNS is produced by oligodendrocytes (OLGs).
The plasma membrane of eukaryotic cells was once believed to be a lipid sea in which lipids and proteins could diffuse freely. However, even though the cell membrane is a two-dimensional, liquid-like structure, it is far from being a homogeneous mixture of lipids and proteins [5–8]. Rather it is a non-ideal liquid mixture of molecules, with variable degrees of mutual miscibility [9]. As a consequence, the cell membrane contains a variety of molecular complexes and domains, characterized by different composition and spatial arrangement of the membrane-constituting lipids. One of the structures found in the plasma membrane of many eukaryotic cells are caveolae. Caveolae are small (50–100 nm) flask-shaped invaginations of the plasma membrane that are involved in cholesterol homeostasis, vesicular trafficking and signal transduction [10,11]. They are enriched in glycosphingolipids (GSLs), cholesterol and in the protein caveolin. A second class of membrane inhomogeneities, found by biochemical methods, are the so-called lipid rafts, which are enriched in cholesterol and saturated lipids, such as GSLs and sphingomyelin. Lipid rafts range from tens of nanometres to several micrometers in size and are thought to be involved in a variety of dynamic processes, such as protein and lipid sorting, signal transduction and pathogen entry [12–15]. In the literature, lipid rafts are also known as detergent-insoluble membranes, detergent-resistant membranes, GSL-enriched membranes, detergent-insoluble glycolipid-rich membranes, and Triton-insoluble floating fractions [16]. Based on detergent extractions, several myelin proteins have been identified in lipid rafts [17–22]. A third type of membrane inhomogeneity, derived from single-particle tracking, is the confined diffusion of membrane components within the so-called corrals. These membrane compartments are made up by the membrane-associated actin cytoskeleton (fences) and by rows of transmembrane proteins anchored to it (pickets) [9]. The size of the membrane compartments or corrals ranges between 30 and 250 nm and the residency time within a compartment varies from 1 ms to 1 s. Both characteristics depend on the cell type and the molecule under study [9].
The aim of this study is to investigate the membrane organization of living OLGs. Fluorescence correlation spectroscopy (FCS) can be used to monitor the lateral diffusion of raft and non-raft components [23] and is applied here on the oligodendroglial cell line OLN-93 using fluorescently labelled sphingomyelin (Bodipy FL-C5 SM) and the MOG–EGFP fusion protein (Fig. 1).
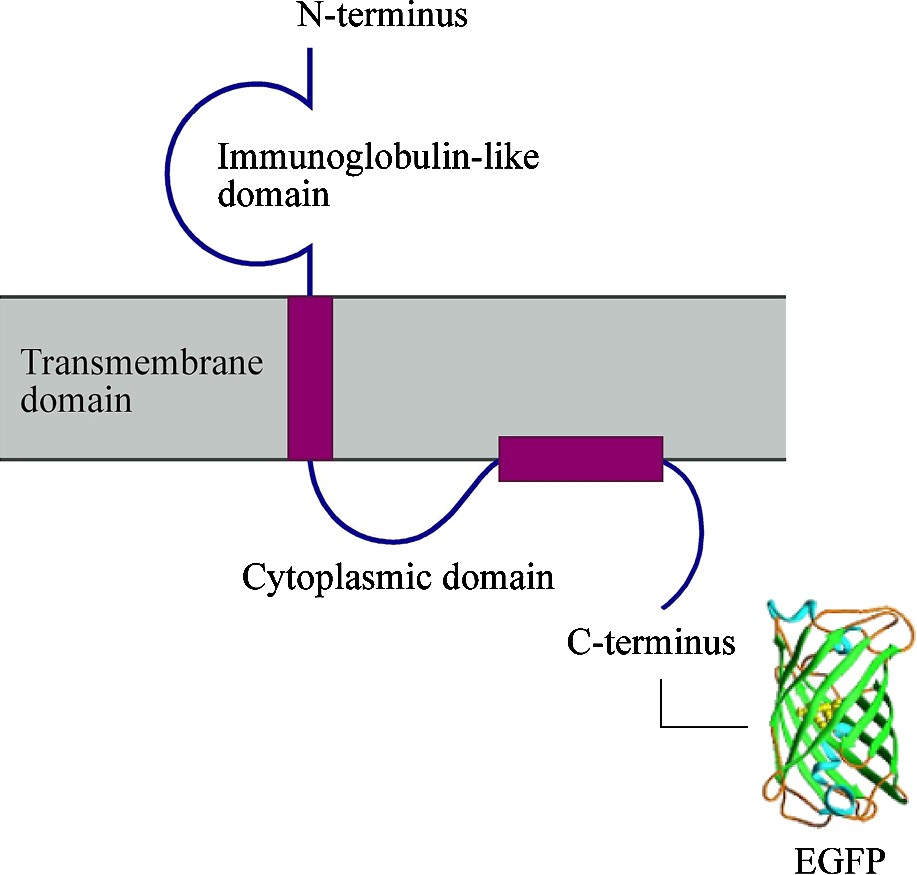
Schematic representation of the MOG–EGFP structure and organization in the myelin membrane. EGFP is linked to the C-terminus of MOG. EGFP not drawn to scale.
2 Materials and methods
2.1 Chemicals and solutions
Bodipy FL-C5 SM was obtained from Molecular Probes, Inc. (Eugene, OR, USA). The complete cDNA of MOG was PCR-cloned into the eukaryotic expression vector pEGFP-N1 (BD Biosciences Clontech, Palo Alto, CA, USA). The Ringer solution contained (in mM): 145 NaCl, 5.4 KCl, 1.8 MgCl2, 20 HEPES, 25 glucose; pH was adjusted to 7.4 with Tris at room temperature (osmolality ∼320 mOsm/kg H2O).
2.2 Cell culture and sample preparation
OLN-93 cells (oligodendroglioma derived from primary rat brain glial cultures) were kindly provided by Dr Richter-Landsberg, Oldenburg, Germany [24]. The cells (Fig. 2A) were grown in 8-well glass LabTek chambers (Nalge Nunc Intl., Rochester, NY, USA) in a growth medium (GM) containing Dulbecco's modified Eagle medium (DMEM; Ref: 41965-039 Gibco, Invitrogen, Carlsbad, CA, USA) supplemented with 10% foetal clone serum (FCS), 50 U/ml penicillin and 50 μg/ml streptomycin (Life Sciences, Carlsbad, CA) in a humidified 10% CO2 incubator at 37 °C. Cells were either transiently transfected with the pMOG–EGFP construct by means of lipofection (1.2 μg DNA and 1.5 μl LF2000R in 200 μl Optimem) (Fig. 2B and C) or labelled with Bodipy FL-C5 SM (1.6 μM in Ringer 5 min at room temperature) (Fig. 2D and E). For cholesterol depletion, measurements were performed in the continuous presence of 5 mM methyl-β-cyclodextrin (mβCD; Fluka, Sigma-Aldrich NV/SA, Bornem, Belgium).
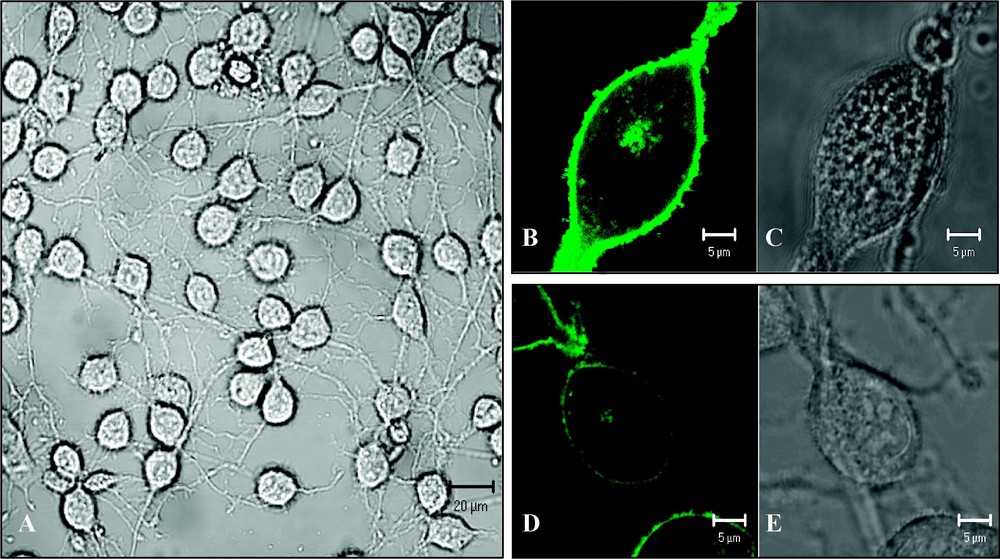
(A) Transmission image of OLN-93 cells (scale bar 20 μm); (B–C) OLN-93 cell expressing MOG–EGFP (scale bar 5 μm): (B) fluorescence image, (C) transmission image. (D–E) OLN-93 cell labelled with Bodipy FL-C5 sphingomyelin (scale bar 5 μm): (D) fluorescence image; (E) transmission image. Images were taken with a Zeiss LSM 510 META confocal laser scanning microscope.
2.3 Confocal imaging and FCS
FCS and confocal microscopy optical sectioning were carried out with a Zeiss Confocor 2 with a 40×, NA 1.2 water immersion objective and a Zeiss LSM 510 META confocal laser scanning microscope using a Plan Neo Fluar 40×, NA 1.3 oil immersion objective. Samples were excited with a 488-nm Ar ion laser at low average laser power at the sample position, ∼5 μW, to prevent photobleaching as much as possible [25]. A total of 10 correlation curves of 15 s each were collected on a single cell using a BP 505–530-nm emission filter. Correction for autofluorescence was not necessary. The traces were immediately analysed with the Confocor 2 FCS software for validity. For MOG–EGFP, a pre-bleaching illumination period of 5 s was used prior to data collection. All measurements were performed at the membrane facing the glass bottom of the chamber since the top membrane (i.e. facing the bathing solution) suffered from severe fluctuations in the z-direction. Each day the excitation volume calibration was carried out with a Rhodamine 6G solution. The structure parameter S (, where and are the axial and lateral parameters of the Gaussian detection volume, respectively) was between 4.6 and 7.7. The experiments were performed at room temperature to reduce the mobility of the cells.
A homemade macro in Origin (OriginLab Corp., Northhampton, MA, USA), allowing to pool various autocorrelation functions (ACFs) in a weighted sum [26], was used to analyse the data. Except for the first curve of each set, which was not taken into account because of bleaching effects, all remaining ACFs were pooled in a single analysis. The data were analyzed for 2D-diffusion according to Eq. (1):
| (1) |
3 Results
3.1 Bodipy FL-C5 SM
In the case of Bodipy FL-C5 SM, a total of 17 cells were sampled. As can be concluded from Fig. 2D, the majority of the signal comes from Bodipy FL-C5 SM, which has been incorporated into the plasma membrane. However, it has to be noted that SM is internalized over time as can be concluded from the fluorescence found in the Golgi.
The 2D1C free diffusion and 2D1Cα anomalous diffusion fits are shown in Fig. 3A and B, respectively. As can be concluded from the residuals versus time plots, both models yield rather low-quality fits. The only model that fits the data well is 2D2C (Fig. 3C). The obtained parameter values are shown in Table 1. The calculated ACF without triplet contribution is depicted in Fig. 4. The fast-diffusing fraction is on the order of 10% (). The majority of the molecules (∼90%) have a much smaller diffusion coefficient (). Measurements on different cell batches (different passage numbers) yield fairly reproducible results (Table 1 and Fig. 4).
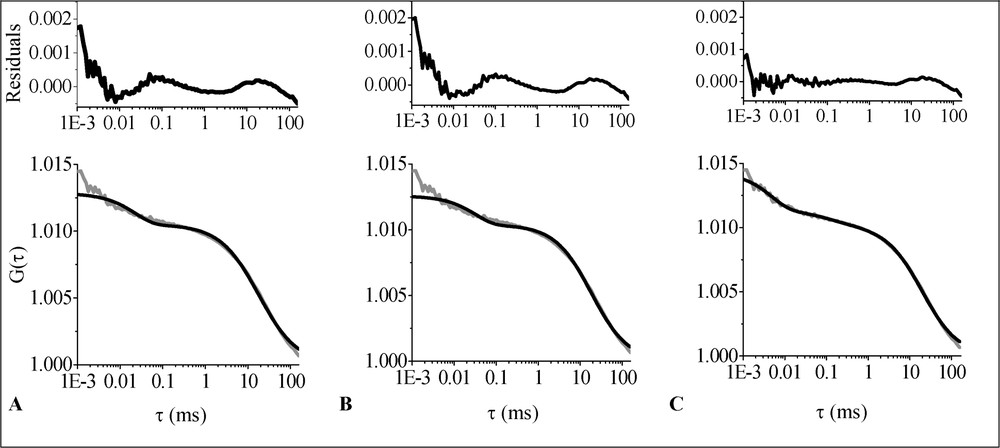
Average ACF (grey line) corresponding to the diffusion of Bodipy FL-C5 SM in the plasma membrane of living OLN-93 cells fitted with different models (black lines): (A) 2D1C; (B) 2D1Cα; (C) 2D2C. The upper part of the figure shows the residuals versus time plots.
Diffusion characteristics of Bodipy FL-C5 SM in the plasma membrane of living OLN-93 cells⁎
| Passage No. | n | Treatment | (%) | (μm2 s−1) | (μm2 s−1) |
| 4 | 17 | – | 8.2 ± 0.7 | 0.368 ± 0.004 | 69 ± 15 |
| 6 | 5 | – | 87.7 ± 1.1 | 0.383 ± 0.005 | 102 ± 30 |
| 6 | 11 | 5 mM mβCD | 68.4 ± 0.8 | 0.490 ± 0.007 | 157 ± 17 |
⁎ Uncertainties are reported as standard deviation.
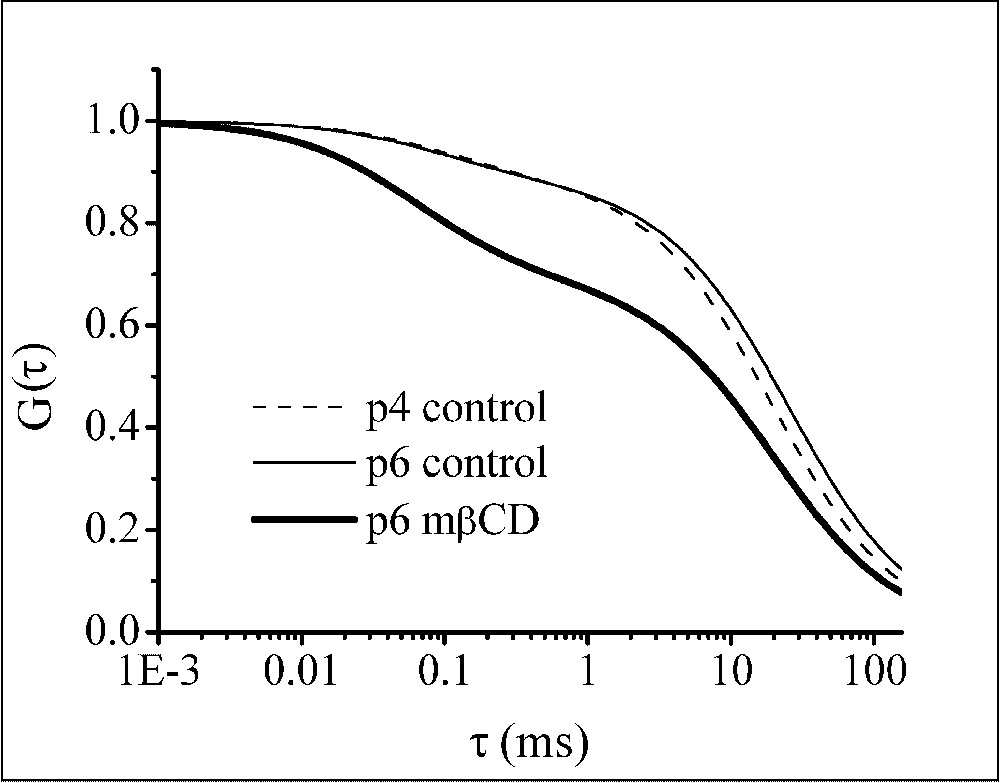
Normalized ACF calculated without taking into account the triplet contribution and using the parameter values shown in Table 1. Data correspond to the diffusion of Bodipy FL-C5 SM in the plasma membrane of living OLN-93 cells. Control measurements were performed on different cell passages, p4 (- - -) and p6 (—). Measurements in the continuous presence of 5 mM mβCD (—) were performed on cells of passage 6.
To elucidate the involvement of cholesterol, the effect of the presence of the cholesterol removing agent mβCD was investigated on 11 cells. Also, in this case, the best fits were obtained with the 2D2C model (data not shown). Cholesterol depletion resulted in a decrease of the fraction of the slowly moving component (Table 1) and in a clearly different ACF (Fig. 4).
3.2 MOG–EGFP
Fig. 2B shows that OLN-93 cells transfected with the pMOG–EGFP construct indeed are capable of producing the fusion protein. Furthermore, the clear delineation of the cells indicates that MOG–EGFP is incorporated into the plasma membrane. Even though the Golgi and the cytosol of OLN-93 cells expressing MOG–EGFP contain fusion proteins, the vast majority of the signal is attributed to MOG–EGFP incorporated in the plasma membrane (Fig. 2B).
The analysis was performed on the data obtained for nine cells. The 2D1C free diffusion fit is shown in Fig. 5A. As can be concluded from the residuals versus time curve, this model is not appropriate. 2D1Cα and 2D2C, respectively shown in Fig. 5B and C, give fits of similar quality. Parameter values are listed in Table 2. The anomaly parameter found for MOG–EGFP is .
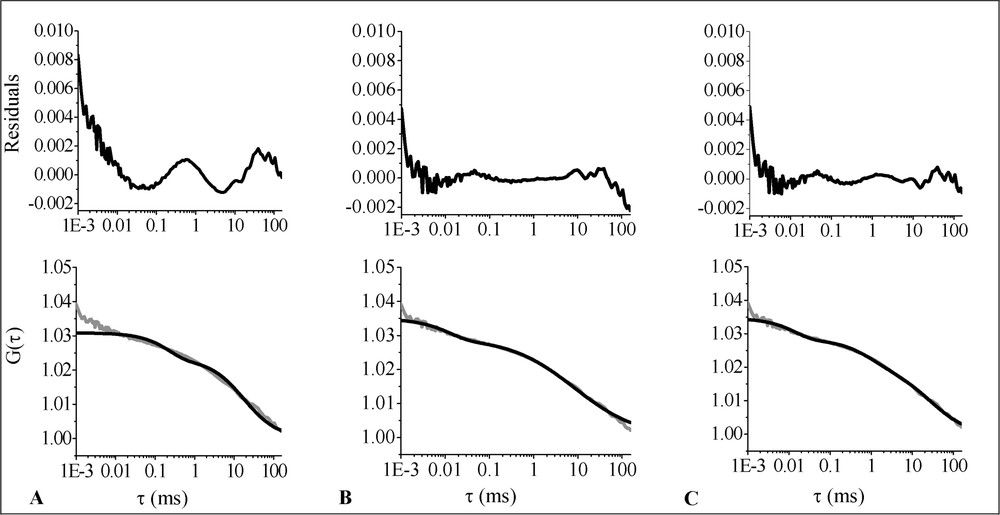
Average ACF (grey line) corresponding to the diffusion of MOG–EGFP in the plasma membrane of living OLN-93 cells fitted with different models (black lines): (A) 2D1C; (B) 2D1Cα; (C) 2D2C. The upper part of the figure shows the residuals-versus-time plots.
Diffusion characteristics of MOG-EGFP in the plasma membrane of living OLN-93 cells⁎
| Model | (%) | (μm2 s−1) | (μm2 s−1) | α | (μs) | T (%) |
| 2D1Cα | 100 | 2.24 ± 0.06 | na | 0.59±0.01 | 12.8±0.1 | 16.4±0.7 |
| 2D2C | 62±1 | 0.24 ± 0.01 | 7.7±0.5 | na | 14.1±1.0 | 18.2±0.5 |
⁎ Uncertainties are reported as standard deviation.
4 Discussion and conclusions
For the lipid case, the best fits were obtained with 2D2C. The majority of the SM molecules diffuse slowly in the plasma membrane and the corresponding diffusion coefficient is in the same order of magnitude as those reported by others for lipid probes in biological membranes [23,28]. Only 10% has a very large diffusion coefficient of about 69 μm2 s−1. This fraction not only increases after depletion of cholesterol with mβCD, its diffusion coefficient even doubles. However, at this point it is not clear what the origin of the fast diffusing fraction is. Such high-diffusion coefficients for lipids in the plasma membrane have not been reported yet. It might well be that this fraction represents dye in solution. MβCD may not only extract cholesterol from the membrane, but also the fluorescently labelled sphingomyelin [29]. If this is indeed the case, the fast diffusing fraction, which only corresponds to the minority of the monitored molecules, would correspond with the mβCD-Bodipy FL-C5 SM complexes in the Ringer solution. The high value of the diffusion coefficient for the minor fraction, 69 ± 15 μm2 s−1, compares well with the value obtained for bovine serum albumin (67 kDa) in buffer at 25 °C, i.e. 58 ± 5 μm2 s−1 [30]. This may suggest that the high values of the diffusion coefficient might be due to freely diffusing complexes of Bodipy FL-C5 SM in the bathing solution. To verify this hypothesis, the diffusion of complexes of mβCD and Bodipy FL-C5 SM in Ringer will be determined. The extraction of SM from the membrane can be avoided all together by using cholesterol oxidase instead of mβCD [28].
The diffusion coefficient of the major – slowly diffusing – fraction increases about 25% after depletion of cholesterol (from 0.36 to 0.49 μm2 s−1). This is in contrast to the results of Marguet et al. [28], who found that the diffusion coefficient of Bodipy FL-C5 SM in the plasma membrane of COS-7 cells decreases from 1.34 to 0.76 μm2 s−1 after cholesterol depletion. Marguet and co-workers did not use mβCD to deplete cholesterol, but the enzyme cholesterol oxidase instead. Nevertheless, in both cases (control and cholesterol depleted) Bodipy FL-C5 SM seems to move more slowly in the plasma membrane of OLN-93 cells. This might be due to the high cholesterol and glycosphingolipid content of cells of the oligodendroglial lineage, which may result in a substantially more rigid membrane.
In order to compare the diffusional behaviour of Bodipy FL-C5 SM with that of a putative raft marker, measurements will also be performed on cells labelled with Bodipy FL C5-ganglioside GM1.
Looking at the MOG–EGFP analysis results, 2D2C and 2D1Cα gave fits of similar quality. The parameter estimates obtained with 2D1Cα, however, have a smaller standard deviation, which may be explained by the greater generality of the anomalous diffusion model [31]. Nevertheless, it is difficult to decide just from the quality of the fits which model is more appropriate.
In case of the 2D2C analysis, a slow (0.24 ± 0.01 μm2 s−1) and a fast (7.7 ± 0.5 μm2 s−1) component is found. From the literature, several examples were reported discussing the possible origin of these components. For transmembrane epidermal growth factor receptor (EGFR)–EGFP fusion proteins in the plasma membrane of CHO (Chinese hamster ovary) cells, the diffusion coefficients were reported to be 21 ± 8 (fast component) and 0.16 ± 0.09 μm2 s−1 (slow component). In the cytoplasm these values were 24 ± 8 and 0.51 ± 0.66 μm2 s−1, and in the endoplasmic reticulum the diffusion coefficients were reported to be 12 ± 4 and 0.29 ± 0.15 μm2 s−1 [32]. Uncomplexed GFP was shown to diffuse at 20–30 μm2 s−1 in the mitochondrial matrix as well as in the cytoplasm of CHO cells [33]. The slow MOG–EGFP diffusion coefficient corresponds surprisingly well with the one reported for EGFR–EGFP in the membrane of CHO cells [32]. The fast component, which might be related to diffusion in the cytoplasm, is somewhat slower than the values reported by Brock et al. [32]. This might well be due to the fact that MOG–EGFP does not diffuse freely within the cytoplasm.
If the anomalous model is correct, we may conclude that the diffusion of MOG–EGFP in the OLN-93 plasma membrane is severely hindered (). The lateral diffusion in membranes might be influenced by obstruction, binding, hydrodynamic interactions, interactions of extracellular domains, and interactions of intracellular domains with one another and with the membrane skeleton [27]. Further insight into the abnormal diffusional behaviour of MOG–EGFP will be obtained by comparing the differences in anomalicity obtained under various conditions, e.g., depletion of cholesterol and disruption of the actin cytoskeleton with latrunculin A.
Acknowledgements
We thank Prof. Dr C. Richter-Landsberg for the generous gift of the OLN-93 cells. This work has been supported by the Research Council of the Hasselt University and tUL, the K.U. Leuven (GOA) and a bilateral project between Flanders and the Czech Republic.