

1 Introduction
Patlak's analysis and compartmental analysis are considered as gold-standards for assessing the 18F-FDG uptake rate constant in tumours, hence tumour glucose metabolism [1–4]. However, these methods are invasive and cumbersome, as they require a serial arterial blood sampling, and a dynamic data acquisition for about one hour after tracer injection. Alternative simplified kinetic analyses have been proposed to reduce invasiveness of blood sampling by using a single venous sample or by using data from left ventricle or aorta blood appearing in images [5,6]. In comparison with these quantitative dynamic approaches, the semiquantitative SUV index is currently used in clinical practice, since it can be directly provided by static PET images [7]. Nevertheless, it has been shown that the SUV suffered from several shortcomings which are mainly [8,9]: (i) the injected dose/weight ratio is only a surrogate for the available tracer dose to the tumour; (ii) both the trapped and unmetabolized tracer are taken into account; (iii) the time duration between injection and data static acquisition affects the SUV. The aim of the present work was to reduce the SUV variability related to the injection-acquisition time delay. A recently published two-compartment model [10] has been further developed to compute the SUV at one hour after 18F-FDG injection, i.e. to normalize the SUV to 1 h, from the SUV obtained at an arbitrary PET static examination start.
2 Methods
2.1 SUV normalization
Assuming 18F-FDG is trapped in an irreversible manner, a two-compartment model has recently allowed us to derive the time–activity curve (TAC) of trapped tracer in a tumour [10]:
| (1) |
| (2) |
| (3) |
| (4) |
| (5) |
Let us now consider the SUV at time t, which is defined as:
| (6) |
| (7) |
2.2 Patients and data acquisition
The investigation conforms with the principles outlined in the Declaration of Helsinki. An institutional ethics committee has approved the study and informed consent was obtained, after the procedure has been explained, from all of the subjects. A total of 14 patients (three females, eleven males) were included in this study. Table 1 presents patients' ages, weights, and heights. No patient suffered from known impaired renal or hepatic function. All patients presented primary or metastatic cancer: lung (6 primary, 5 metastatic), head and neck (2 primary), colon (1 primary). After a 6 hour fasting, preinjection blood glucose levels averaged 96 mg/dl (±16; range 61–129 mg/dl; 129 mg/dl for patient 1 with type II diabetes). Approximately 340 MBq of 18F-FDG was injected intravenously over less than 1 min (Table 1).
Patients 4 and 6: head and neck cancer; patient 13: colon cancer; others: lung cancer; (preinjection) glycaemia; 18F-FDG injected activity (); time delay between injection and first PET acquisition (), and second PET acquisition (); time delay between the two acquisitions (); value independently optimized for each hypermetabolic lesion by targeting the SUVN1/SUVN2 ratio to a value of 1, respectively (see text)
| Patient and acquisition data | Results | |||||||||||
| Patient | No. of lesion | Age (year) | Weight (kg) | Height (cm) | Glycaemia (mg/dl) | (MBq) | (min) | (min) | (min) | SUV1/SUV2 | SUVN1/SUVN2 | (min−1) |
| 1 | 1 | 69 | 67 | 169 | 129 | 320 | 105 | 172 | 67 | 0.87 | 0.95 | 0.0212 |
| 2 | 1 | 65 | 62 | 162 | 106 | 315 | 92 | 165 | 73 | 0.84 | 0.95 | 0.0218 |
| 2 | 92 | 165 | 73 | 0.94 | 1.06 | 0.0334 | ||||||
| 3 | 1 | 40 | 56 | 160 | 90 | 298 | 94 | 150 | 56 | 0.97 | 1.08 | 0.0417 |
| 2 | 94 | 150 | 56 | 0.91 | 1.01 | 0.0269 | ||||||
| 4 | 1 | 64 | 75 | 178 | 89 | 353 | 83 | 170 | 87 | 0.91 | 1.08 | 0.0328 |
| 5 | 1 | 75 | 77 | 175 | 96 | 344 | 73 | 158 | 85 | 0.87 | 1.07 | 0.0310 |
| 6 | 1 | 50 | 78 | 172 | 113 | 441 | 56 | 155 | 99 | 0.79 | 1.10 | 0.0312 |
| 7 | 1 | 67 | 92 | 167 | 109 | 448 | 62 | 140 | 78 | 0.69 | 0.90 | 0.0197 |
| 8 | 1 | 57 | 55 | 165 | 84 | 237 | 72 | 170 | 98 | 0.84 | 1.05 | 0.0292 |
| 2 | 72 | 170 | 98 | 0.72 | 0.90 | 0.0205 | ||||||
| 9 | 1 | 68 | 54 | 164 | 97 | 280 | 72 | 150 | 78 | 0.72 | 0.88 | 0.0188 |
| 10 | 1 | 69 | 85 | 172 | 89 | 410 | 82 | 155 | 73 | 0.80 | 0.94 | 0.0212 |
| 2 | 82 | 155 | 73 | 0.76 | 0.89 | 0.0184 | ||||||
| 3 | 82 | 155 | 73 | 0.76 | 0.89 | 0.0183 | ||||||
| 11 | 1 | 61 | 60 | 178 | 61 | 312 | 125 | 175 | 50 | 0.91 | 0.96 | 0.0201 |
| 12 | 1 | 59 | 62 | 162 | 100 | 330 | 84 | 147 | 63 | 0.87 | 1.01 | 0.0263 |
| 13 | 1 | 73 | 70 | 182 | 84 | 365 | 70 | 128 | 58 | 0.86 | 1.03 | 0.0288 |
| 14 | 1 | 50 | 70 | 165 | 101 | 300 | 67 | 116 | 49 | 0.91 | 1.09 | 0.0362 |
| 2 | 70 | 116 | 46 | 0.88 | 1.04 | 0.0296 | ||||||
| 3 | 70 | 116 | 46 | 0.89 | 1.06 | 0.0320 | ||||||
| 4 | 70 | 116 | 46 | 0.88 | 1.04 | 0.0299 | ||||||
| Mean | 62 | 69 | 169 | 96 | 340 | 80 | 150 | 69 | 0.84 | 1.00 | 0.0268 | |
| SD | 10 | 12 | 7 | 16 | 60 | 16 | 20 | 17 | 0.08 | 0.07 | 0.0066 |
All 18F-FDG PET examinations were acquired on a PET-scan discovery ST (General Electric Medical System) in 3D mode, without septa, producing 47 slices over an approximately 150-mm axial field of view, and a 3-min time of acquisition per step. The imaging acquisition parameters were in-plane and axial resolution of 3.91 and 3.27 mm FWHM, respectively, in plane field of view of 600 mm, 128 ×128 pixel matrix. An image matrix of pixel was used for iterative reconstruction (FORE + OSEM; subsets: 32; iterations: 5; Gaussian filter: 5.14 mm FWHM). CT transmission scans were acquired previously to the PET scanner for attenuation correction: pitch of 1.675, slice thickness of 2.5 mm, in plane field of view of 500 mm, pixel matrix.
Patients underwent a first PET static acquisition for diagnostic purposes, involving several steps to cover a large part of the body. A second PET static acquisition was achieved at 69 min, on average, after the first (range 46–99 min), with identical acquisition parameters, but involving only one step over hypermetabolic lesions which appeared in the first one. Injection-acquisition time delays for the first (time ) and the second static acquisition (time ) are given in Table 1. For the first acquisition, the time corresponds to the acquisition of the particular step involving hypermetabolic lesions which were studied, and does not correspond to the start of the whole of the scan.
2.3 Evaluation of the SUV optimization
Maximal SUV normalized to patient's body weight was assessed over a total of 22 hypermetabolic lesions which appeared in the two static acquisitions (Xeleris station). For each hypermetabolic lesion, this SUV was assessed by investigating contiguous slices over the whole of the lesion, leading to SUV1 and SUV2 for the two acquisitions, respectively. Note that these former values were given by the manufacturer with a decay-correction. From each of these values (and taking into account the manufacturer decay-correction) 1-h-normalized SUV was also computed by using Eqs. (7) and (3) in order to get SUVN1 and SUVN2 for each lesion in each acquisition, respectively. The computation of these latter values was achieved on a Microsoft Excel sheet, and required to introduce a tri-exponential IF (Eq. (3)) [5]. The respective contribution of each IF monoexponential function (IF1, IF2, IF3) to the whole blood 18F-FDG amount which is available for the tumour, should be compared. Each available amount is given by the area under the corresponding curve, and then is equal to , at any time t after injection, respectively. From Hunter's results [5], after a bolus injection, for an injection-acquisition time delay of 55 min, the order of magnitude of the averaged relative contribution of IF1, IF2, and IF3 are 2%, 9%, and 89%, respectively. In other words, the SUV mainly depends on the third exponential function (). Consequently, four coefficients of the tri-exponential IF, namely and , were set according to Hunter's results for a tracer bolus injection, i.e. and , respectively. Then, the Excel solver program was used to target the SUVN1/SUVN2 ratio to a value of 1, by optimizing from Hunter's values of , respectively [5]. First, in order to validate the method, this procedure was carried out over the first 7 patients (9 hypermetabolic lesions), and then the optimized values of were arbitrarily applied in each of the remaining 7 patients (13 hypermetabolic lesions). Second, further optimized values of and were computed by targeting the SUVN1/SUVN2 ratio to a value of 1 over the whole lesion series. Finally, the same procedure was also independently used for each hypermetabolic lesion, to obtain optimized values of and by targeting the SUVN1/SUVN2 ratio of each hypermetabolic lesion to a value of 1, respectively.
3 Results
The validation of the method, with two sub-series of patients, is presented in Table 2: the mean SUVN1/SUVN2 ratio (±95% reliability domain; Student's t distribution) for each group was (optimized over the first subseries was ; did not change in comparison with Hunter's value) and ( arbitrarily taken equal to for each lesion), respectively, showing no significant difference between the two groups.
An optimized value of 0.0276 was found by using the Excel solver program to target the SUVN1/SUVN2 ratio to a value of 1 over the first 7 patients (9 hypermetabolic lesions). The optimization left unchanged (725). Then, the optimized value of was arbitrarily applied in each of the 13 hypermetabolic lesions of the remaining 7 patients. The mean SUVN1/SUVN2 ratio (±95% reliability domain; Student's t distribution) for each group was 1.00±0.05 and 0.96±0.04, showing no significant difference between the two subseries
| First 7 patients | Last 7 patients | ||||||
| Patient | No. of lesion | SUV1/SUV2 | SUVN1/SUVN3 | Patient | No. of lesion | SUV1/SUV2 | SUVN1/SUVN2 |
| 1 | 1 | 0.87 | 0.94 | 8 | 1 | 0.84 | 1.02 |
| 2 | 1 | 0.84 | 0.93 | 2 | 0.72 | 0.88 | |
| 2 | 0.94 | 1.04 | 9 | 1 | 0.72 | 0.86 | |
| 3 | 1 | 0.97 | 1.07 | 10 | 1 | 0.80 | 0.92 |
| 2 | 0.91 | 0.99 | 2 | 0.76 | 0.87 | ||
| 4 | 1 | 0.91 | 1.05 | 3 | 0.76 | 0.87 | |
| 5 | 1 | 0.87 | 1.04 | 11 | 1 | 0.91 | 0.95 |
| 6 | 1 | 0.79 | 1.06 | 12 | 1 | 0.87 | 0.99 |
| 7 | 1 | 0.69 | 0.87 | 13 | 1 | 0.86 | 1.01 |
| 14 | 1 | 0.91 | 1.07 | ||||
| 2 | 0.88 | 1.02 | |||||
| 3 | 0.89 | 1.04 | |||||
| 4 | 0.88 | 1.02 | |||||
| Mean | 0.86 | 1.00 | 0.83 | 0.96 | |||
| SD | 0.08 | 0.07 | 0.07 | 0.07 |
The normalization procedure over the whole series provided further optimized values of and , which were found to be 725 ( did not change in comparison with Hunter's value) and 0.0257 min−1, respectively (Table 1). As expected, the related mean SUVN1/SUVN2 ratio (±95% reliability domain; Student's t distribution) was (range 0.88–1.10; SD: 0.07), whereas, without normalization, the mean SUV1/SUV2 ratio (±95% reliability domain; Student's t distribution) was (range 0.69–0.97; SD: 0.08), indicating that the late (decay-corrected) SUV was significantly greater than the earlier one (). After optimization over the whole lesion series, no significant correlation was found between the individual SUVN1/SUVN2 ratios and any of the following parameters: injected activity, patient's age, weight, height, pre-injection blood glucose level, time delay between injection and first PET acquisition, time delay between injection and second PET acquisition, time delay between the two acquisitions. It should be noted that we additionally checked that no optimization of and was possible (with fixed and the other 4 parameters left free and the system optimized again).
When the optimization procedure was independently performed for each hypermetabolic lesion, different optimized values of were found (Table 1). The mean value (±SD) over the series was 0.0268 min−1 (±0.0066), which is slightly different from that found from the whole series. (The value for each lesion was again equal to 725.) A significant correlation was found between the SUVN1/SUVN2 ratio for each hypermetabolic lesion (penultimate column in Table 1), which was obtained with the optimized average value of 0.0257 min−1, and the value independently optimized for each hypermetabolic lesion (last column in Table 1), respectively (Fig. 1; ).
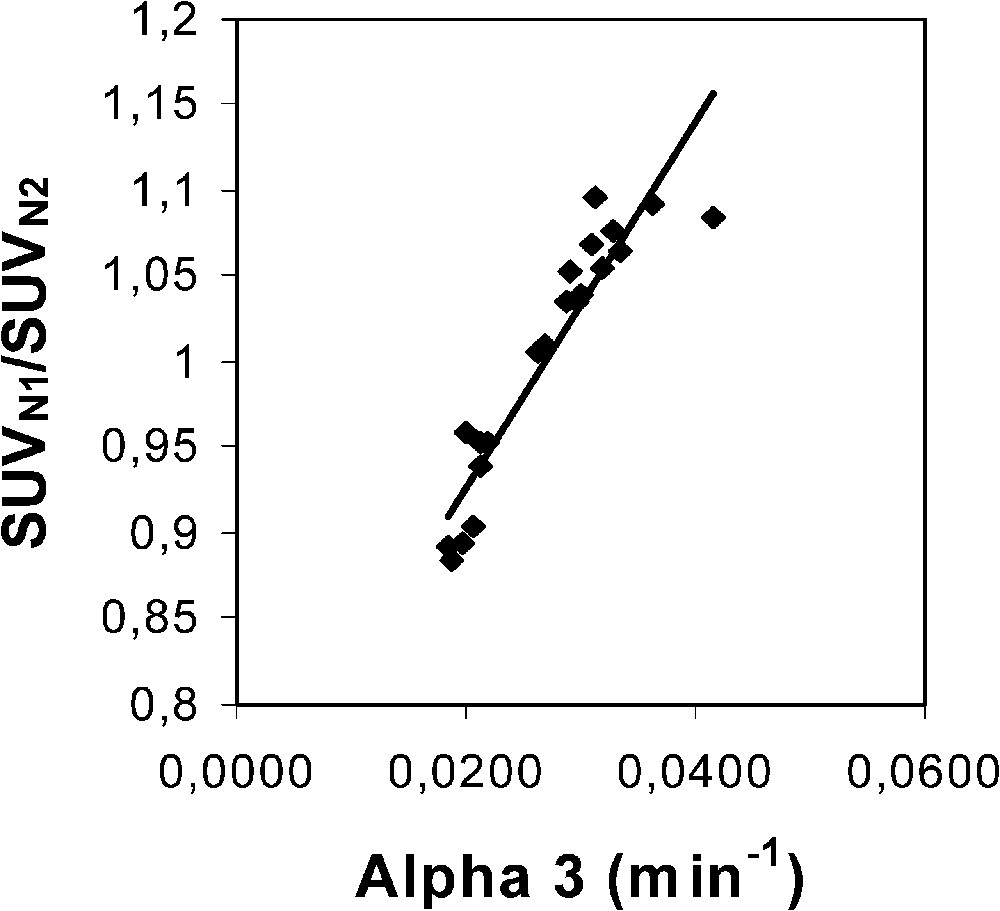
Plot of the SUVN1/SUVN2 ratio for each hypermetabolic lesion (penultimate column in Table 1), which was obtained with an optimized average value of 0.0257 min−1 over the whole lesion series, versus the values independently optimized for each hypermetabolic lesion (last column in Table 1). The optimization did not change the value in comparison with Hunter's value (725). The optimized average value was found by using the Excel solver program to target the mean SUVN1/SUVN2 ratio over the whole lesion series to a value of 1, whereas the values of the x-axis were obtained by independently targeting the SUVN1/SUVN2 ratio of each hypermetabolic lesion to a value of 1, respectively. Equation of the linear fit is: y=10.57 x+0.72 (r=0.94).
The range of the SUVN1/SUVN2 ratio indicates that the normalization is efficient with a 7% SD and a 12% maximal relative measurement uncertainty (Table 1). Assuming that the measurement uncertainty of the time is 3 min, i.e. that of a step time duration, the change in the SUVN1/SUVN2 ratio related to a ±3-min change in has been assessed for each lesion (by computing on the Excel sheet), with an optimized average value of 0.0257 min−1 (see above). This measurement uncertainty has been estimated to be 1.5% on average (range 0.5–3.0%). Moreover, Fig. 2 shows the plot of the SUVN1/SUVN2 ratio uncertainty related to a 3-min uncertainty, computed for each lesion, versus : the equation of the fit is ().
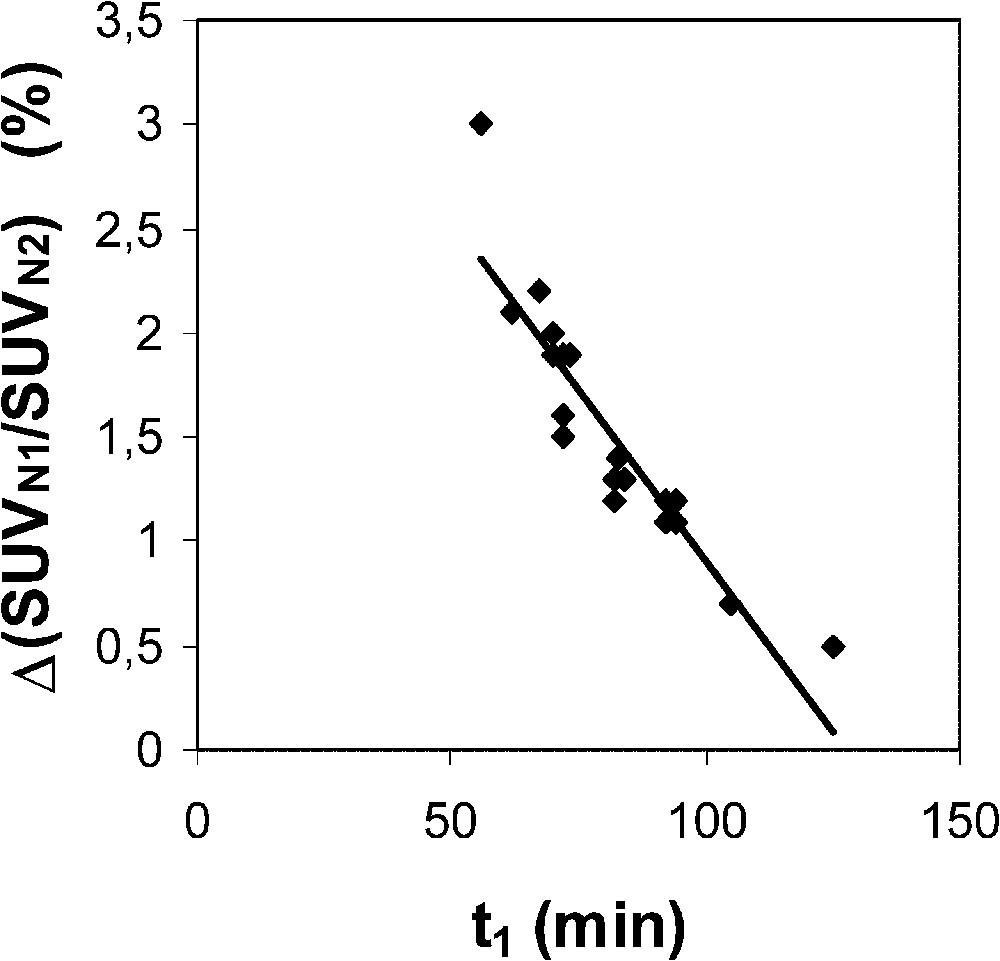
Plot of the SUVN1/SUVN2 ratio uncertainty related to a 3-min uncertainty of the time delay between injection and the first static acquisition (), computed for each lesion, versus . ( is set at 0.0257 min−1.) Equation of the linear fit is y=−0.033 x+4.182 (r=0.91).
4 Discussion
This work shows that a non invasive SUV normalization to 1 h after 18F-FDG injection is feasible, in order to significantly reduce changes in the SUV related to the injection-acquisition time-delay. Although the principle of the method would allow us to normalize the SUV to any arbitrary time (, for example), the 1-h-normalization was chosen in order to keep usual landmarks of clinical practice. Before normalization, the late SUV was always found to be greater than the early one, up to 31%, i.e. the SUV1/SUV2 ratio was significantly lower than 1. As expected after normalization, with an optimized value of 0.0257 min−1, the mean SUVN1/SUVN2 ratio was 1, with a standard deviation and a maximal relative measurement uncertainty equal to 7 and 12%, respectively.
The main part of the measurement uncertainty of the 1-h-normalized SUV is very likely related to known phenomena which influence the quantification of lesion activity [11]. Among these phenomena, in the present experiment design, it is suggested that scattered radiations, attenuation correction (in particular for lower lung lesions due to respiratory motion), and partial volume effect are responsible for the main part of the measurement uncertainty. However, the measurement uncertainty of the proposed normalization procedure is also partly related to the measurement uncertainty. A 3-min uncertainty leads to averaged and maximal changes in the ratio of 1.5 and 3%, respectively. Moreover, Fig. 2 clearly indicates that the earlier the first static acquisition, i.e. the shorter the time , the greater the measurement uncertainty in the 1-h-normalized SUV. Considering that the proposed normalization does allow us to assess the 1-h-normalized SUV from an acquisition achieved beyond 1 h after injection, it is then possible to partly lower the measurement uncertainty. In addition, it should be noted that the later the acquisition, the lower the part of the contribution of IF1 and IF2 to the whole blood 18F-FDG amount which is available for the tumour, and the more reliable is the only IF3 optimization of the proposed normalization. A third origin of the measurement uncertainty of the 1-h-normalized SUV is likely related to the variability of the time constant for the decay of the slowest blood component of the input function. This constant plays a major role in 18F-FDG uptake, which is both supported by Hunter's results [5] and the present ones. However, there is a discrepancy between Hunter's average value of and that of the present results, 0.0125 and 0.0257 min−1, respectively. Firstly, it should be noted that, to the very best of our knowledge, the 18F-FDG plasma clearance far beyond 1 h after injection has not been extensively studied. Secondly, Hunter's paper does not clearly state whether the 18F-FDG blood TACs have been corrected for the physical decay of the tracer before performing the tri-exponential fit: therefore, adding 0.0063 (= ln 2/110) to 0.0125 min−1 would lead to a value of 0.0188 min−1, which would get closer to that of the present results. Thirdly, Fig. 3 shows a comparison between two theoretical tumour TACs obtained with a tri-exponential IF involving the value by Hunter et al. and that of the present results (Eq. (3)), respectively. Simulation from Hunter's IF shows that the maximal activity in the tumour occurs at about 105 min after the tracer injection (70 min for that of the present results), that is not realistic. Finally, it should be noted that the proposed optimization affects the SUV, which involves all the tissue activity, from both trapped tracer and free tracer in blood and interstitial volumes [10] (Eq. (6)). This feature may also explain an overestimated value in comparison with that of Hunter et al., since the amount of free tracer in blood and interstitial volumes is greater at early imaging than at late imaging. Nevertheless, the major role of in 18F-FDG uptake is highlighted in the present experiments by the significant correlation (Fig. 1; ) between the SUVN1/SUVN2 ratios for each hypermetabolic lesion, which were obtained with an optimized average value of 0.0257 min−1 over the whole lesion series, and the values which were independently optimized for each hypermetabolic lesion. As a consequence, this correlation shows that the proposed non-invasive normalization procedure unavoidably involves a measurement uncertainty related to a variability.
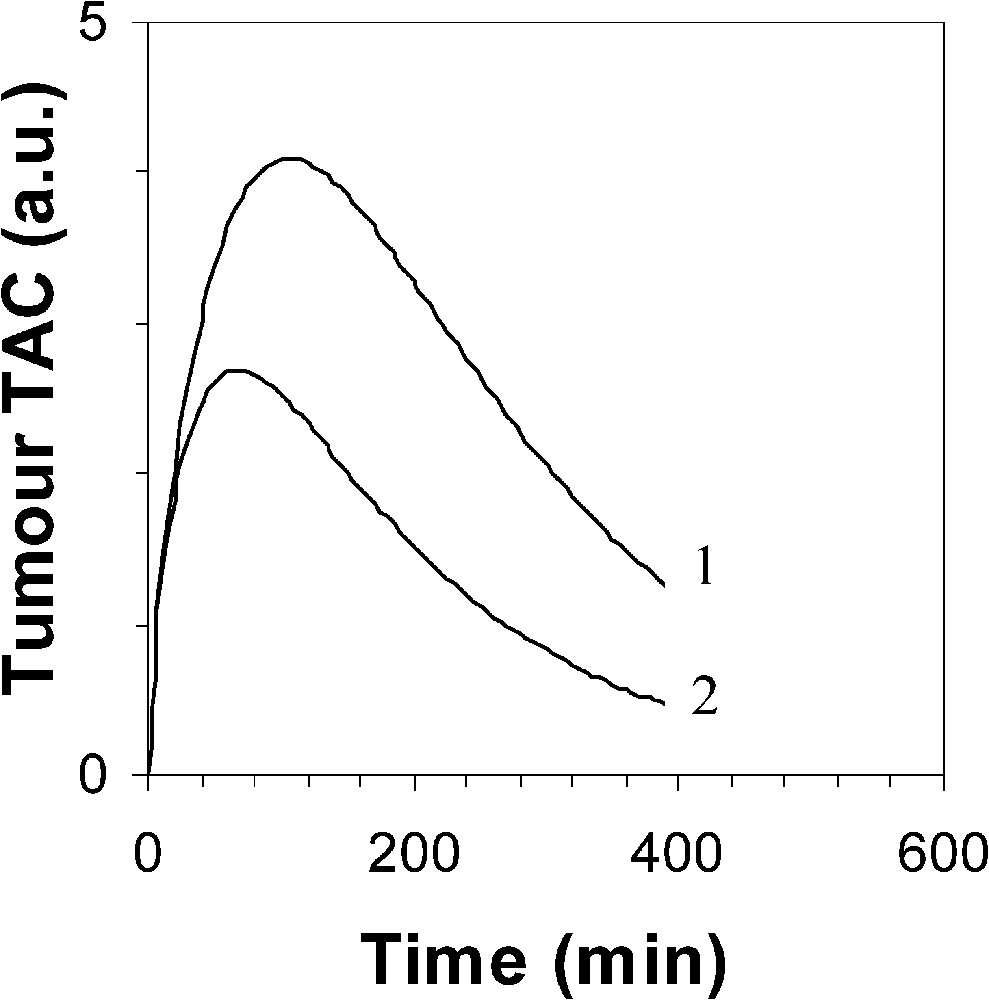
Simulated 18F-FDG tumour TAC using a tri-exponential IF (1) by Hunter et al. with , and (2) with ( value is 725 for both TAC).
In conclusion, a non invasive SUV normalization to 1 h after 18F-FDG injection is feasible, which could allow the physician to plan PET examinations with more flexibility about the injection-acquisition time delay. Although a larger number of cancer patients is required to assess more precisely the measurement uncertainty of the 1-h-normalized SUV, the presented preliminary results indicate that it is very likely reasonable (7% SD for the present series of 14 cancer patients), and that it could be partly lowered when the acquisition is achieved beyond one hour after injection.
Acknowledgements
The authors would like to thank the patients who participated in the study and their physicians. They gratefully acknowledge helpful discussions with GE Health Care engineers and with Schering CISbiointernational, the manuscript editing of Isabelle Hessling, and the technical assistance of Henri Dupouy.