Plan
Comptes Rendus

Ecology / Écologie
Relevance of various formulations of phytoplankton chlorophyll a:carbon ratio in a 3D marine ecosystem model
[Pertinence de diverses formulations du rapport Chlorophylle a:Carbon dans un modèle d'écosystème marin 3D]
Comptes Rendus. Biologies, Volume 329 (2006) no. 10, pp. 813-822.

Résumés

Numerous experimental studies showed that the phytoplankton Chla-to-Carbon ratio (Chla:C) is highly variable, whereas most of the marine ecosystem models use a constant ratio. In this work, we tested three different formulations for computing the modelled Chla in a 3D coupled hydrodynamical–biogeochemical model of the Southwest lagoon of New Caledonia. The first formulation considers a constant Chla:C ratio. In the second one, Chla is a diagnostic variable related to the variable phytoplankton nitrogen-to-carbon ratio. In the last formulation, Chla is a state variable of the model, which is dynamically simulated. Results showed important differences between the formulations, the first leading to overestimate the Chla concentration in low nutrients conditions. Thus, this study strengthens the importance of the Chla modelling in a coupled model in order to better estimate a crucial variable for validation of ecosystem models.

De nombreuses études expérimentales ont montré que le rapport entre la chlorophylle a et le carbone phytoplanctonique (Chla:C) est fortement variable, alors que la plupart des modèles d'écosystème marin utilisent un rapport constant. Dans ce travail, nous avons testé trois formulations différentes pour calculer la valeur modélisée de Chla dans un modèle 3D hydrodynamique–biogéochimique du lagon du Sud-Ouest de Nouvelle-Calédonie. La première formulation considère un rapport Chla:C constant. Dans la seconde, la Chla est une variable diagnostique reliée au rapport variable azote sur carbone phytoplanctonique. Dans la dernière formulation, la Chla est une variable d'état du modèle, qui est simulée dynamiquement. Les résultats montrent des différences importantes entre les formulations, la première conduisant à surestimer la concentration en Chla en situation de faibles ressources en nutriments. Cette étude renforce donc l'importance de la modélisation de la Chla dans un modèle couplé, afin de mieux estimer une variable cruciale pour la validation des modèles d'écosystèmes.

Métadonnées
Reçu le :
Accepté le :
Publié le :
DOI : 10.1016/j.crvi.2006.07.006
Keywords: 3D hydrodynamical–biogeochemical modelling, Chlorophyll:carbon ratio, Lagoon, New Caledonia
Mot clés : Modélisation hydrodynamique–biogéochimique 3D, Rapport chlorophylle:carbone, Lagon, Nouvelle-Calédonie
Vincent Faure 1, 2 ; Christel Pinazo 1 ; Jean-Pascal Torréton 2 ; Pascal Douillet 2

1 Station marine d'Endoume, centre d'océanologie de Marseille, LOB UMR 6535, université de la Méditerranée, 13007 Marseille, France
2 IRD, UR Camélia, BP A5, 98848 Nouméa cedex, New Caledonia
@article{CRBIOL_2006__329_10_813_0,
     author = {Vincent Faure and Christel Pinazo and Jean-Pascal Torr\'eton and Pascal Douillet},
     title = {Relevance of various formulations of phytoplankton chlorophyll \protect\emph{a}:carbon ratio in a {3D} marine ecosystem model},
     journal = {Comptes Rendus. Biologies},
     pages = {813--822},
     publisher = {Elsevier},
     volume = {329},
     number = {10},
     year = {2006},
     doi = {10.1016/j.crvi.2006.07.006},
     language = {en},
}
TY  - JOUR
AU  - Vincent Faure
AU  - Christel Pinazo
AU  - Jean-Pascal Torréton
AU  - Pascal Douillet
TI  - Relevance of various formulations of phytoplankton chlorophyll a:carbon ratio in a 3D marine ecosystem model
JO  - Comptes Rendus. Biologies
PY  - 2006
SP  - 813
EP  - 822
VL  - 329
IS  - 10
PB  - Elsevier
DO  - 10.1016/j.crvi.2006.07.006
LA  - en
ID  - CRBIOL_2006__329_10_813_0
ER  - 
%0 Journal Article
%A Vincent Faure
%A Christel Pinazo
%A Jean-Pascal Torréton
%A Pascal Douillet
%T Relevance of various formulations of phytoplankton chlorophyll a:carbon ratio in a 3D marine ecosystem model
%J Comptes Rendus. Biologies
%D 2006
%P 813-822
%V 329
%N 10
%I Elsevier
%R 10.1016/j.crvi.2006.07.006
%G en
%F CRBIOL_2006__329_10_813_0
Vincent Faure; Christel Pinazo; Jean-Pascal Torréton; Pascal Douillet. Relevance of various formulations of phytoplankton chlorophyll a:carbon ratio in a 3D marine ecosystem model. Comptes Rendus. Biologies, Volume 329 (2006) no. 10, pp. 813-822. doi : 10.1016/j.crvi.2006.07.006. https://comptes-rendus.academie-sciences.fr/biologies/articles/10.1016/j.crvi.2006.07.006/

Version originale du texte intégral

1 Introduction

To validate a model is a tough issue because of the difficulty to link the modelled and the experimental variables. The most frequently met example is that of phytoplankton chlorophyll a (Chla). As phytoplankton productivity is usually measured in carbon assimilation rate (14C), modelled growth rate equations are often expressed in carbon. Thus, most biogeochemical models express phytoplankton in terms of carbon and several elements (nitrogen, phosphorus, silicon, etc.) that could control the growth rate [1]. However, the biomass is usually measured as Chla. In order to compare model results and field data, the first approach is to use a constant ratio of Chla to carbon (Chla:C) for converting phytoplankton carbon (C) in Chla (ERSEM II [2], MODECOGel [3]). However, this ratio appears to be highly variable. Measurements in microalgal cultures show that Chla:C changes in response to ambient light, temperature and nutrients availability, ranging from 0.036 to 1.2 g Chla (mol C)−1 (i.e. 0.003 to 0.1 g Chla (g C)−1 [4]). Recent studies on oceanic communities confirm this high variability with values ranging from 0.15 to 0.36 g Chla (mol C)−1 (i.e. 0.0125 to 0.03 g Chla (g C)−1) in the surface waters of subtropical Atlantic Ocean, with a 3–7-fold variation with depth [5]. In the English Channel, measured ratios values ranged from <0.12 to >0.96 gChla (mol C)−1 (i.e. 0.01 to 0.08 g Chla (g C)−1 [6]).

As a consequence, adding a variable Chla content in an ecosystem model appears to be an important challenge. One simple solution could be to impose a Chla:C ratio dependent on the internal N:C ratio of phytoplankton [7]. Another way is to use an empirical model describing Chla:C, as a function of temperature, daily irradiance and nutrient-limited growth rate [8]. Finally, several mechanistic approaches were developed to explicitly model the Chla content [9–12].

This study aims at testing and comparing the inclusion of different formulations of Chla in a 3D coupled model and at studying the impact on phytoplankton dynamics, and thus the ecosystem functioning. Three different formulations are considered: a constant Chla:C ratio (CHL_CST), a Chla:C ratio calculated from a stationary equation (CHL_ST), and, finally, a formulation using a dynamic equation to compute the concentration of Chla (CHL_DYN). The model used in this work was first developed by Pinazo et al. [13] on the Southwest lagoon of New Caledonia. The choice of the site came from the contrasted status of its waters over the lagoon, associated with a high variability of the climatic conditions. Besides, this model expressed phytoplankton both in carbon and nitrogen, with a variable N:C ratio, and thus permitted to use the formulations described above.

2 Materials and methods

2.1 Study site

New Caledonia is located in the Pacific Ocean at 22°S and 165°E and is subject to tropical or subtropical meteorological conditions. Winds are characterized by two main directions [14]. Trade winds blowing from 60°to 160°at speed higher than 4 m s−1 represent 69% of yearly wind occurrence (250 dyr−1) around Nouméa. Westerly winds blowing from 220°to 300°at speeds higher than 2 m s−1 represent less than 12% of yearly wind occurrence. The study area is the Southwest (SW) lagoon of New Caledonia, delimited by the land and the barrier reef between the Mato pass in the South, and the Uitoe pass in the North (Fig. 1). It receives freshwater runoffs from three main rivers (Pirogues, Coulée, and Dumbéa), but river flow rates are usually low, with 5 m3 s−1 (yearly average) for the largest one, the Dumbéa River [13]. The central part of the lagoon is characterized by oligotrophic to mesotrophic waters (yearly average 0.25±0.01 μgChla l−1, [15]), whereas a local eutrophication is perceptible near the city of Nouméa (146 000 inhabitants). In addition to this local enrichment due to urban effluents, nickel industry delivers industrial effluents [16]. In this lagoon, phytoplankton biomass displays a weak seasonality, associated with marked short-term (week) variations [15] and interannual differences [17].

Fig. 1

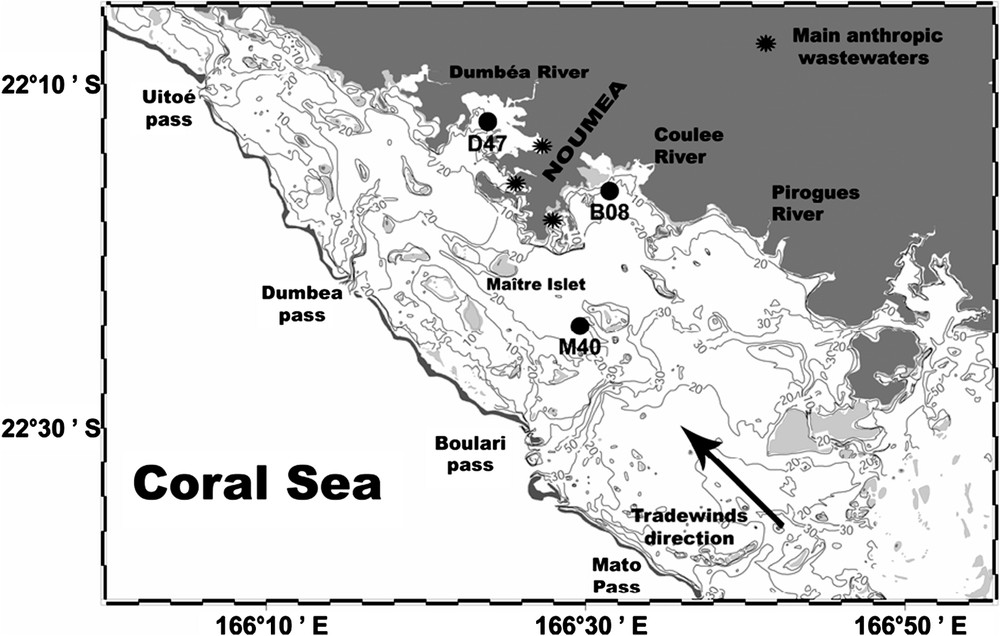
Map of the Southwest lagoon of New Caledonia. Black dots represent the studied stations (M40, B08, D47).

2.2 Hydrodynamic model

Hydrodynamic studies have been conducted in New Caledonia for over 25 years [18,19]. Recently, a model of the water circulation in the Southwest lagoon was developed and validated [20–23]. In these papers, model description, circulation analysis, vertical structure of the currents, and the initial and boundary conditions were presented in details. In this study, we use a Δx=Δy=500 m grid spacing and 10σ-levels.

2.3 Biogeochemical model

The first biogeochemical model was developed by Bujan et al. [24] and Pinazo et al. [13]. An improved version was implemented by Faure [25] by adding an explicit microbial loop. The structure of the whole model is described in Fig. 2. The structure is typical of NPZD models (nutrients–phytoplankton–zooplankton–detritus). However, the zooplankton is considered as a theoretical population, undifferentiated and static, and no state variable is associated to it. Thus, the model is closed by a function of predation. Each compartment is expressed in carbon and nitrogen units, leading to 11 state variables (Table 1). One particularity of the model is the expression of the growth rate of phytoplankton based on the formulation of cell quota [26,27]. The variable stoichiometry allows taking into account the nutritional status of the cells, the nutrient limitation of phytoplankton growth, and the computation of nutrients uptake. Primary production is limited by temperature, light and nutrients (ammonium (NH4) and nitrate (NO3)). Bacterial production (BP) is also modelled with the cell quota concept [28]: BP is limited by the cell internal quota in carbon and nitrogen. All state variables equations could be found in Pinazo et al. [13] and Faure [25]. Here, we present only the pertinent equations (Table 2).

Fig. 2

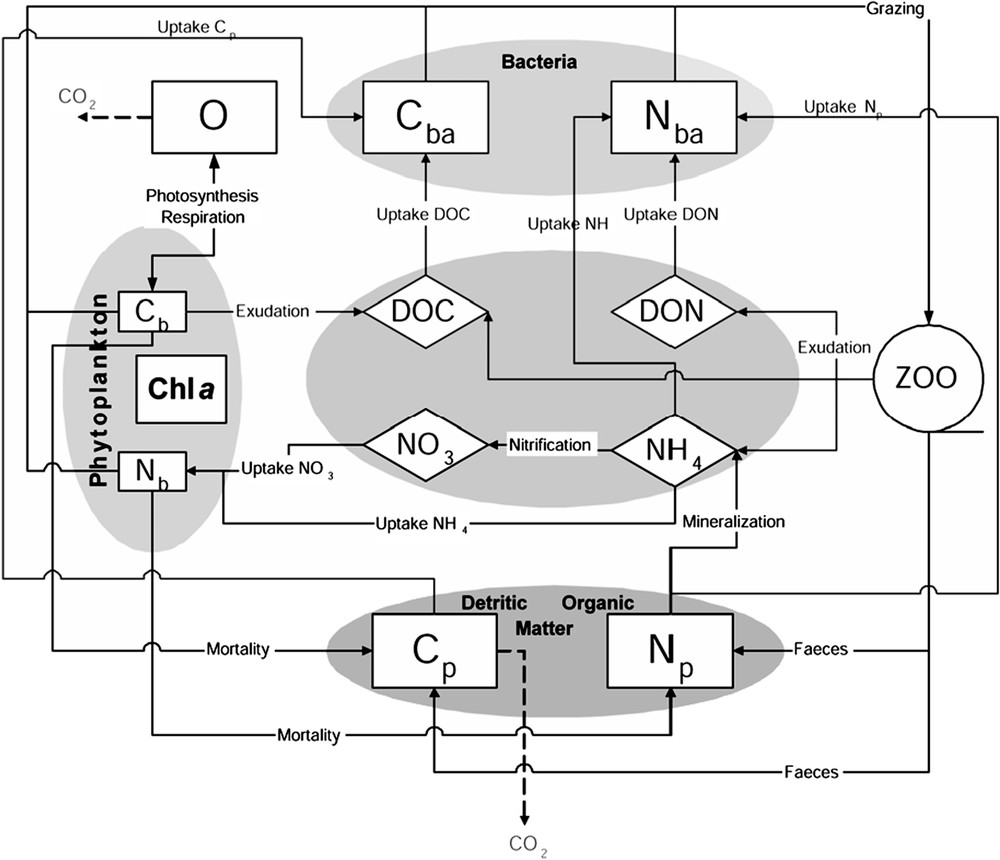
The pelagic biogeochemical model.

Table 1

State variables in μmol l−1, except Chla in μg l−1

CB phytoplankton carbon
NB phytoplankton nitrogen
Chla phytoplankton chlorophyll a
CBA bacterial carbon
NBA bacterial nitrogen
CP particulate detritic carbon
NP particulate detritic nitrogen
DOC dissolved organic carbon
DON dissolved organic nitrogen
NH4 ammonium
NO3 nitrate
O oxygen
Table 2

List of equations linked with phytoplankton and Chlorophyll trends

Processes Equation
CB trend
C B t = ( 1 exu DOC ) P C C B ξ ( V NH 4 C + V NO 3 C ) C B g B C B R C C B (1)
CB growth rate
P C = P m C [ 1 exp ( α Chl a E Q C Chl a P m C ) ] (2)
Maximal CB growth rate
P m C = μ max ( T ) [ Q C N min Q C N max Q C N min Q C N ] (3)
Carbon specific nitrogen uptake
V N C = max V N C [ max Q C N Q C N max Q C N min Q C N ] ( N N + K N ) , N = NH 4 , NO 3 (4)
Chla:CB ratio [13]
Q C Chl a = mean Q C Chl a (5)
Chla:CB ratio [7]
Q C Chl a = Q C N ( min Q N Chl a + ( max Q N Chl a min Q N Chl a ) ( Q C N min Q C N ) max Q C N min Q C N ) (6)
Chla trend [11,29]
Chl a t = ρ Chl a ( V NH 4 C + V N0 3 C ) C B g B Chl a R Chl a Chl a (7)
Regulatory term
ρ Chl a = max Q N Chl a P C α Chl a Q C Chl a E (8)

Three different formulations were tested in order to model the Chla concentration (CHL_CST, CHL_ST, CHL_DYN). In Table 2, Eqs. (1) to (4) were the same for each formulation, describing the trend of phytoplankton carbon and the carbon specific nitrogen uptake (on NH4 and NO3).

In CHL_CST, modelled Chla concentration was computed using a constant Chla:C ratio equal to 0.24 g Chla (mol C)−1 (Table 2, Eq. (5)).

As the model simulated a variable phytoplankton N:C ratio, the second formulation chosen (CHL_ST) was a stationary equation from Smith et al. [7] (Table 2, Eq. (6)). This equation calculated the Chla:C ratio of phytoplankton depending on their internal N:C ratio. The Chla:C ratio is positively correlated with the N:C ratio. In CHL_ST, Chla is not a state variable, but a diagnostic variable, and permitted to diminish computation time.

In CHL_DYN, Chla is an explicit state variable in the ecosystem model. The Chla synthesis is modelled with a dynamic equation from Geider et al. [11] and Lefèvre et al. [29] (Table 2, Eqs. (7)–(8)). Carbon-specific Chla synthesis is determined by the rate of nitrogen assimilation (Table 2, Eq. (4)), and a regulatory term (Table 2, Eq. (8)).

2.4 Coupled model

Eq. (1) gives the standard three-dimensional equation for each of the biogeochemical concentration (Conc). BIO_TEND represents the gain and losses of the considered variable:

Conct+UConcX+VConcY+(WWB)ConcZ=BIO_TEND+X(KXConcX)+Y(KYConcY)+Z(KZConcZ)

The standard structure of three-dimensional biogeochemical equations is presented in Eq. (1). The left-hand side of the equation accounts for temporal variability, vertical and horizontal advection, and settling velocity of particles. The right-hand side of the equation accounts for biogeochemical gain and loss (BIO_TEND), and turbulent diffusivities. The current velocities (U,V,W) and the diffusivity coefficients (KX,KY,KZ) calculated by the hydrodynamic model were used as forcing variables for the biogeochemical model.

The hydrodynamic model was forced by tide and by realistic wind with a time step of 10 min. It was dynamically coupled with the biogeochemical model [25]: the scheme of advection–diffusion calculated the evolution of biogeochemical variables in parallel to the execution of the physical code, with the same time step of 50 s. The biogeochemical model was forced by irradiance measured each hour, and calculated the trends of biogeochemical variables, with a time step of 20 min.

2.5 Simulation strategy

Initialization conditions were established thanks to a campaign during which 90 stations were sampled over the lagoon (Camecal 5, 19–27 June 2003). Boundary conditions were adjusted to field measurements and published data (Table 5). Freshwater inputs from the three main rivers were introduced in the model. The strong trophic gradient between the bays around Nouméa and the central part of the lagoon led us to consider the inputs in nitrogen from human sewages in three bays of Nouméa (Sainte-Marie, Koutio and Grande Rade, see Fig. 1). Moreover, coupling between pelagic processes and benthic mineralization could represent a source of nitrogen in coastal areas of the lagoon (C. Grenz, unpublished data). We added a constant positive flux of ammonium and nitrate into the pelagic water column along the coastline (NH4: 15 μmol m−2 h−1; NO3: 5 μmol m−2 h−1; Grenz, unpublished data).

Table 5

Boundary conditions of state variables

Chla (μg l−1) CBA (μmol l−1) NBA (μmol l−1) CP (μmol l−1) NP (μmol l−1) DOC (μmol l−1) DON (μmol l−1) NH4 (μmol l−1) NO3 (μmol l−1) O (μmol l−1)
Boundary conditions 0.2 0.7 0.11 2.1 0.5 3 0.62 0.02 0.001 180

A 34-day realistic simulation of the model was run in order to examine the biogeochemical response of the Southwest lagoon to the transient meteorological conditions measured during June and July 2003 (Fig. 3). The simulation began on 19 June and ended on 23 July; it permitted to illustrate the model behaviour under different meteorological events. Firstly, a low irradiance (lower than 600 J cm−2 d−1) occurred around 27 June and 16 July, whereas the mean irradiance for this period is 1257 J cm−2 d−1; strong rains came with the second decrease of irradiance, leading to river flows in each river, up to 300 m3 s−1 for the Dumbéa River. Secondly, a shift from a low northwest to a strong southeast wind took place around the 7 July. The duration of the simulation was chosen in order to compare model outputs with field data.

Fig. 3

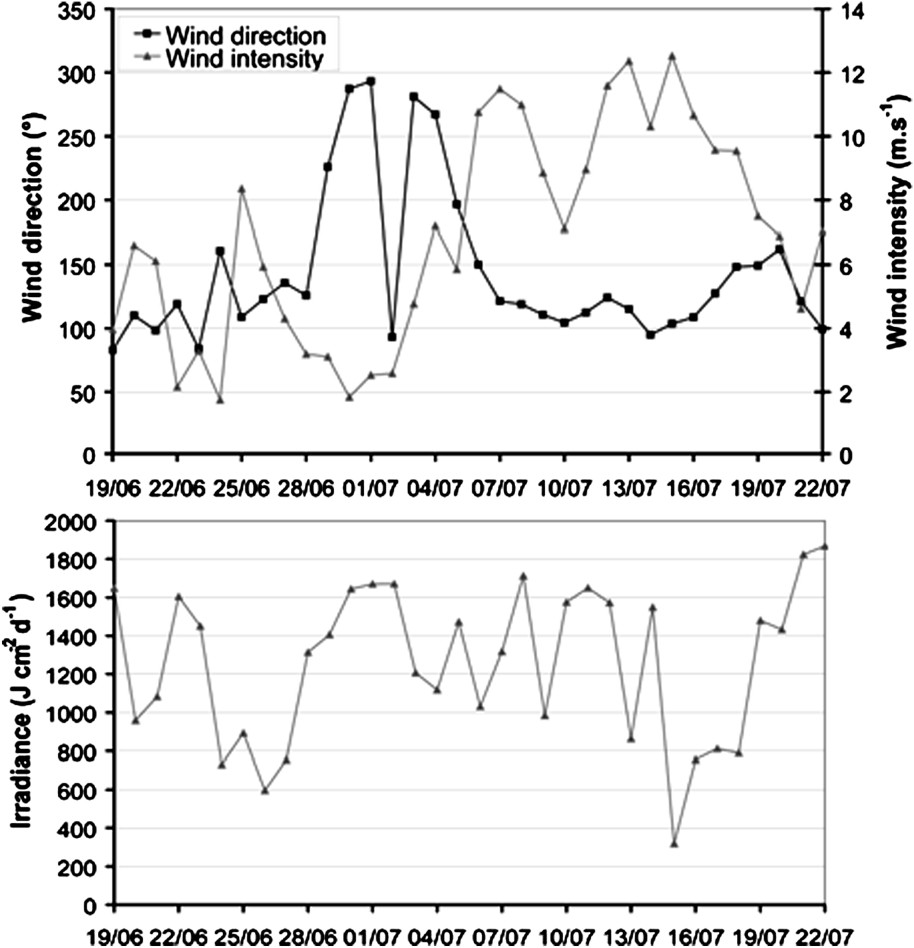
Upper panel: wind intensity (m s−1) and direction (○). Lower panel: irradiance (J cm−2 d−1). Data measured on Maître Islet from 19 June 2003 to 22 July 2003. Wind: mean values over 24 h of data measured every 10 min. Irradiance: daily sum of data measured every hour.

2.6 Measured data

Several lagoon surveys demonstrated that, on average, the water column is nearly homogeneous and that 3-m-depth samples are well representative of the whole water column [13,15]. For an easier presentation, results will be discussed after distinguishing three stations with increasing trophic status (Fig. 1): M40 represents the central part of the lagoon, B08 an open bay and D47 a semi-closed bay around Nouméa.

Experimental data were collected on 8 and 22 July at 3-m-depth on M40, B08 and on 10 and 23 July on D47. Chlorophyll a(Chla) concentration was fluorometrically determined on 7-ml methanol extracts of 300-ml samples collected onto Whatman GF/F filters according to Holm-Hansen [30]. Ammonium concentration was fluorometrically determined on three 40-ml replicates on a Turner TD-700, using the o-phtaldialdehyde method [31].

3 Results

Like experimental studies, the model outputs showed the same homogeneity for the vertical distribution of state variables and we chose therefore to present 3-m-depth model outputs, corresponding to the sampling depth. Fig. 4 presents for each station and each model formulation (CHL_CST, CHL_ST, CHL_DYN) the Chla concentration, the Chla:C ratio, the N:C ratio, the ammonium concentration (NH4) and the gross primary production (PP).

Fig. 4

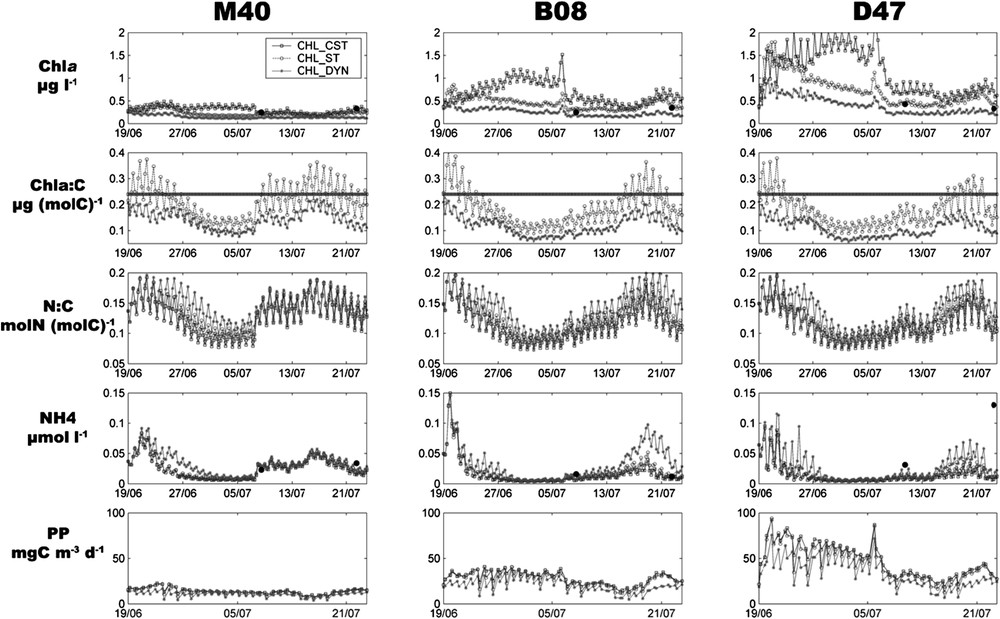
Time evolution of simulated Chla (μg l−1), Chla:C ratio (μg (mol C)−1), N:C ratio (mol N (mol C)−1), NH4 (μmol l−1) and primary production (mg C m−3 d−1), at stations M40, B08 and D47. Different curves represent results from each model formulation. Square: CHL_CST; circle: CHL_ST; star: CHL_DYN. Filled circles represent the measured values for Chla and NH4. Remark: the line for Chla:C ratio curves represents the constant ratio value in CHL_CST.

The impact of physical forcings was evident and explained the main variations of the biogeochemical variables. The two low-irradiance events led to a decrease of PP, and river inputs in the bay (B08 and D47) caused an increase of NH4 from 16 July. The wind shift of 7 July produced a decrease of Chla in each zone. Oligotrophic waters coming from the southeastern end of the lagoon flushed the central part of the lagoon (M40), while the bays (B08 and D47) received the waters driven away from the central part of the lagoon. However, NH4 increased in M40 because of low consumption of nutrients (low PP and low Chla concentration) and active regeneration by bacteria.

Simulated Chla and PP highlighted the trophic status of each station. The PP and Chla, averaged on the 34-day simulation, were 12.6 mg C m−3 d−1 and 0.23 μg l−1 at M40, 24.9 mg C m−3 d−1 and 0.45 μg l−1 at B08, whereas maximum values were 42.1 mg C m−3 d−1 and 0.75 μg Chla l−1 at D47. Comparisons between model formulations showed that CHL_CST predicted the highest values of PP and Chla, whereasCHL_DYN resulted in the lowest values, with CHL_ST displaying intermediate values (Table 4).

Table 4

Primary Production (PP, in mg C m−3 s−1), Chla:C ratio (g (mol C)−1) and Chla (μg l−1), in M40, B08 and D47, averaged on the 34-day simulation. Values are presented for each model formulation: CHL_CST, CHL_STA, and CHL_DYN

M40 B08 D47
CHL_CST CHL_ST CHL_DYN CHL_CST CHL_ST CHL_DYN CHL_CST CHL_ST CHL_DYN
Average PP 14.09 13.26 10.43 28.35 26.43 20.17 47.88 44.33 34.09
Average Chla:C 0.24 0.21 0.14 0.24 0.18 0.19 0.24 0.18 0.1
Average Chla 0.29 0.24 0.15 0.67 0.45 0.25 1.1 0.74 0.4

Values of Chla:C ratio for CHL_ ST and CHL_DYN varied around the constant value of CHL_CST (Table 4). CHL_DYN predicted lower values than CHL_ST, and never reached the constant value of 0.24 g Chla (mol C)−1. Moreover, the diel variations of the Chla:C in CHL_ST were higher than in CHL_DYN and reached up to 0.15 g Chla (mol C)−1. Variations of Chla:C for each model formulation were well correlated with the change of the N:C ratio and hence with changes in NH4 concentration. At each station, the maximum of the Chla:C coincided with the maximum of NH4 concentration. Values of N:C ratio were higher for CHL_DYN due to a low carbon primary production, whereas this ratio was quite equivalent between CHL_CST and CHL_DYN. High values of N:C, leading to low nutrient uptake, explained the higher concentration in NH4 for CHL_DYN during the low irradiance events.

Model outputs for Chla fitted well with field data (closed circles on Fig. 4), especially for CHL_ST. Simulated NH4 concentrations were also consistent with field data, except on 22 of July in D47. This surprising high value could be explained by an unpredicted advective transport of allochtonous ammonium coming from Nouméa City or might be the result of analytical contamination.

4 Discussion

4.1 Validity of simulated variables

The simulated variables appeared to be consistent with usual observations in the Southwest lagoon of New Caledonia [15–17,19]. The gradient of primary production between the central part of the lagoon and the bays was well reproduced. The average simulated values (Table 4) appeared to be coherent with the measured data, with a yearly averaged PP of 8.1 and 45.3 mg C m−3 d−1 at M33 (close to M40) and N12 (in a semi-closed bay of Nouméa), respectively [15]. The measured value of Chla and NH4 concentrations were well reproduced by the model, especially when using the CHL_ST model (Fig. 4). The simulated Chla:C ratios ranged from a minimum value of 0.07 g Chla (mol C)−1 to a maximum of 0.375 g Chla (mol C)−1. These values fall within the range reported in experimental studies on microalgal culture (0.036 to 1.2 g Chla (mol C)−1) [4], in subtropical Atlantic Ocean waters (0.15 to 0.36 g Chla (mol C)−1) [5] and in English Channel waters (0.12 to 0.96 g Chla (mol C)−1) [6]. The simulated phytoplankton N:C ratio ranged from 0.076 to 0.19 mol N (mol C)−1. These values are consistent with the 0.08–0.164 range reported in the North Pacific Central Gyre [32], or with the 0.07–0.14 range observed in the Atlantic Ocean (BATS) [29].

4.2 Behaviour of each model

As shown by a previous modelling study [13,23], the lagoon channel is deeply influenced by hydrodynamics resulting from trade winds. Oceanic waters enter the lagoon by the southern sector end, and very short flushing times of water are computed in the central part of the lagoon [23]. In our simulation, the different model formulations did not show large differences in M40, therefore under strong hydrodynamical forcings (strong trade winds), the complexity of a biogeochemical model does not significantly change the outputs [33].

However, flushing times of waters in areas like bays around Nouméa are longer [23], and therefore these zones are more controlled by biogeochemical processes. In B08 and D47, each model formulation clearly produced different outputs. During the first part of the simulation (19 June to 7 July), using CHL_CST, Chla remained very high in B08 and D47, thanks to a high carbon production. At the opposite, using CHL_ST or CHL_DYN, Chla started to decrease on 27 June, when the NH4 concentration was too low to maintain the N:C ratio. Using these two model formulations, during the rain event and nitrogen inputs on 16 July, the N:C and Chla:C ratios increased, leading to an increase of Chla (slight for CHL_DYN). It appeared that a constant Chla:C ratio could lead to overestimate the Chla concentration in low nutrient conditions, since Chla could also be dependent upon the N:C ratio and thus on the nutrient resources. As a consequence, even if the carbon primary production could be well described and modelled, the conversion of phytoplankton carbon into Chla using a constant ratio would produce significant inaccuracy on the value of the Chla concentration.

Using the CHL_DYN simulation, the Chla:C ratio was low, leading to unrealistically low values of Chla in comparison with measured data (Fig. 4). Lefèvre et al. [29] showed that some parameters as μmax(T) or αChla (Tables 2 and 3) could have a pronounced effect on the simulated value of Chla and perhaps a better estimation of our parameters could improve the outputs of the dynamic model. The difficulty could be to establish a set of parameters able to describe contrasted trophic status such as those encountered in the Southwest lagoon of New Caledonia.

Table 3

List of parameters

Parameter Definition Value Refs.
g B Grazing rate 0.4   d −1 assumed
R C , R Chl a Respiration 0.1   d −1 [29]
α Chl a Chlorophyll-specific light-absorption coefficient 8.5×10⁻⁶ m2molC (g Chla J)−1 assumed
ζ Cost of nitrogen assimilation 2.3 mol C (mol N)−1 [29]
μ max ( T ) = a e b T Maximum growth rate a = 9.8511 × 10 −6   s −1 [13]
b=0.063321
max V NH 4 C Maximum uptake rate for NH4 2.1×10⁻⁵ mol N (mol C)−1 s−1 [13]
max V NO 3 C Maximum uptake rate for NO3 8.5×10⁻⁶ mol N (mol C)−1 s−1 [13]
K NH 4 Half saturation constant for NH4 uptake 0.2 mol N [13]
K NO 3 Half saturation constant for NO3 uptake 0.3 mol N [13]
min Q C N Minimum phytoplankton N:C ratio 0.05 mol N (mol C)−1 [11]
max Q N Chl a Maximum Chla:N ratio 3.8 g Chla (mol N)−1 assumed
min Q N Chl a Minimum Chla:N ratio 1 g Chla (mol N)−1 [7]
max Q C N Maximum phytoplankton N:C ratio 0.2 mol N (mol C)−1 [13]
mean Q C Chl a Constant phytoplankton Chla:C ratio 0.24 g Chla (mol C)−1 [13]

5 Conclusion – perspectives

Few model studies focused on including a dynamic model of phytoplankton Chla into a coupled physical–biogeochemical model [29,34]. Indeed, most of the models before 1995 [8] and 1997–1998 [4], and still nowadays, use a constant Chla:C ratio, producing biased results on the value of Chla concentration. The paradox is that these Chla values were generally used to validate these models. As Chla is one of the essential variables in modelling and field data, a modelled variable Chla:C ratio seems an important step in the development and validation of an ecosystem model.

A comparison between a Redfieldian and a dynamic model [34] showed that fluxes and stocks can be equally well predicted by both models. Both Lefèvre et al. [29] and Faugeras et al. [34] found a good agreement between dynamic model outputs and field data, suggesting that such model was relevant. And indeed, this first attempt of comparing different formulations in the SW lagoon of New Caledonia showed that the three different formulations displayed overall the same pattern.

In Faugeras et al.'s study [34], the variability of the simulated variables was much higher in the mechanistic model thanks to a faster response of this model to its environment. Our results in the Southwest lagoon of New Caledonia showed equivalent conclusions, with strong variations occurring during transient events such as modifications of the nutrients status or of the hydrodynamical forcings. For example, using CHL_DYN and CHL_ST simulations, the impact of nutrients availability on the Chla:C ratio, and thus on Chla, is clearly faster than using the CHL_CST model. Thus, in providing a thinner time resolution of the processes involved in phytoplankton dynamics, a variable Chla:C ratio allows a better description of the impact of short-term forcing, which is especially important in the ecosystem studied.

In parallel, this work underlines the importance of short-term sampling and the obvious difficulty to interpret field data in such a highly variable environment. Moreover, such modelling approaches could allow investigating the implication of high variability fluxes and variables on the carbon and nitrogen cycles of marine ecosystems.

In this comparative study of the SW lagoon of New Caledonia, the CHL_ST simulation appeared the most appropriate, since it provided outputs that were the closest to measured values, with a minimum parameterization and computation time. We can expect in the future that a dynamic model of the Chla (CHL_DYN) with a better parameterization will possibly give satisfactory and better results. Before applying such a model, an evaluation of parameters specific to our ecosystem will be required. Nevertheless, the cost in computation time will be particularly higher. Besides, others formulations, like the empirical one from Cloern et al. [8], could also be considered and tested in order to proceed with the study of Chla:C ratio in 3D ecosystem models.

Acknowledgements

This work was supported by the ‘Institut de recherche pour le développement’ (IRD), and grants from the ‘Programme national Environnement côtier’ (PNEC) and the ZoNéCo programme. Part of the meteorological data was kindly provided by Météo France and DAVAR.


Bibliographie

[1] M.J.R. Fasham; K.J. Flynn; P. Pondaven; T.R. Anderson; P.W. Boyd Development of a robust marine ecosystem model to predict the role of iron in biogeochemical cycles: A comparison of results for iron-replete and iron-limited areas, and the SOIREE iron-enrichment experiment, Deep-Sea Res., Part I: Oceanogr. Res. Pap., Volume 53 (2006) no. 2, pp. 333-366

[2] J.G. Baretta-Becker; J.W. Baretta Special issue: European regional seas ecosystem model II, J. Sea Res., Volume 38 (1997) no. 3–4, pp. 169-438

[3] G. Lacroix; M. Grégoire Revisited ecosystem model (MODECOGeL) of the Ligurian Sea: seasonal and interannual variability due to atmospheric forcing, J. Mar. Syst., Volume 37 (2002) no. 4, pp. 229-258

[4] R.J. Geider Light and temperature dependence of the carbon to chlorophyll a ratio in microalgae and cyanobacteria: Implications for physiology and growth of phytoplankton, New Phytol., Volume 106 (1987) no. 1, pp. 1-34

[5] M.J.W. Veldhuis; G.W. Kraay Phytoplankton in the subtropical Atlantic Ocean: towards a better assessment of biomass and composition, Deep-Sea Res. Part I Oceanogr. Res. Pap., Volume 51 (2004) no. 4, pp. 507-530

[6] C.A. Llewellyn; J.R. Fishwick; J.C. Blackford Phytoplankton community assemblage in the English Channel: a comparison using chlorophyll a derived from HPLC-CHEMTAX and carbon derived from microscopy cell counts, J. Plankton Res., Volume 27 (2005) no. 1, pp. 103-119

[7] C.L. Smith; P. Tett A depth-resolving numerical model of physically forced microbiology at the European shelf edge, J. Mar. Syst., Volume 26 (2000) no. 1, pp. 1-36

[8] J.E. Cloern An empirical model of the phytoplankton chlorophyll: Carbon ratio – the conversion factor between productivity and growth rate, Limnol. Oceanogr., 40 (1995) no. 7, pp. 1313-1321

[9] S.C. Doney; D.M. Glover; R.G. Najjar A new coupled, one-dimensional biological-physical model for the upper ocean: Applications to the JGOFS Bermuda Atlantic Time-series Study (BATS) site, Deep-Sea Res., Part II: Top. Stud., Oceanogr., Volume 43 (1996) no. 2–3, pp. 591-624

[10] R.J. Geider; H.L. MacIntyre; T.M. Kana Dynamic model of phytoplankton growth and acclimation: Responses of the balanced growth rate and the chlorophyll a: Carbon ratio to light, nutrient-limitation and temperature, Mar. Ecol. Prog. Ser., Volume 148 (1997) no. 3, pp. 187-200

[11] R.J. Geider; H.L. MacIntyre; T.M. Kana A dynamic regulatory model of phytoplanktonic acclimation to light, nutrients, and temperature, Limnol. Oceanogr., Volume 43 (1998) no. 4, pp. 679-694

[12] K.J. Flynn; K. Flynn The release of nitrite by marine dinoflagellates development of a mathematical simulation, Mar. Biol., 130 (1998), pp. 455-470

[13] C. Pinazo; S. Bujan; P. Douillet; R. Fichez; C. Grenz; A. Maurin Impact of wind and freshwater inputs on phytoplankton biomass in the coral reef lagoon of New Caledonia during the summer cyclonic period: a coupled three-dimensional biogeochemical modeling approach, Coral Reefs, Volume 23 (2004) no. 2, pp. 281-296

[14] S. Blaize; D. Lacoste Atlas climatique de la Nouvelle Calédonie, Météo France, Nouméa (Nouvelle-Calédonie), 1995 (104 p.)

[15] S. Jacquet, Influence des nutriments sur le réseau trophique microbien planctonique dans le lagon SW de Nouvelle-Calédonie, PhD thesis, université Pierre-et-Marie-Curie (Paris-6), Paris, 2005 (228 p. + annexes)

[16] S. Jacquet; B. Delesalle; J.-P. Torréton; J. Blanchot Response of phytoplankton communities to increased anthropogenic influences (Southwestern Lagoon, New Caledonia), Mar. Ecol. Prog. Ser., Volume 320 (2006), pp. 65-78

[17] D. Binet; R. Le Borgne The coastal station of Noumea: ten years of observations about the hydrology and pelagos of the south-west lagoon of New-Caledonia, Arch. Sci. Mer Oceanogr. Biol. Mar. Cent. Noumea, ORSTOM, Nouméa, 1996 (37 p.)

[18] F. Jarrige; R. Radok; G. Krause; P. Rual, Courants dans le lagon de Nouméa, Nouvelle-Calédonie. Déc. 74–janv., vol. 75, ORSTOM H. Lamb Institute of Oceanography, Flinders University, Nouméa, Adelaide, Australia, 1975 (6 p.)

[19] F. Rougerie, Le lagon sud-ouest de la Nouvelle-Calédonie : spécificité hydrologique et productivité, Orstom–Études et thèses, Paris, 1986 (231 p.)

[20] P. Douillet Tidal dynamics of the south-west lagoon of New Caledonia: observations and 2D numerical modelling, Oceanol. Acta, Volume 21 (1998) no. 1, pp. 69-79

[21] P. Douillet; S. Ouillon; E. Cordier A numerical model for fine suspended sediment transport in the southwest lagoon of New Caledonia, Coral Reefs, Volume 20 (2001) no. 4, pp. 361-372

[22] S. Ouillon; P. Douillet; S. Andrefouet Coupling satellite data with in situ measurements and numerical modelling to study fine suspended-sediment transport: a study for the lagoon of New Caledonia, Coral Reefs, Volume 23 (2004) no. 1, pp. 109-122

[23] A. Jouon; P. Douillet; S. Ouillon; P. Fraunié Calculations of hydrodynamic time parameters in a semi-opened coastal zone using a 3D hydrodynamic model, Cont. Shelf Res., Volume 26 (2006) no. 12–13, pp. 1395-1415

[24] S. Bujan; C. Grenz; R. Fichez; P. Douillet Biochemical recycling in the south-west lagoon of New Caledonia. A box model approach, C. R. Geoscience, Volume 323 (2000) no. 2, pp. 225-233

[25] V. Faure, Modélisation biogéochimique du lagon de Nouméa – influence de la boucle microbienne, rapport de DEA « Océanologie, météorologie et environnement », université Pierre-et-Marie-Curie (Paris-6), Paris, 2002 (38 p.)

[26] J. Caperon Nitrogen-limited growth of marine phytoplankton. I. Changes in population characteristics with steady-state growth rate, Deep-Sea Res. Part I Oceanogr. Res. Pap., Volume 19 (1972) no. 9, pp. 601-618

[27] P. Tett Modelling the growth and distribution of marine microplankton, Soc. Gen. Microbiol. Symp., Volume 41 (1987), pp. 387-425

[28] T.F. Thingstad Utilization of N, P, and organic C by heterotrophic bacteria. 1 Outline of a chemostat theory with a consistent concept of ‘maintenance’ metabolism, Mar. Ecol. Prog. Ser., Volume 35 (1987) no. 1–2, pp. 99-109

[29] N. Lefèvre; A.H. Taylor; F.J. Gilbert; R.J. Geider Modeling carbon to nitrogen and carbon to chlorophyll a ratios in the ocean at low latitudes: Evaluation of the role of physiological plasticity, Limnol. Oceanogr., Volume 48 (2003) no. 5, pp. 1796-1807

[30] O. Holm-Hansen; C.J. Lorenzen; R.W. Holmes; J.D.H. Strickland Fluorimetric determination of chlorophyll, Cons. Perm. Int. Explor. Mer., Volume 30 (1965), pp. 3-15

[31] R.M. Holmes; A. Aminot; R. Kérouel; B.A. Hooker; B.J. Peterson A simple and precise method for measuring ammonium in marine and freshwater ecosystems, Can. J. Fish. Aquat. Sci., Volume 56 (1999) no. 10, pp. 1801-1808

[32] C.B. Allen; J. Kanda; E.A. Laws New production and photosynthetic rates within and outside a cyclonic mesoscale eddy in the North Pacific Subtropical Gyre, Deep-Sea Res., Part I: Oceanogr. Res. Pap., Volume 43 (1996) no. 6, pp. 917-936

[33] M.D. Skogen; A. Moll Importance of ocean circulation in ecological modeling: An example from the North Sea, J. Mar. Syst., Volume 57 (2005) no. 3–4, pp. 289-300

[34] B. Faugeras; O. Bernard; A. Sciandra; M. Lévy A mechanistic modelling and data assimilation approach to estimate the carbon/chlorophyll and carbon/nitrogen ratio in a coupled hydrodynamical model, Nonlinear Process Geophys., Volume 11 (2004), pp. 515-533


Commentaires - Politique


Ces articles pourraient vous intéresser

Benthic ecology of tropical coastal lagoons: Environmental changes over the last decades in the Términos Lagoon, Mexico

Christian Grenz; Renaud Fichez; Carlos Álvarez Silva; ...

C. R. Géos (2017)


Enhancement of regional variations in salinity and temperature in a coral reef lagoon, New Caledonia

Sylvain Ouillon; Pascal Douillet; Renaud Fichez; ...

C. R. Géos (2005)


Évolution géomorphologique de l'avant-pays du Sud-Ouest de la Nouvelle-Calédonie durant les derniers cycles glaciaires

Violaine Chevillotte; Pascal Douillet; Guy Cabioch; ...

C. R. Géos (2005)