

1 Introduction
Most of our current knowledge in nature management and conservation has come from studies of large ecosystems [1]. As small, manmade or natural shallow waterbodies, ponds are numerous, typically outnumbering larger lakes by a ratio of about 100 to 1 [2], and occur in virtually all terrestrial environments, from polar deserts to tropical rainforests. Despite this, they have been mostly ignored by environmental managers and ecologists, or regarded as smaller versions of larger lakes (but see [3]). However, ponds often constitute biodiversity ‘hot spots’ within a landscape [4,5], challenging conventional approaches in practical nature conservation. Ponds and the biodiversity they support are threatened by human activity (agriculture, industry, urbanism), though these ecosystems have obvious ecological functions [6,7] and recognized social and economic uses [8]. During the 20th century, wetland losses reached 40–90% in a number of northwestern European countries [9]. As a result of large-scale habitat loss [10], many species are also endangered, thus motivating studies aiming at understanding the dynamics of pond populations and communities for planning conservation efforts such as ecosystem restoration or creation [11]. Among the many taxa that depend on ponds, ‘flagship’ groups are the best known. Specifically, amphibians, Odonata and aquatic plants are emblematic of pond biodiversity, all of these groups including numerous critically endangered species [12–15]. As wetland habitats, ponds have only recently started receiving some attention, and most of the current research focuses on assessing the biodiversity they support [16,17] or are likely to host [18,19]. It is now well established that pond management and conservation is closely linked to our knowledge of the biodiversity and ecology of the biota they host, and to their usefulness in terms of ecological and economic services. Gaston et al. [20] highlighted that urban domestic ponds (among various habitat types) could increase regional biodiversity. Therefore, when ponds are artificially created to support human activities (recreation, ornament, agricultural practices, etc.), one may consider whether, in addition to the services they offer, they also have an added value for sustaining aquatic biodiversity, especially when natural wetlands are lacking. The settings for our study allowed us to address this type of question.
The study focused on the large numbers of ponds dug by man in an agricultural landscape in the Astarac area of southwestern France, an area from which natural wetlands were eliminated by drainage during the 19th century. Odonata were previously found to reflect consistently the variation in species richness of other pond invertebrates [16]. We therefore used Odonata as biodiversity indicators in our study. Because natural wetlands were absent from the landscape (i.e. no reference conditions), the regional species pool (gamma diversity, southwestern France, ∼116,000 km2) was used to assess the benefit of artificial ponds for the settlement of aquatic communities. The Self-Organizing Map (SOM, neural network) was first used to classify the ponds according to their Odonata assemblages, in an attempt to interpret the spatial variability of the communities within the ‘pondscape’. Then, General Linear Modelling (GLM) was used to specify the influence of environmental variables related to land use and pond characteristics on species richness.
2 Material and methods
2.1 Study area
The Astarac area (187 km2, Fig. 3) is part of southwestern France, an 116,000-km2 region delineated by the Adour and Garonne Rivers drainage basins. The economy of the Astarac is historically dominated by agriculture. The modern agricultural economy is focussed mainly on maize and wheat growing, cattle rearing on extensive pasture, and duck farming. Water resource being naturally scarce in the Astarac (for geographic and climatic reasons, and as a result of wetland drainage), artificial channels were built in the 19th and early 20th centuries to carry water from the nearby Pyrenees Mountains. At the beginning of the 20th century, each farm also had at least three ponds dug by man to hold rainwater, in order to support local activities. A preliminary inventory based on aerial photographs allowed us to locate 607 ponds [21] in the study area without a priori consideration of their origins (i.e. either natural or anthropogenic). As the area lacked natural ponds, we could be confident that the contribution to biodiversity by ponds was due entirely to waterbodies of anthropogenic origin. Given this, the contribution of farm ponds to freshwater biodiversity was potentially high in the Astarac.
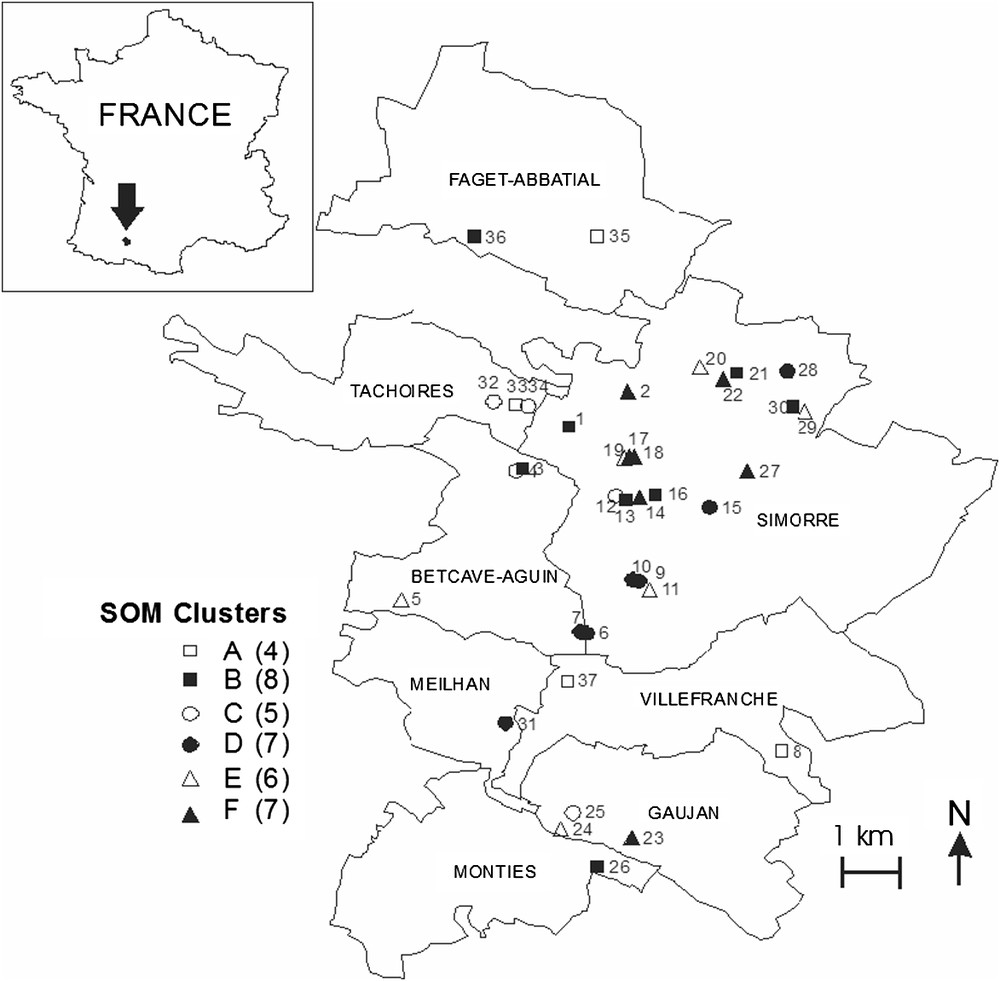
Distribution of the study ponds in the Astarac region, and correspondence with their location (clusters) on the Self-Organizing map (see also Fig. 1).
We studied 37 manmade ponds. Twenty-seven ponds actually provided different types of services: cattle watering (14 ponds), irrigation (7 ponds), duck farming (3), ornament (2), baitfish reservoir (1), whereas the 10 remaining ponds were abandoned. Each pond was described using 6 landscape variables: % bare area (any mixture of substrates made of rocky outcrops, soil, stones, gravel and/or mud, deprived of vegetation), % prairie (herbaceous areas dominated by graminaceous plants), % fields (arable crops), % bushes and % forest in a 800-m radius, and distance to the nearest pond (m). These landscape variables were chosen because they characterise the location of ponds within the landscape mosaic, and they are easy to describe by combining direct observations with examinations of aerial photographs (this study), or using a Geographic Information System [22]. At each pond, seven habitat variables were measured: surface area, maximum depth, water transparency (measured as Secchi depth, disc ), % submerged vegetation, % emergent vegetation, % floating-leafed vegetation and % shading. The presence of fish and ducks, and the service supplied were also recorded as descriptive variables. The use of such simple variables in a successful final model could reduce the effort and cost of data collection for subsequent biological management applications [23].
2.2 Odonata sampling
Each pond was sampled for larvae, exuviae, and adults in spring (March) and summer (July) 2004, to take into account insect seasonality. First, larvae were sampled at each date, by intensive sweeping of a hand net (mesh size = 250 μm) through the various mesohabitats (i.e., net sweeping for a fixed time period [22]). The time effort in each mesohabitat (e.g., submerged vegetation, silt, Typha stems) was proportional to its surface area, and the total sampling time was 15 min for each pond as a whole. Second, in order to maximize the species list and to tackle possible taxonomic uncertainties, adult individuals were also sampled in March and July 2004 with a butterfly net on sunny days (air temperature >20 °C, no wind). Each pond was sampled during 2 h between 12:00 and 16:00. Species were considered as ‘present’ at a given pond if there was evidence of their autochthony (mating and/or oviposition was (were) observed, presence of exuviae). Last, larval exuviae were collected around the ponds. Exuviae were mostly useful in confirming larval and adult identifications. All identifications were pooled in a single species list, which allowed us to build the presence/absence matrix (). Adequacy of sampling was verified using a sample-rarefaction curve with 500 randomizations. Accumulation of new species was approaching an asymptote, so we considered that our sampling was satisfactory.
Invertebrates were preserved in the field in 5% formalin. Odonata species were identified in the laboratory (Table 2), and then preserved in 70% ethanol.
List of the Odonata species occurring in southwestern France (116,000 km2, delineated by the Adour and Garonne Rivers drainage basins), and in our study ponds (Astarac area, 187 km2; + = presence)
| Gamma diversity (regional pool) | Study ponds | Regional distribution | Habitat |
| ZYGOPTERA | |||
| Calopterygidae | |||
| Calopteryx haemorrhoidalis (Vander Linden, 1825) | Rare | Running | |
| Calopteryx splendens (Harris, 1776) | Rare | Running | |
| Calopteryx xanthostoma (Charpentier, 1825) | Common | Running | |
| Calopteryx virgo (L., 1758) | Common | Running | |
| Lestidae | |||
| Lestes viridis (Vander Linden, 1825) | + | Common | Still/running |
| Lestes barbarus (Fabricius, 1798) | + | Rare | Still |
| Lestes dryas (Kirby, 1890) | Rare | Still | |
| Lestes sponsa (Hansemann, 1823) | Rare | Still | |
| Lestes virens (Charpentier, 1825) | Rare | Still | |
| Sympecma fusca (Vander Linden, 1820) | Rare | Still | |
| Platycnemididae | |||
| Platycnemis acutipennis (Sélys, 1841) | + | Common | Running/still |
| Platycnemis latipes (Rambur, 1842) | Common | Running/still | |
| Platycnemis pennipes (Pallas, 1771) | + | Common | Running/still |
| Coenagrionidae | |||
| Cercion lindenii (Sélys, 1840) | + | Common | Still/running |
| Ceriagrion tenellum (de Villers, 1789) | + | Rare | Running/still |
| Coenagrion caerulescens (Fonscolombe, 1838) | Rare | Running (slow) | |
| Coenagrion hastulatum (Charpentier, 1825) | Rare | Still | |
| Coenagrion lunulatum (Charpentier, 1825) | Rare | Still | |
| Coenagrion mercuriale (Charpentier, 1840) | Rare | Running/still | |
| Coenagrion puella (L.,1758) | + | Common | Still |
| Coenagrion pulchellum (Vander Linden,1825) | + | Rare | Still |
| Coenagrion scitulum (Rambur, 1842) | + | Rare | Stll/running |
| Enallagma cyathigerum (Charpentier, 1840) | + | Common | Still |
| Erythromma najas (Hansemann, 1823) | Rare | Running/still | |
| Erythromma viridulum (Charpentier, 1840) | Rare | Running/still | |
| Ischnura elegans (Vander Linden, 1820) | + | Common | Still |
| Ischnura pumilio (Charpentier, 1825) | Rare | Still/running | |
| Pyrrhosoma nymphula (Sulzer, 1776) | + | Common | Still/running |
| ANISOPTERA | |||
| Aeshnidae | |||
| Aeshna affinis (Vander Linden, 1820) | Rare | Still | |
| Aeshna cyanea (Müller, 1764) | Common | Still | |
| Aeshna grandis (L., 1758) | Rare | Still | |
| Aeshna isoceles (Müller, 1767) | Rare | Still | |
| Aeshna juncea (L., 1758) | Rare | Still | |
| Aeshna mixta (Latreille, 1805) | Rare | Still | |
| Anax imperator (Leach, 1815) | + | Common | Still |
| Anax parthenope (Sélys, 1839) | Rare | Still | |
| Boyeria irene (Fonscolombe, 1838) | Common | Running | |
| Brachytron pratense (Müller, 1764) | Rare | Still | |
| Gomphidae | |||
| Gomphus graslinii (Rambur, 1842) | Rare | Running | |
| Gomphus pulchellus (Sélys, 1840) | + | Rare | Still |
| Gomphus simillimus (Sélys, 1840) | Rare | Running | |
| Gomphus vulgatissimus (L., 1758) | Common | Running/still | |
| Onychogomphus forcipatus (L., 1758) | Common | Running/still | |
| Onychogomphus uncatus (Charpentier, 1840) | Rare | Running | |
| Cordulegasteridae | |||
| Cordulegaster bidentata (Sélys, 1843) | Rare | Running | |
| Cordulegaster boltonii (Donovan, 1807) | Common | Running | |
| Macromiidae | |||
| Macromia splendens (Pictet, 1843) | Rare | Running (slow) | |
| Corduliidae | |||
| Cordulia aenea (L., 1758) | + | Rare | Running/still |
| Oxygastra curtisii (Dale, 1834) | Common | Running | |
| Somatochlora arctica (Zetterstedt, 1840) | Rare | Running/still | |
| Somatochlora flavomaculata (Vander Linden, 1825) | Rare | Running/still | |
| Somatochlora metallica (Vander Linden, 1825) | Rare | Running/still | |
| Libellulidae | |||
| Crocothemis erythraea (Brullé, 1832) | + | Common | Running/still |
| Leucorrhinia albifrons (Burmeister, 1839) | Rare | Still | |
| Leucorrhinia dubia (Vander Linden, 1825) | Rare | Still | |
| Leucorrhinia pectoralis (Charpentier, 1825) | Rare | Still | |
| Libellula depressa (L., 1758) | + | Common | Still |
| Libellula fulva (Müller, 1764) | Rare | Running/still(lake) | |
| Libellula quadrimaculata (L., 1758) | + | Common | Still |
| Orthetrum albistylum (Sélys, 1848) | + | Common | Still |
| Orthetrum brunneum (Fonscolombe, 1837) | Common | Running/still | |
| Orthetrum cancellatum (L., 1758) | + | Common | Still |
| Orthetrum coerulescens (Fabricius, 1798) | Common | Still | |
| Sympetrum danae (Sulzer, 1776) | Rare | Still | |
| Sympetrum depressiuculum (Sélys, 1841) | + | Rare | Still |
| Sympetrum flaveolum (L., 1758) | Rare | Still | |
| Sympetrum fonscolombii (Sélys, 1840) | Common | Still | |
| Sympetrum meridionale (Sélys, 1841) | Rare | Still | |
| Sympetrum pedemontanum (Allioni, 1766) | Rare | Still | |
| Sympetrum sanguineum (Müller, 1764) | + | Common | Still |
| Sympetrum striolatum (Charpentier, 1840) | + | Common | Still |
| Sympetrum vulgatum (L., 1758) | Rare | Still | |
| Trithemis annulata (P. de Beauvois, 1805) | Rare | Running/still |
The regional species pool (after [23]) consists of 70 dragonfly species occurring in southwestern France (see Table 2), among which 58 typically live in still- or slow-running waters, whereas 12 are exclusively found in lotic systems [24].
2.3 Modelling procedure
The modelling procedure was conducted in two steps. Ordination and cluster analyses are frequently used in the early exploratory phase of ecological investigations, because their results suggest relationships that deserve more detailed study in subsequent research, whereas regression analyses are helpful in studying more specific questions in the later phases of research. This analysis procedure (ordination and cluster analysis first, then regression analysis) was used in our study. We used two different types of techniques: Self-Organizing Maps (SOM, unsupervised neural network [25]) and General Linear Modelling (GLM). SOM visualization is an indirect gradient analysis, which was used as an analytical tool to bring out relationships between ponds and Odonata assemblages. Then, GLM was used to assess the influence of each environmental variable on species richness.
Combining clustering and ordering abilities, SOM is a powerful tool to pattern species assemblages using site-specific data on species occurrences. The SOM Toolbox (version 2) for Matlab® was used (see [26] for practical instructions). The structure of the SOM for our study consists of two layers of neurons connected by weights (i.e., connection intensities): the input layer is constituted by 23 neurons (one by species) connected to the 37 ponds, the output layer is constituted by 30 neurons (visualized as hexagonal cells) organized on an array with five rows and six columns (see results). During the learning process, a species assemblage is computed for each neuron. The SOM plots the similarities of the data by grouping similar data items together, in a way that can be simply described as follows:
- • the neurons are initialized with random samples drawn from the input data set;
- • the neurons are updated in an iterative way:
- – a sample unit is randomly chosen as an input unit,
- – the Euclidean distance between this sample unit and every neuron is computed,
- – the neuron closest to the input is selected and called ‘best matching unit’ (BMU),
- – the BMU and its neighbours are moved a bit towards the input unit.
As a second step, Generalized Linear Modelling (GLM) was used to specify the relationships between species richness and environmental variables. GLM allows a more versatile analysis of correlation than standard regression methods, because the error distribution of the dependent variable and the function linking predictors to it can be adjusted to the characteristics of the data. Species richness was the dependent variable, with a Poisson error model with a log link function and type-III sum of squares, implemented using the GENMOD procedure of the SAS program (v. 8.2 [28]). Poisson errors are widely used for the analyses of count data [29] and provided a good fit of the model to the data, as judged by the overdispersion parameter. Deviances from the model were scaled with the ratio deviance/degrees of freedom. A stepwise backwards variable removal procedure was used for model selection. From an initial model with all the independent variables considered, the variable improving less significantly the fit of the model (as judged from the partial F test) was removed and the model fitted again. This procedure was repeated until all variables remaining in the model had significant partial F-tests. The same final model was obtained when using a forward stepwise selection procedure (adding variables to the null model until none of the variables not in the model increased significantly the fit).
3 Results
3.1 Species assemblages
The 37 study ponds hosted 23 Odonata species (i.e. about a third of the regional pool found in southwestern France). The species recorded in our ponds belonged to three Zygoptera and four Anisoptera families (Table 2). Seven species (Coenagrion scitulum, Coenagrion pulchellum, Gomphus pulchellus, Sympetrum depressiculum, Lestes barbarus, Ceriagrion tenellum, and Cordulia anae) were ‘rare’ at the regional scale (restricted range). The remaining species were ‘common’ (i.e. widespread on a regional scale) [23] (summarized in Table 2).
The SOM trained with species occurrences had a topographic error of 0.0001. This map thus preserved well the typology of the input data, and was relevant for subsequent interpretations. After training the SOM with species occurrences, the k-means algorithm helped to derive six clear clusters. Thus, ponds were classified into six subsets according to Odonata assemblages (clusters A–F, Fig. 1), i.e. according to the species distribution patterns (Fig. 2). Bottom areas of the SOM had the lowest number of species, whereas top areas showed higher richness. The range of pond area differed significantly between clusters (ANOVA, , , ). Specifically, significant differences in pond area occurred between clusters D, E, and F (Tukey tests, ). However, the clusters of ponds delineated by species assemblages did not differ significantly with regard to other environmental variables ().
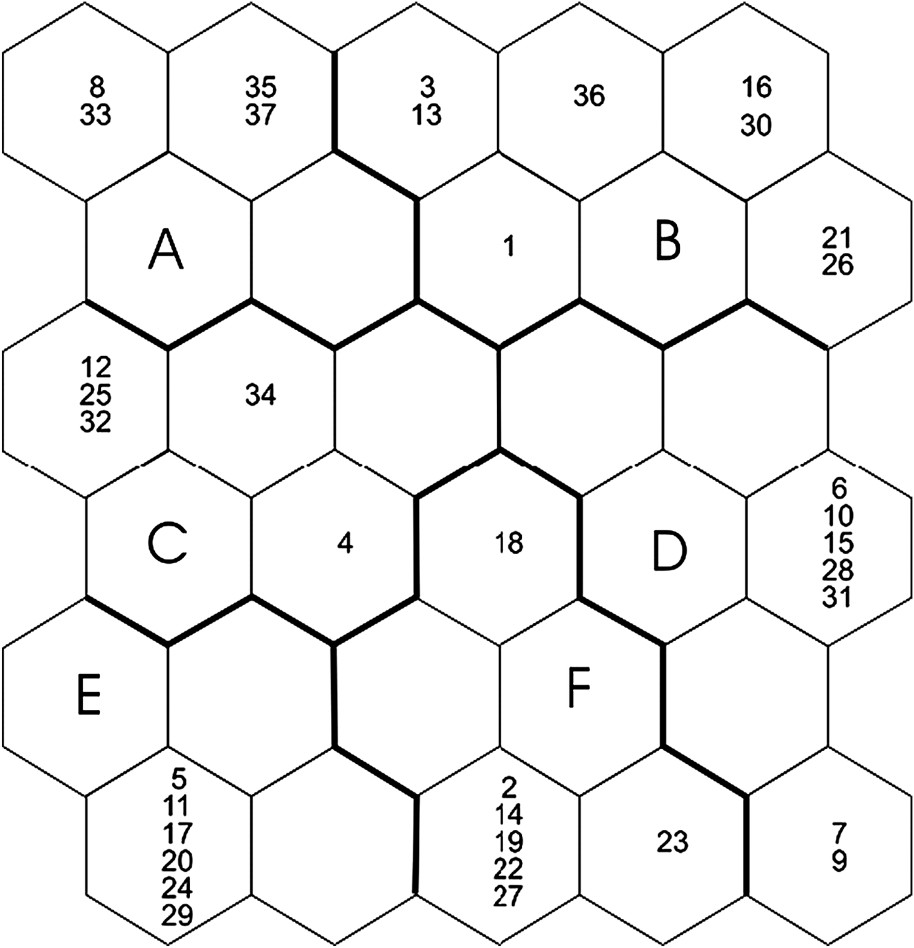
Distribution of ponds on the self-organizing map (SOM) according to the presence or absence of 23 Odonata species, and clustering of the trained SOM. Ponds that are neighbours within clusters are expected to have similar Odonata assemblages. Ponds separated by a large distance from each other, according to Odonata species, are distant in the output space. Codes (e.g., [26,27]) correspond to ponds. Clusters A–F were derived from the k-means algorithm.

Gradient analysis of the probability of occurrence of each species on the trained SOM (see Fig. 1), with visualization in shading scale (dark = high probability of occurrence, light = low probability of occurrence). Each little map corresponding to one species is to compare (or to superimpose) to the map representing the distribution of ponds presented in Fig. 1, thus showing the occurrence probabilities of each species (in gray scale) within each cluster of ponds.
When the distribution of species was visualized on the trained SOM (using a shading scale, see Fig. 2), most species occurred in only one (15 species) or two (five species) clusters of ponds (Fig. 2). They therefore had the strongest influence upon the pond classification, and could in the future be useful as indicator species. Larger ponds (clusters B and D, mean surface area of the and , respectively) had the greatest susceptibility to host most species. The corresponding map units (right and right-upper areas of the SOM) showed high occurrence probabilities for Anax imperator, Libellula depressa, Coenagrion puella, Ischnura elegans, Orthetrum albistylum, and Sympetrum striolatum. However, some species mostly contributed to delineate cluster B (Enallagma cyathigerum, Coenagrion pulchellum, Cercion lindenii, Platycnemis acutipennis, Orthetrum cancellatum, Crocothemis erythraea, Coenagrion scitulum, Gomphus pulchellus). The surface areas of ponds in clusters A, C, E, F ranged from to . Cluster A was characterized by the presence of Sympetrum sanguineum and Libellula quadrimaculata, ponds in cluster C hosted Sympetrum depressiculum and Coenagrion puella, whereas Lestes barbarus, Ceriagrion tenellum, and Platycnemis pennipes contributed to delineate cluster F. Two species, Lestes viridis and Cordulia anae, showed less distinct patterns, and had rather high occurrence probabilities in the right-bottom (clusters F, D) and left-top areas (clusters A, C) of the SOM. Ponds in cluster E were characterized by the absence of Odonata species. When the SOM clusters were plotted on a geographical map of the study area (Fig. 3), they did not correspond to specific sub-areas or locations.
3.2 Species richness
When only lentic species were considered (see Table 2), we calculated that 40% of the regional species pool was captured by our 37 study ponds. The number of species per pond ranged from 0 to 12. The average Odonata richness was 4.5 species () with 20 ponds hosting four to seven species. Finally, Odonata species were absent from six ponds. The GLM model explained 29.5% of the total variance in numbers of species, as estimated by the deviance of the final model (62.95) and that of the null model (89.32). Two variables (pond area and duck absence) were positively correlated with the numbers of species per pond ( and , respectively, Table 1). In summary, GLM primarily suggested a species richness-area relationship (larger ponds supported more species, Fig. 4), whereas the presence of ducks would be detrimental to the species richness of Odonata (Fig. 5).
Model analysing species richness patterns (stepwise regression with backwards model selection)
| Parameter | Estimate | F | df | p |
| Duck absence | 1.1876±0.6892 | 4.44 | 1,34 | 0.04 |
| Surface area () | 0.7521±0.2629 | 8.83 | 1,34 | 0.005 |
| % shading (arc sin) | 3.42 | 1,33 | 0.07 | |
| % bare area (arc sin) | 0.82 | 1,33 | 0.37 | |
| % prairie (arc sin) | 1.28 | 1,33 | 0.27 | |
| % fields (arc sin) | 0.00 | 1,33 | 0.97 | |
| % bushes (arc sin) | 0.18 | 1,33 | 0.68 | |
| % forest (arc sin) | 0.61 | 1,33 | 0.44 | |
| % submerged vegetation (arc sin) | 0.16 | 1,33 | 0.69 | |
| % emergent vegetation (arc sin) | 2.23 | 1,33 | 0.15 | |
| % floating-leafed vegetation (arc sin) | 0.50 | 1,33 | 0.49 | |
| Fish presence | 0.23 | 1,33 | 0.63 | |
| Richness of habitats | 0.06 | 1,33 | 0.81 | |
| Presence of submerged vegetation | 0.01 | 1,33 | 0.93 | |
| Distance to the nearest pond () | 0.03 | 1,33 | 0.86 | |
| Maximum depth () | 1.36 | 1,33 | 0.25 | |
| Transparency () | 1.28 | 1,33 | 0.27 |
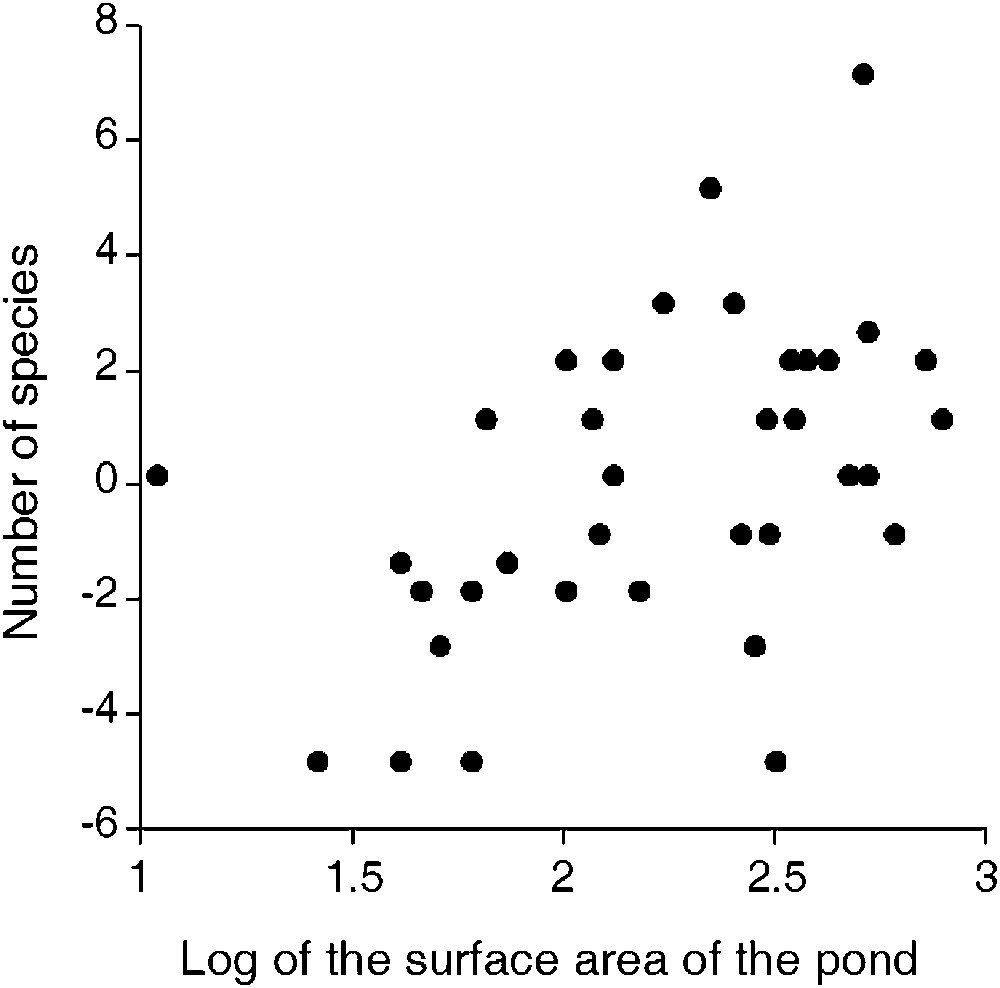
Relationship between number of Odonata species (corrected for duck use of the pond) and surface area of the pond ( transformed).

Least squares means for the number of Odonata species in each pond according to duck presence, and after correcting for differences in surface area between ponds. The model was fitted with a Poisson error distribution and a natural logarithm link. After back-transformation, the mean numbers of species for ‘duck-absent’ and ‘duck-present’ ponds was 4.54 and 1.38 species, respectively.
4 Discussion
In the Astarac area, the number of species per pond was low compared to areas at similar elevations in Europe [30,31]. However, the potential pool of colonists in the surrounding region was made of 58 species (if only still-water species were considered). Our samples therefore highlight how a small set of artificial ponds may sustain an important fraction (40%) of the larger regional species pool in landscapes where natural freshwater ecosystems are lacking. Species richness and the presence of rare species are frequently cited criteria for site selection by conservationists [32]. Thus, if manmade habitats only attract the common species, one may argue that they do not make a significant contribution to biodiversity. Conversely, rare species are of special interest [33], and it was recently demonstrated that areas that carry rare species might also concentrate an important fraction of the regional biodiversity of aquatic insects [34]. Since farm ponds hosted both rare and common odonates, our results support the idea that agricultural landscapes containing manmade ponds can make a significant contribution to freshwater biodiversity [35].
Larger ponds supported more species. Possible explanations for positive species–area relationships (SAR) are that larger ponds are more easily colonized by immigrants, and/or are likely to show a greater habitat complexity (a higher diversity of ecological niches), facilitating the coexistence of a larger number of species, including species with particular ecological requirements and opportunists. The slope of species–area relationships is of particular interest to understand the ecological mechanisms playing behind the distribution of species [36], because higher slopes indicate faster accumulation of species per increase of unit area and low turnover of species among sites. In our study, the SAR would have a slope of 0.36 (after -transformation of richness and areas), which is higher than the average value of 0.27 proposed by Drakare et al. [37]. Lower values were also reported for aquatic plants (0.073–0.189), Gastropoda (0.108–0.114) and Odonata (0.129), suggesting that, for these taxa, area is of secondary importance in determining pond biodiversity [38]. On the scale of small ponds, it seems unlikely that size has an effect on the ‘chance’ to be colonized by animals like odonates. However, the SAR found in our study system suggests a fast accumulation and a slow turnover of species among ponds. The SOM classification allowed us to bring out five species groups (the sixth cluster being defined by ponds deprived of Odonata). Concordant spatial patterns for subsets of species may result from random mechanisms, biotic interactions, common environmental determinants, or spatial covariance in different environmental factors that independently account for spatial distribution in different species. When local systems are compared (this study), it is likely that species assemblages are rather shaped by biotic factors such as spatial dynamics (dispersal, colonization) [39], biological traits of the species, and local interactions [40,41]. Ducks, and aquatic birds in general, may be important determinants of aquatic system structure. Predation by ducks has important effects on macrophyte abundance [42,43], and on benthic organisms [44]. Our results suggest that the presence of duck is associated with low numbers of Odonata species. This effect could be related to direct predation by ducks, since both adults and larvae of Odonata form part of the diet of many waterbird species, including ducks [45]. Other indirect effects could be related to the negative impact of waterbirds on macrophyte abundance [46]. However, our results did not support this hypothesis, because macrophyte presence (or relative abundance) was not correlated with Odonata richness.
During the last decade, conservation biology has been dominated by the goal of preserving biodiversity hotspots and/or emblematic species, a strategy that has been often debated [47]. Natural and manmade ecosystems provide a wide variety of resources that have a social and economic value, calling for more attention on the importance of ecosystems to both people and biodiversity [48]. Our data set describing Odonata species in farm ponds showed that small, artificial waterbodies can efficiently sustain aquatic life in agricultural landscapes lacking natural surface waters. Almost all ponds, at different size, with different habitat features, and offering different services, contributed to the diversity of Odonata assemblages, even if individual ponds hosted few species. It is thus likely that landscape and pond variables contributed to realize a mosaic of habitats that was more or less attractive to many species with different requirements. As a consequence, when possible, pond networks should primarily be preserved, rather than attempting to target some bodies of water for particular management actions. Nevertheless, the species richness hosted by ponds was mostly related to some well-known ecological patterns and almost certainly to biotic factors, although the ponds were subjected to different uses. Hazell et al. [49] compared the frog assemblages of constructed and natural ponds in an agricultural landscape in southeastern Australia. They found that habitat characteristics and predation were the most important factors shaping the frog assemblages, whatever the origin (constructed or natural) of the ponds. Such results suggest that manmade ponds may have substantial conservation value. There is, therefore, a possibility to consider a positive added value when calculating the cost/benefit ratio of constructing water bodies for human activities. At the same time, they should be protected from threats such as natural filling at late-successional stages or pollution [3,17]. Finally, further understanding of the distribution of biological diversity in non-natural systems may facilitate the adoption of positive solutions for wildlife, with limited costs for human activities. Such an understanding is expected to help in planning management and conservation efforts.
Acknowledgements
M. Dessaivre and D. Hanquet contributed to the study design, fieldwork, and invertebrate sorting. Prof. G. Carchini provided valuable comments on a draft version of this manuscript. This study was funded by the French Water Agency (‘Agence de l'eau Adour–Garonne), DIREN and ‘Conseil régional Midi-Pyrénées’. Two anonymous reviewers provided helpful comments on an earlier version of this paper.