

1 Introduction
A dramatic increase of synthetic fertilizer nitrogen (N) consumption has occurred in the world during the past 40 years [1–3]. Today, to meet the food demands of 1.3 billion people, China has become the largest N consumer in the world, with approximately 22 Tg (Tg = 1012 g) of synthetic N fertilizer in 2002. Substantial N fertilizer application to farmland has led to many environmental problems, such as groundwater contamination, and this was especially serious in intensive vegetable cultivation areas in China. Nitrate pollution to groundwater became the potentially prominent threat to the health of the local population [4–7]. At present, people clearly know that the source of contamination is mainly from overuse of commercial N fertilizer in agricultural production areas; however, N must be added to the soil to sustain food, feed, and fiber production.
A range of study patterns has been developed to evaluate nitrate pollution to date. Lysimeter have been successfully used in numerous case studies to measure nitrate leaching in agricultural ecosystems [8–11]. Several empirical or conceptual models, in conjunction with suction cup studies, were established to simulate nitrate leaching through unsaturated soil and to describe nitrogen transformation [12–15]. On-the-spot investigations on groundwater were another direct and effective pattern to evaluate nitrate contamination [5,16–18]. Of all the nitrate studies, there is a great discrepancy between developed and developing countries. Data showed that nearly two-thirds of the total N was consumed in the developing countries [1]. A substantial quantity of fertilizer was misused, and squandered on the soil for the lack of agricultural information and technology. As the largest N consumer, there are active demands for policy and technical support to agricultural production in China, but unfortunately, few study works have been made to evaluate and measure nitrate pollution to the agricultural ecosystem.
Intensive vegetable crop cultivation is highly susceptible to nitrate loss via leaching [19]. In China, groundwater N contamination has also caused much concern, especially in regions with intensive agricultural production, such as intensive vegetable production. Drinking water in the plain comes exclusively from groundwater sources and, therefore, keeping its nitrate-N below the maximum contaminant level is important. However, few field studies have determined the losses of nitrate due to leaching from vegetable crops receiving different N-based fertilizers until recent years [20]. Drainable lysimeter offers a direct approach to monitoring nitrate leaching to groundwater [2,21]. In this study, lysimeter was first introduced to intensive greenhouse vegetable production in China.
The objectives of this paper were to: (i) ascertain how much of N is lost, and when leaching is most likely to occur, under traditional management practices; (ii) evaluate a partial N balance in protected vegetable fields. The present study will assist people to identify scenarios susceptible to groundwater nitrate-N contamination, minimize nitrate leaching, and improve those aspects of the current N management to better fertigation practices.
2 Materials and methods
2.1 Research site description
The field experiment was conducted on nine representative, typical fields in Shouguang (118°44′E longitude and 36°52′N latitude), Shandong Province (Fig. 1). Precipitation averages 593.8 mm year−1 (from 1964 to 2004) with most of the annual precipitation occurring from June to August. It has an area of 2180 km2, and protected vegetable cultivation accounts for up to 55% of the arable land area use, as it is a major vegetable production base in China. For the semiarid climate, groundwater is the major source for agricultural irrigation and for drinking water. Because of the cover of polyethylene film, there is no rainfall input to the field in the plastic greenhouses and the internal temperature ranged from 12 to 45 °C annually, with a mean of 25 °C [7]. Furrow irrigation is typically used in the region. Major management practices applied to each plot are summarized in Table 1, and some physical and chemical properties of soil from the experimental sites are listed in Table 2.
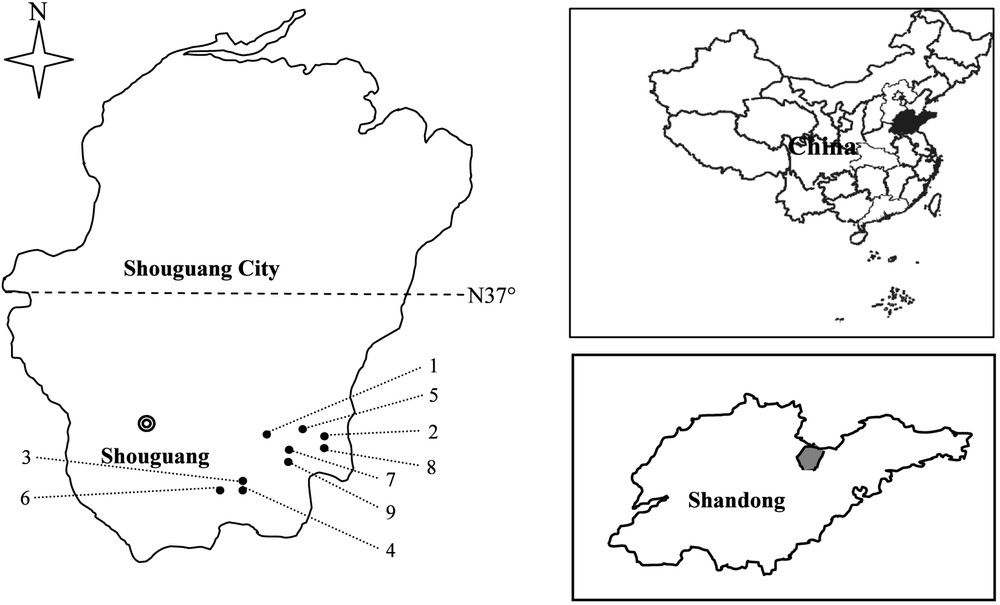
Location of the study sites in Shouguang, Shandong, China.
Crops planted in, and some properties of 9 greenhouses investigated.
| Field | Village name | Planting crop | Acreage (m2) | Farming years | Growing period (d) |
| 1 | Changleying | Casaba | 700 | 4 | 90 |
| 2 | Tanhe | Hot pepper | 500 | 1 | 70 |
| 3 | Zaohu | Hami cantaloupe/Yardlong cowpea | 540 | 1 | 130 |
| 4 | Zaohu | Hami cantaloupe | 540 | 6 | 70 |
| 5 | Hegou | Cucumber | 589 | 6 | 110 |
| 6 | Songjiazhuang | Casaba | 540 | 4 | 80 |
| 7 | Guanlu | Tomato | 506 | 2 | 120 |
| 8 | Tanhe | Sweet pepper | 730 | 2 | 110 |
| 9 | Guanlu | Hot pepper | 350 | 9 | 130 |
Soil properties from nine vegetable fields.
| Soil depth (cm) | Soil texture⁎(%) | Bulk density (g cm−1) | Total N (g kg−1) | Organic C (g kg−1) | pH (H2O 1:1) | ||
| Sand (2–0.05 mm) | Silt (0.05–0.002 mm) | Clay () | |||||
| 0–30 | 36 ± 5 | 61 ± 5 | 3 ± 1 | 1.22 ± 0.22 | 0.8 ± 0.3 | 11.2 ± 5.2 | 6.7 ± 0.4 |
| 30–60 | 31 ± 7 | 65 ± 6 | 3 ± 1 | 1.22 ± 0.11 | 0.4 ± 0.1 | 6.8 ± 4.8 | 6.8 ± 0.3 |
| 60–100 | 32 ± 12 | 64 ± 11 | 4 ± 1 | 1.24 ± 0.14 | 0.3 ± 0.1 | 4.9 ± 3.0 | 6.9 ± 0.2 |
⁎ Classification from USDA (United States Department of Agriculture).
2.2 Lysimeter installation and meteorological measurements
Nine foursquare drainable lysimeters (1 m2) were installed in the field of nine plastic greenhouses in November 2004, as described by Gasser et al. [22]. On the ground above the lysimeter, two-row crops were planted with a 0.6-m space in a 0.8-m bed. A 2.5-cmdiameter hose links the lysimeter to the collection vessel. The access device was a 2-m-long, 160-mm-diameter Polyvinyl Chloride (PVC) tube, which was mostly buried in the soil with its 20-cm upper part above the ground. The seepage water from each lysimeter was collected in the PVC tube, from which a sample was taken for N analysis. Then the container was emptied for the next collection. Uniform agricultural management practices were conducted between lysimeter and the surrounding plot in the plastic greenhouse [11,22].
Temperature, rainfall, and other meteorological parameters were monitored at an automated weather station located less than 0.5 km from the field site. All the climatic sensors were installed at 1.5 m above ground level.
2.3 Sampling and data collection
Various N fertilizer sources are available for vegetable crops, but under the farmer's routine management practices, these fertilizer products, other than base fertilizers (mainly manures), must be highly soluble and fast-release N sources so that they can be applied to soils in conjunction with furrow irrigation.
Leachate samples from soil profile were collected fortnightly during the growing season, or more frequently as needed, depending on the irrigation schedule. Irrigation water was measured with a water meter and sampled directly from the irrigation hose at monthly intervals throughout the whole cropping season. Plastic bottles (50 ml) were filled with the water samples, immediately frozen and transported to the laboratory for storage until thawed prior to N analysis. N leaching losses were calculated from the product of nitrate and ammonium concentrations and water fluxes.
Soil mineral N (NH4-N and NO3-N) was measured by sampling soils using a soil auger at the beginning and end of the cropping season. Nine soil cores were obtained from each soil layer (0–30, 30–60, 60–100 cm) using recommended procedures for vegetable fields. Samples were immediately saved in a plastic foamed-lined box at 4 °C, transported to the laboratory for storage and analysis.
Fertilizer N input was calculated from application rates and N content of each fertilizer product. Crop N was estimated from stochastic sampling of ten labeled plants at the beginning of the growing season. The selected plants were separated into stems, leaves and fruits (without consideration of residues below the ground) in for total N determination using the recommended procedure. Irrigated N input was calculated from cumulative amounts and N content of irrigation water for each time.
2.4 Laboratory measurements and analysis
Soil texture was determined using Laser Grain-size analyzer (Mastersizer 2000, MALVERN), and the other properties were surveyed by conventional measuring methods. Total plant N was measured using an automated Kjeldahl digestion procedure.
Nitrate and ammonium in leachate and irrigation water were determined using colorimeter procedures on a scientific instruments continuous flowing analytical system (TRAACS 2000). Mineral N in soil samples were extracted using 0.01 M CaCl2 solution (soil : solution ratios of 1:10), shaken for 1 h, and filtrated to a 50-mL plastic bottle for frozen storage until nitrate and ammonium analysis. Plant straw samples were oven-dried at 70 °C and ground to a 0.5-mm powder.
2.5 Mass balance
A partial mineral N balance equation [13,22,23] was introduced for each greenhouse by considering inputs (N from mineral organic fertilizers, and irrigation water), outputs (leached N and crop N exported at harvest) and soil mineral N variations (0–100 cm) for a cropping season. Other nitrogen unaccounted in the balance sheet includes N from mineralization/immobilization, ammonia volatilization and denitrification, and was estimated by difference:
All statistical analyses were performed using SPSS version 11.5.
3 Results and discussion
3.1 Irrigation
From late February to early March, the nine fields were cultivated, fertilized and irrigated in company with plants explanting. There is an obvious discrepancy in the total irrigation levels among the nine fields during the growing season (Table 3). Field 1 received the minimum amount, a total of 492 mm water, while the maximum irrigation water of 1446 mm was applied to field 9, a nearly two-fold excess quantity. This could be attributed to differences in growing days and management practices of the growers. Throughout the whole cropping season, a similar water amount for each irrigation event was applied to individual fields, but different irrigation times, ranging from 7 to 12 times for the nine fields, resulted in apparent differences of total irrigation water amounts.
Water irrigation amounts and leached water flux from 9 fields.
| Field | 1 | 2 | 3 | 4 | 5 | 6 | 7 | 8 | 9 | Average | S.D. |
| CLY | TB | ZB | ZN | HG | S | GB | TN | GN | |||
| Irrigation amounts (mm) | 492 | 659 | 1024 | 665 | 846 | 1216 | 516 | 1121 | 1446 | 887 | 334 |
| Leached water flux (mm) | 100 | 82 | 129 | 71 | 97 | 119 | 89 | 104 | 102 | 99 | 18 |
| % | 20 | 12 | 13 | 11 | 12 | 10 | 17 | 9 | 7 | 12 | 4 |
3.2 Percolation rates
Because of the limited volume of the collection vessel, seepage water was collected and sampled 2–3 times for each irrigation event. However, in most cases, the water percolation occurred within 3 days and then little and even no water collection occurred, until the advent of the next irrigation event.
Total amounts of irrigation water inputs and leaching water losses are summarized in Table 3. Compared with the large amounts of irrigation water, little but a steady flow of water was percolated beyond the 1-m soil profile during the growing season. Total water leaching losses ranged from 54 to 129 mm, accounting for () of the total irrigation water. This was similar to some reports [24,25], but greatly lower than results in other previous studies [7,15]. In case of field 1, a high seepage level of water, 100 mm, was collected, despite the smallest amount of total irrigation water application, while only 102 mm of seepage water was collected from field 9 with the largest irrigation water input. This can be explained by the fact that high evapo-transpiration resulted in quick water losses in the form of gas under the internal microclimate of the plastic greenhouse; in addition, a loamy soil caused a slower percolation rate of water. Therefore, relatively little water was collected from the soil profile.
3.3 Nitrate leaching concentration
The mineral concentrations N of water samples from each lysimeter were determined. As expected, the ammonium concentration for seepage water was shown to maintain a relatively low level () in comparison with nitrate content, and thus nitrate was regarded as the N leaching losses.
Of all the water samples from the nine drainable lysimeters, nitrate concentrations were uniformly higher than 10 mg L−1, the acceptable standard level for drinking water. Despite the differences among the nine fields, a variation trend of partial normal distribution in nitrate concentration of water leachates was observed, Table 4. At the beginning of the seedling stage, from the grower's perspective, the plant has a weak nutrient demand and thus little or no additional fertilizer application was needed. Due to this, a relative low nitrate level was observed. In this period, N residues in the soil profile from the previous crop rotation and base fertilizers mainly contributed to leaching N losses. In addition, a higher initial nitrate concentration of seepage water was observed in fields 4 and 5, which received large quantities of barnyard manure (duck) and diammonium orthophosphate, respectively. As time went on, soluble organic and inorganic N fertilizers were applied to the field along with irrigation [26]; meanwhile, the high temperature and the low C/N ratio enhanced the N mineralization and leaching under the internal microclimate in the plastic greenhouse. All the above factors resulted in the increasing nitrate concentration from seepage water.
Average nitrate concentration of water samples from 9 lysimeters during a growing season (mg N L−1).
| Field | Sampling no. | Average | S.D. | |||||||||||
| 1 | 2 | 3 | 4 | 5 | 6 | 7 | 8 | 9 | 10 | 11 | 12 | |||
| 1 | 61 | 110 | 133 | 181 | 184 | 280 | 160 | 210 | 165 | 66 | ||||
| 2 | 22 | 42 | 108 | 135 | 195 | 220 | 357 | 100 | 70 | |||||
| 3 | 26 | 33 | 110 | 138 | 145 | 179 | 200 | 189 | 167 | 151 | 155 | 139 | 136 | 55 |
| 4 | 125 | 205 | 240 | 194 | 248 | 213 | 283 | 215 | 50 | |||||
| 5 | 81 | 150 | 130 | 172 | 305 | 320 | 290 | 202 | 206 | 89 | ||||
| 6 | 45 | 230 | 380 | 277 | 320 | 300 | 340 | 380 | 330 | 293 | 289 | 97 | ||
| 7 | 30 | 114 | 205 | 184 | 200 | 210 | 234 | 215 | 233 | 181 | 67 | |||
| 8 | 17 | 43 | 90 | 225 | 150 | 145 | 180 | 200 | 235 | 250 | 154 | 81 | ||
| 9 | 50 | 60 | 69 | 222 | 457 | 385 | 330 | 380 | 349 | 260 | 256 | 150 |
We can observe that a hysteresis effect of input N variation on nitrate leaching was recorded and it reflected on the concentration fluctuation of water leachates in comparison to the foregoing irrigation event during the growing season (Table 4). It indicated that temporal N application did not immediately find expression in seepage water, but occurred at the next irrigation event. This phenomenon apparently focused on the peak nitrate concentration for each lysimeter throughout the cropping season, which indicated the maximum N application in conjunction with the last irrigation event. Under local practices, sustainable fertilizer applications were synchronized with the growth of the commercial vegetable products. Once crop productivity declined at the harvest anaphase, economic consideration caused little or no nutrient application to the soil with only irrigating water input. This explained the decrease of nitrate concentration. During this period, the source of nitrate leaching comes from the applied fertilizer N residues and mineralization of manures and soil organic matter.
3.4 Nitrate leaching losses
Nitrate leaching losses were calculated for all the fields. Since the similar seepage water rates for each time were collected from the individual lysimeter, even if under various irrigation events during the growing season, nitrate leaching depended mainly on the N content of water leachates. Therefore, the similar variation trends occurred in N leaching losses for each field. In addition, the irrigation schedules suitable for different growing period of various vegetable crops also resulted in differences in cumulative nitrate leaching losses, ranging from 152 to 347 kg N ha−1 (Table 5). In comparison, Romas [13] reviewed a predicted equation for nitrate leaching losses in vegetable production as follows:
Nitrogen rates (kg ha−1) distribution balance for a cropping season.
| Greenhouse | N inputs | Total | N outputs | Soil mineral Na variation | Unaccounted N | ||||||||
| Mineral fertilizer | Organic fertilizer | Irrigation water | Nitrate leaching | Crop uptake | |||||||||
| Rate | % | Rate | % | Rate | % | Rate | % | Rate | % | ||||
| 1 | 325 | 68 | 8 | 2 | 144 | 30 | 579 | 169 | 29 | 219 | 38 | −39 | 231 |
| 2 | 190 | 30 | 170 | 27 | 268 | 43 | 493 | 154 | 31 | 227 | 46 | −3 | 115 |
| 3 | 493 | 38 | 310 | 24 | 482 | 38 | 1316 | 261 | 20 | 298 | 23 | −48 | 806 |
| 4 | 207 | 31 | 154 | 23 | 300 | 45 | 694 | 152 | 22 | 122 | 18 | −225 | 645 |
| 5 | 501 | 58 | 190 | 22 | 169 | 20 | 973 | 199 | 20 | 289 | 30 | −50 | 535 |
| 6 | 504 | 39 | 185 | 14 | 603 | 47 | 1296 | 347 | 27 | 196 | 15 | 63 | 690 |
| 7 | 300 | 57 | 166 | 32 | 59 | 11 | 552 | 158 | 29 | 296 | 54 | −75 | 173 |
| 8 | 328 | 56 | 186 | 32 | 73 | 12 | 565 | 155 | 27 | 244 | 43 | −232 | 401 |
| 9 | 391 | 34 | 240 | 21 | 523 | 45 | 1060 | 255 | 24 | 366 | 35 | −514 | 953 |
| Average | 360 | 46 | 179 | 22 | 298 | 32 | 836 | 183 | 22 | 251 | 33 | −125 | 528 |
a Variation in soil mineral N content (100 cm depth).
3.5 Partial N balance
Under the local traditional management practices, vegetable crops receive frequent fertilizer applications, which totaled from 333 to 803 kg ha−1 (Table 5). For the nine fields, the applied fertilizer N greatly exceeded the crop uptake N, ranging from 122 to 366 kg ha−1. Additional N from irrigation varied from 59 to 603 kg ha−1 for various fields during the growing season. The initial and final amounts of soil mineral N was determined at the beginning and end of the cropping season. Data showed that the initial N contents in the soil profiles were significantly different between the fields before planting. Previous works in this region showed that large variability in N contents of 1.2-m soil profile between different culturing years [27,28]. The soil mineral N variation was mostly negative values, ranging from −3 to , indicating the N losses from the 1-m soil column. A previous study showed that the rational ratio of total input N to crop N is 2:1 [29], but in this study, it was much higher than the limit, with mean 3.8:1.
A linear regression is observed in this experiment between leaching N loss and total N surplus in nine fields (Fig. 2). The slope indicates that about 18% of each N unit input is leached out of the root zone and maybe go downwards to the groundwater. The intercept would mean a net value of 78 kg N ha−1 N loss comes from previous residue N and soil organic matter, even if no N is added by growers.
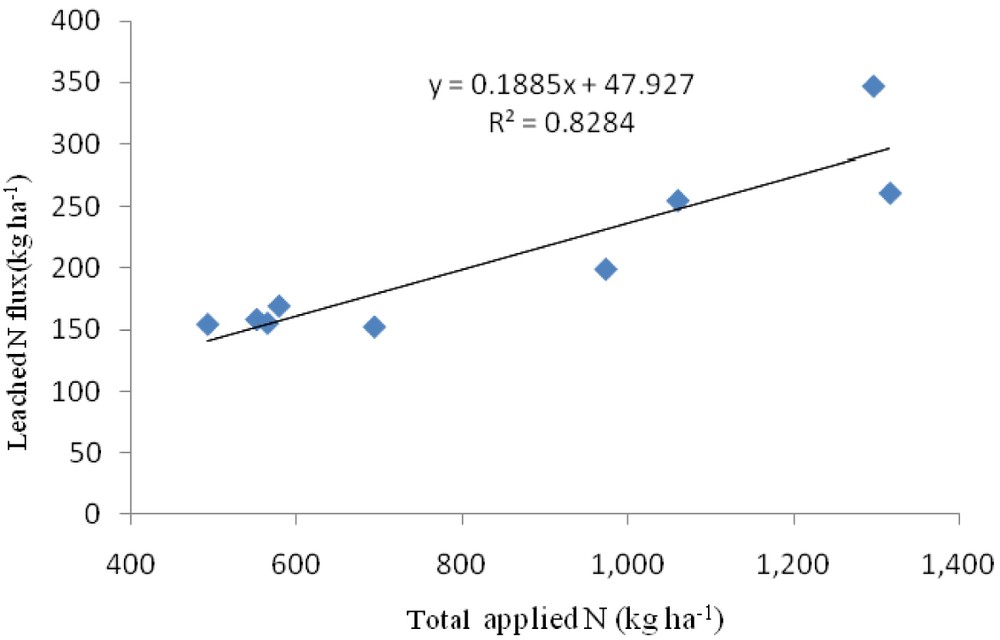
A linear trend between total applied N and leached N flux.
After a cropping season survey period, a partial balance sheet was built up and listed at Table 5. In each partial balance sheet for the nine vegetable fields, the proportion of crop exported mean () of total N inputs, and nitrate leaching losses accounted for (12–40%). Other N “losses” were included in unaccounted N. The highest mineral N fertilizer use and the highest well water N input were recorded for field 6, which brought the highest leaching losses and a low level of crop N. Also, a higher amount of organic fertilizer (duck manure) was applied to soils as base fertilizer. However, it greatly exceeded the crop requirement and resulted to the lowest fertilizer efficiency. Conversely, the lowest mineral fertilizer N and low total N use for field 2 had the lowest nitrate leaching losses. This result was in harmony with other studies [3,22,30]. Approximately half of total N inputs were unutilized as the unaccounted N.
Irrigation also had a great effect on nitrate leaching (Table 5). N from irrigation water, usually ignored, now accounted for an important proportion, ranging from 11% to 47% with an average 32% of total input N. A monthly survey of irrigation water of nine fields showed that nitrate N concentration ranged between 5–82 mg L−1, in most case greater than 10 mg L−1, indicating serious nitrate pollution to groundwater. Another recent investigation on 15 specific shallow wells in intensive vegetable cultivation areas showed a nearly 3-fold increase in N content of groundwater since 1996 [6]. In China, vegetable plastic greenhouses are usually located around the rural village for easy access, and this enhances the potential threat to the health of the local population.
4 Conclusion
These results revealed that under local agricultural practices, traditional fertilizer N application greatly exceeded the capacity of crop uptake and inevitably led to massive nitrate-N getting into groundwater during intensive vegetable production. Drastic nitrate leaching losses were observed with high nitrate concentrations in seepage water from drainable lysimeters during a growing reason. A partial mineral N balance sheet confirmed only 33% of the total N inputs were utilized by the crops with low fertilizer N efficiency. N loss of nitrate leaching ranged from 152 to 347 kg N ha−1, which gave a large load to the unsaturated soil profile and groundwater. In addition, survey on specific shallow wells confirmed present nitrate contamination to groundwater in the experimental sites.
In our perspective, frequent irrigation and high fertilizer N application resulted in low fertilizer efficiency and high nitrate leaching losses at present. Further studies should be conducted to assess whether and to what extent the traditional cultivation practices can be revised to an optimum level without yield decline. Best management alternatives integrating local agronomic practices should be recommended to local government to be implemented as detailed legislative policy, but this needs time. In our opinion, delay and conservative N application, integrated with a reasonable irrigation schedule can be suggested as an effective and necessary solution to alleviate nitrate leaching.
Acknowledgements
This research was supported by the National Ecology Key Project of Beijing (XK10019440), Urban Agriculture project of Beijing (XK100190553), National Nature Science Foundation of China (No. 40701077), China's Post-doctoral Science Fund (No. 20080430567).