

1 Introduction
Barley, Hordeum vulgare L., is one of the earliest cultivated crops in the world. The study of its origin, genetic diversity, and evolutionary relationships in barley is of both academic importance and useful as a guide to the effective conservation and optimal use of the vast gene resources of wild germplasm. Chinese cultivated barley originated from the Qinghai–Tibet Plateau which is considered to be “the roof of the world” [1]. Tibetan wild close relatives of barley are distributed throughout Qinghai–Tibet Plateau of China and its vicinity and are regarded as the progenitor of cultivated barley [2]. Since their discovery in Tibet [1], wild close relatives of barley have attracted wide interest around the world. Of particular interest is the role that the Tibetan wild close relatives of barley had in the process of the origin and evolution of cultivated barley.
Over the years, many diversity studies on barley have been conducted based on morphological taxons, proteins, isozymes and DNA levels of barley including morphologic taxonomy [3], esterase isozyme [4], hordein [5,6] and some of the molecular markers such as RFLP [7], AFLP [8], and ISSR [9]. Few studies, however, have been done on genetic diversity of Tibetan wild close relatives of barley using molecular markers like ISSRs (inter-simple sequence repeats) and SSRs (simple sequence repeats).
ISSR markers use primers based on dinucleotide or tetranucleotide or pentanucleotide sequence repeats and anchored nucleotides. These are randomly selected with the advantage of analyzing multiple loci in a single PCR reaction and require no prior information on the target sequence in the genome. ISSR markers have been widely used in recent years for cultivar identification in wheat [10], beans [11] and clementine [12].
SSR markers, also called microsatellite DNA markers or short tandem repeat (STR) markers are hypervariable DNA elements which consist of tandemly repeated mono-, di-, tri-, tetra- or penta-nucleotide motifs, and occasionally, complexes of different types of motifs, such as (AC)9(AG)7 and so on. SSR markers are presented abundantly in the genomes of higher organisms [13,14]. SSR markers have a number of advantages, such as the high level of polymorphisms, locus specificity, co-dominance, reproducibility, convenience through using PCR, and random distribution throughout the genome [15]. As such, SSRs became a popular marker system in plant studies, including rice [16], wheat [17], and barley [18].
In order to gain valuable information on the genetic resources of Tibetan barley and to provide further evidence to determine the evolution and origin of barley, we used ISSR markers and SSR markers covering the seven barley SSR linkage groups [19] to investigate the genetic diversity and geographical differences between Tibetan wild close relatives of barley and the Middle East wild barley to make a genetic diversity comparison.
2 Materials and methods
2.1 Plant materials
Ninety accessions of barley (Hordeum vulgare L.) were investigated, including 28 Tibetan accessions of two-rowed wild close relatives of barley (H. vulgare L. ssp. spontaneum [Koch] Hsü), 17 Tibetan accessions of six-rowed wild close relatives of barley (H. vulgare L. ssp. agriocrithon [Åberg] Hsü) and 45 wild accessions from different countries in the Middle East (Table 1). The seeds were kindly provided by Prof. Ma Dequan from the Institute of Crop Germplasm Resources, Chinese Academy of Agricultural Sciences. Tibetan accessions were randomly selected from 3165 accessions registered in the Chinese catalogue of genetic resources of wild close relatives of barley (Chinese Academy of Agricultural Sciences). These accessions were collected from the Qinghai–Tibet Plateau at altitudes ranging from 1600 to 4350 m.
The location of the accessions of Hordeum vulgare L. and serial numbers used in this study.
| Geographic region | Origin | The number of accessions | Altitude (m) |
| Tibet | Lhasa City | 4 | 3650–4200 |
| Qamdo Prefecture | 8 | 2840–4100 | |
| Nyingchi Prefecture | 4 | 1600–3804 | |
| Shannan Prefecture | 21 | 3300–4350 | |
| Xigaze Prefecture | 6 | 3700–4300 | |
| Nagri Prefecture | 2 | 3550–3830 | |
| Middle East | Outer Caspian Sea | 1 | |
| Syria | 4 | 700–2840 | |
| Israel | 40 | 500–1200 | |
| Total | 90 |
2.2 DNA extraction
About 5 g of fresh leaf tissue was ground in liquid nitrogen using a mortar and pestle. Total genomic DNA was isolated using the modified CTAB protocol [20]. In the initial step, the lysis buffer containing 2-mercapto-ethanol was increased to 0.4% and then was stored at −20 °C prior to use.
2.3 ISSR analysis
ISSR analysis was performed according to the protocol described by Fernández et al. [21] using a total of 10 selected primers (Table 2). The reaction mixture contained 5 ng of template DNA, 25 pmol of primer DNA, 2.5 mM of each dNTP, 0.5 U Taq polymerase (MBI), 2.5 μl of Taq polymerase 10× buffer (100 mM Tris-HCl, pH 8.8 at 25 °C, 500 mM KCl, 0.8% Nonidet P40) and 1.5 mM of MgCl2 in a total volume of 25 μl. PCR amplification performed using a T1 ThermoCycler (Whatman Biometra) programmed for 35 cycles: 94 °C for 30 s, 50 °C for 45 s and 72 °C for 2 min followed by a final extension at 72 °C for 10 min. The amplified products were separated and verified using an agarose gel.
Diversity value (He) of each locus within the wild close relatives of barley of Tibet and wild barley from the Middle East using ISSR and SSR markers.
| Primer | Samples of Tibet | Samples from Middle East | Primer | Samples of Tibet | Samples from Middle East |
| ISSR | SSR | ||||
| 820 | 0.264 | 0.125 | Ebmac0684 | 0.185 | 0.156 |
| 835 | 0.294 | 0.195 | Bmac0032 | 0.129 | 0.133 |
| 881 | 0.208 | 0.215 | Bmac0040 | 0.105 | 0.101 |
| 809 | 0.268 | 0.344 | Bmac0209 | 0.093 | 0.096 |
| 841 | 0.324 | 0.234 | Bmag0013 | 0.174 | 0.176 |
| 811 | 0.395 | 0.316 | Bmag0120 | 0.147 | 0.116 |
| 827 | 0.312 | 0.343 | Bmag0211 | 0.109 | 0.106 |
| 810 | 0.232 | 0.260 | Bmag0223 | 0.084 | 0.084 |
| 826 | 0.313 | 0.182 | Bmag0225 | 0.082 | 0.080 |
| 828 | 0.256 | 0.291 | Hvm33 | 0.102 | 0.078 |
| Mean | 0.286 | 0.250 | Hvm40 | 0.140 | 0.122 |
| Mean | 0.123 | 0.113 |
2.4 SSR analysis
A total of 11 primer pairs of SSR were selected from different locations of each linkage group [22] of barley used in this study (Table 2). SSR reactions were performed in a final volume of 15 μl containing 100 ng of template DNA, 2.5 pmol of primer DNA, 3.0 mM of each dNTP, 1U Taq polymerase (MBI), 1.5 μl of Taq polymerase 10× buffer (100 mM Tris-HCl, pH8.8 at 25 °C, 500 mM KCl, 0.8% Nonidet P40) and 2.0 mM of MgCl2. SSRs were amplified using standard PCR techniques using an Eppendorf Mastercycler gradient (Thermo Hybaid). Information about primer sequences and amplification conditions were given by Ramsay et al. [22].
Aliquots of each PCR reaction (2.5 μl) were run on sequencing gels (6% polyacrylamide, 8 M urea) under standard conditions, and the products were visualized by silver staining.
2.5 Data analysis
Each primer pair of the ISSR and SSR markers was referred to as a locus. The amplified fragments were scored as either present (1) or absent (0), with each of these treated as an allele. Thus, two matrixes of different ISSR and SSR phenotypes were assembled. The matrixes were then used for the statistical analyses described below, and the genetic variability was analyzed using the POPGene program (version 1.32). The gene diversity index for each locus and population was calculated using the formula:
3 Results
3.1 Allelic variation of ISSR markers
PCR amplification using ten 5′ anchored dinucleotide repeat primers gave rise to reproducible amplification products, totaling 93 bands ranging from 200 to 2000 bp, with an average of 9.3 fragments per primer (Table 3). Of these, 87 (93.55%) were polymorphic across the 90 accessions (Fig. 1(a), (b)). The number of polymorphic bands were 79 (86.81%) for 45 Tibetan accessions and 66 (80.49%) for the 45 accessions from the Middle East accessions.
Alleles of the wild close relatives of barley from Tibet and the Middle East wild barley accessions as determined by ISSR and SSR markers.
| Primer | The number of alleles | Primer | The number of alleles | ||
| Tibetan wild barley | Middle East wild barley | Tibetan wild barley | Middle East wild barley | ||
| ISSR | SSR | ||||
| 820 | 8 | 6 | Bmac0032 | 5 | 7 |
| 835 | 13 | 12 | Bmac0040 | 15 | 6 |
| 881 | 13 | 12 | Bmac0209 | 12 | 6 |
| 809 | 13 | 13 | Bmag0013 | 4 | 5 |
| 841 | 5 | 5 | Bmag0120 | 7 | 7 |
| 811 | 11 | 9 | Bmag0211 | 8 | 4 |
| 827 | 9 | 9 | Bmag0223 | 11 | 10 |
| 810 | 5 | 5 | Bmag0225 | 14 | 12 |
| 826 | 5 | 5 | Ebmac0684 | 4 | 5 |
| 828 | 9 | 8 | Hvm33 | 10 | 8 |
| Total | 91 | 82 | Hvm40 | 10 | 8 |
| Polymorphic bands | 79 | 66 | Total | 100 | 78 |
| Polymorphic bands | 100 | 77 |

ISSR amplification products generated from barley genomic DNA. ISSR profiles produced by primers (a) 835 and (b) 810.
The numbers of alleles scored by the ten ISSR markers are summarized in Table 3. Among these, five primers detected more alleles in the Tibetan wild close relatives of barley than in wild barley from the Middle East, and the other five primer pairs detected the same numbers of alleles in both regions. In total, 91 scoreable alleles were detected among the 45 Tibetan genotypes and 82 fragments were scoreable among the 45 Middle East accessions. Therefore, in this study, nine more alleles were scored in the Tibetan barley accessions than from accessions sampled from the Middle East (Table 3).
3.2 Allelic variation of SSR markers
Of all the eleven SSR primer combinations were found to be efficiently and reproducibly amplifiable polymorphic fragments for all barley accessions surveyed. The number of scoreable fragments amplified by each SSR primer pair varied from five (for primers bmag0013 and ebmac0684) to 22 (bmag0223) with an average of 11.45 per primer combination. A total of 126 scoreable alleles were detected among the 90 genotypes (Fig. 2), with 100 alleles (79.37%) present among the Tibetan accessions and 78 (61.90%) among the accessions from the Middle East. Two more additional alleles per locus were present in the Tibetan barley group than in the Middle East barley group.
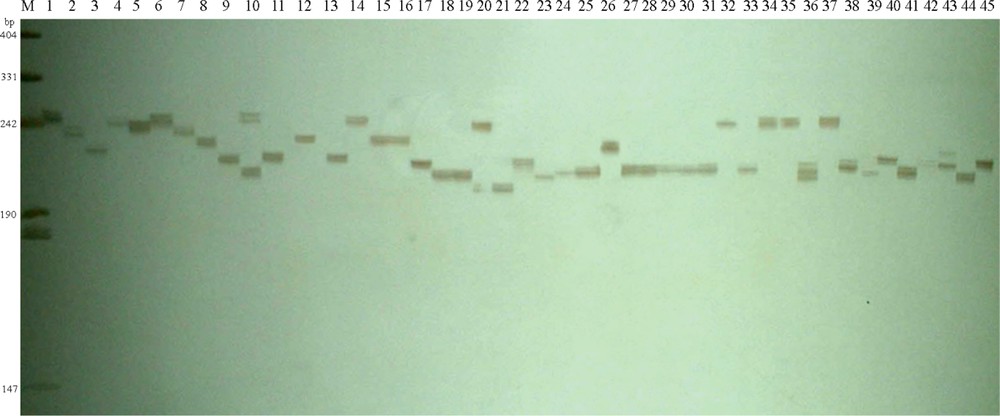
Silver-stained PCR products amplified using the SSR primer bmag0023 across the 45 wild close relatives of barley from Tibet on a denaturing polyacrylamide gel.
Out of the eleven SSR primer pairs used, seven primer pairs detected 1–9 more additional alleles in Tibetan barley than those in wild barley from the Middle East. Only one primer pair detected the same number of alleles (7) in the two barley regions and the remaining three primer pairs (Bmac0032, Bmag0013, Ebmac0684) detected 1–2 less alleles in the Tibetan barley than in barley from the Middle East. In total, 22 more different alleles were scored in the Tibetan barley than in the Middle East barley (Table 3). Therefore, the genetic diversity and the polymorphism of barley were obviously higher among the Tibetan wild barley accessions than those from the Middle East. From the data obtained by the SSR primers, we concluded that because more alleles were scored by a primer pair, there were more alleles in the Tibetan wild close relatives of barley than in wild barley from the Middle East.
3.3 Comparison of genetic diversity between Tibet and the Middle East barley
The genetic similarity coefficient and genetic distance of accessions from Tibet and the Middle East barley are compared, which indicated that the genetic similarity coefficient was high between the two barley regions, being 0.947 and 0.982 for ISSR and SSR respectively, while the observed genetic distance was low, being 0.055 and 0.018 for ISSR and SSR respectively. This showed that there was a close relationship of the two barley groups from the two regions. From our experimental results, we found that different primers revealed different levels of genetic diversity as shown in the genetic diversity coefficient analysis (Table 2). In Tibetan barley, the mean values of the Nei's gene diversity (He) varied from 0.068 to 0.249 for ISSR, and 0.095 to 0.122 for SSR. Among these, the SP (Shannan Prefecture) barley group had the highest genetic variation than the other sub-region groups of Tibet with values of 0.249 for ISSR and 0.122 for SSR. From these results, a comparison of the genetic diversity values of the barley from Tibet and the Middle East was made (Table 2). The results showed that out of the ten ISSR primers, five primers revealed higher genetic diversity values for the Tibetan accessions than those the Middle East barley, while the five other primers showed lower genetic diversity values for the Tibetan accessions than those for accessions from the Middle East. In addition, seven primer pairs of the eleven SSR markers revealed higher genetic diversity values for the Tibetan accessions than the accessions from the Middle East; one primer detected the same level of genetic diversity for accessions from Tibet and the Middle East; and the remaining three primer pairs indicated lower genetic diversity values for the Tibetan accessions than the accessions from Middle East. In total, these analyses showed that the genetic diversity of the Tibetan wild close relatives of barley were obviously higher (0.286 for ISSR and 0.123 for SSR) than those of the accessions of wild barley from the Middle East (0.250 for ISSR and 0.113 for SSR).
3.4 Cluster analysis
A dendrogram was constructed (Fig. 3) to depict the genetic diversity among all 90 samples based on the ISSR markers. UPGMA cluster analyses revealed that most of the samples grouped according to their origins, with the exception of two Tibetan samples, which grouped with the Middle East samples. This pattern of clusters obtained from the ISSR data indicated that the Tibetan accessions and the Middle East accessions can be separated into two major clusters according to geographical origin.
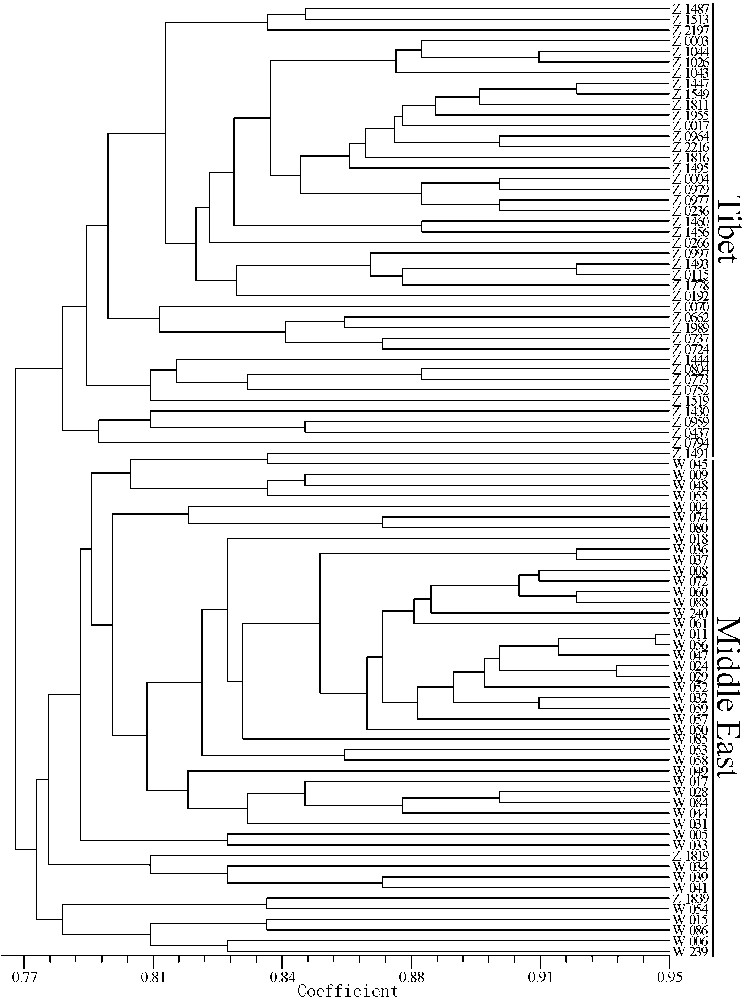
UPGMA dendrogram among the 90 genotypes of wild barley used based on Nei's coefficients using ISSR markers.
In Fig. 4, the UPGMA dendrogram based on the SSR data showed that the genetic similarity among the accessions varied from 0.80 to 0.99. The dendrogram was divided into two distinct groups that correlated with the geographic origin of the samples. One group included all of the samples from Tibet, while the other group included all the accessions from the Middle East.
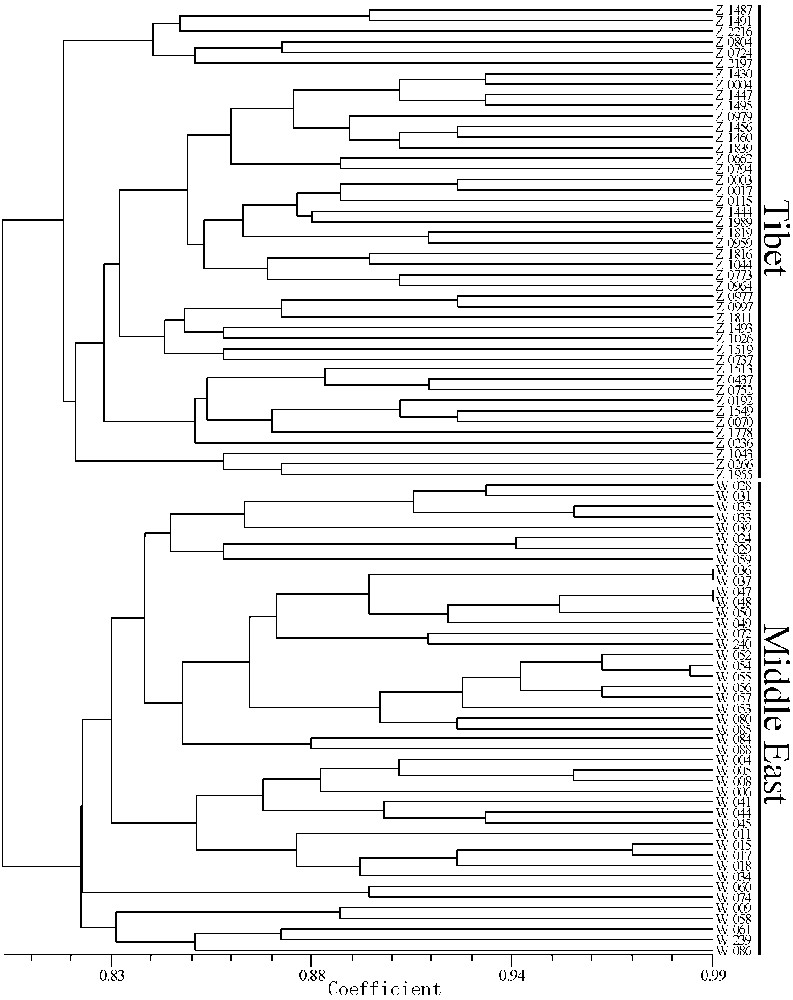
UPGMA dendrogram among the 90 genotypes of wild barley used based on Nei's coefficients using SSR markers.
Moreover, another two UPGMA dendrograms based on the ISSR and SSR genetic similarity coefficients were built respectively among the six Tibetan sub-regions and the Middle East as seen in Figs. 5 and 6. These cluster analyses exhibited that the Tibetan wild barley of six sub-regions grouped together, and that the Middle East accessions were an out group, reflecting the distant pedigree relationship between the Tibetan and the Middle East accessions.
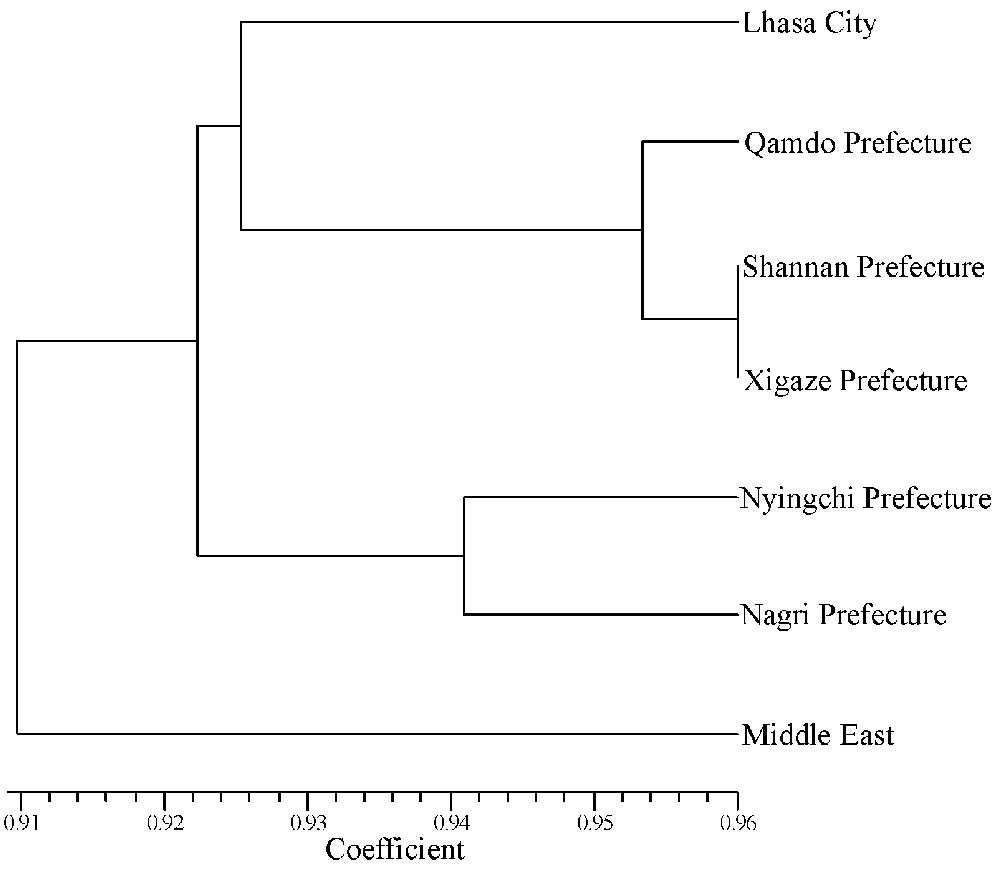
UPGMA dendrogram of the seven barley groups used in this study based on Nei's (1978) coefficients using ISSR markers.
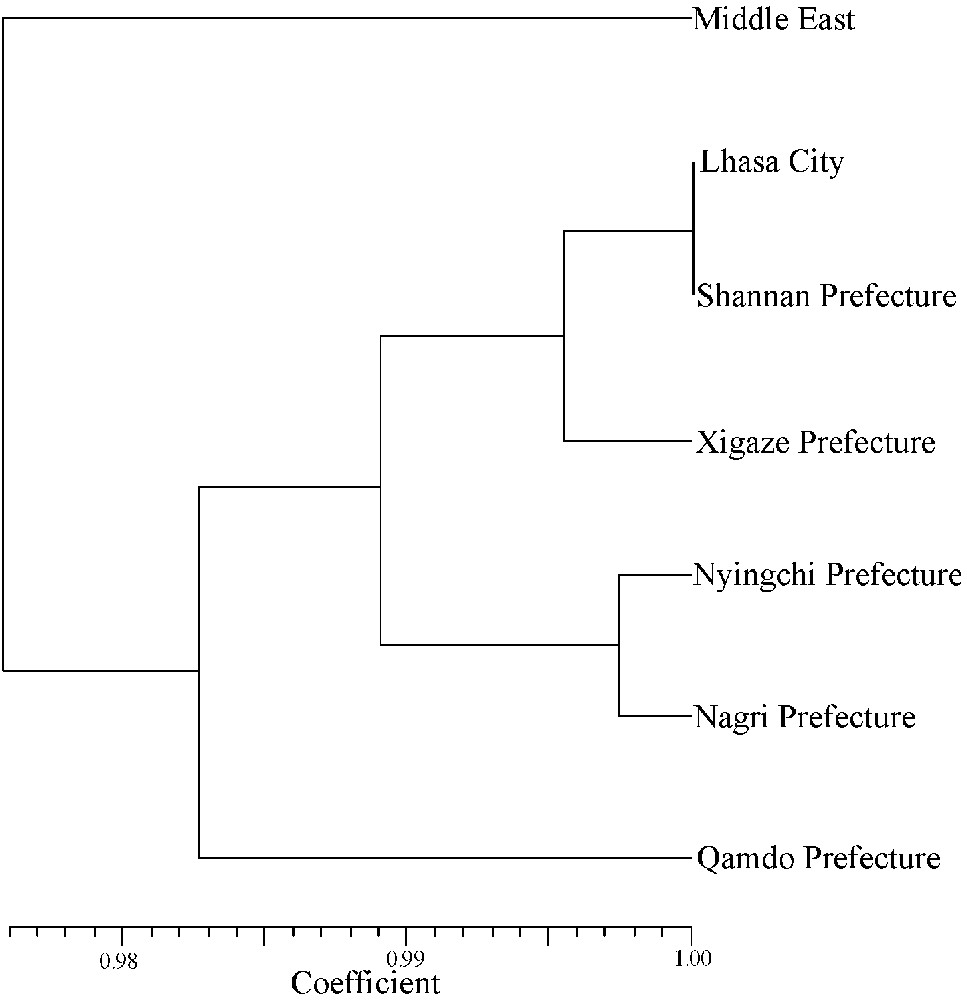
UPGMA dendrogram of the seven barley groups used in this study based on Nei's (1978) coefficients using SSR markers.
4 Discussion
4.1 Comprising genetic diversity of wild barley between Tibet and the Middle East regions
Li and Midmore [24] reported that when the variation between genotypes is high, using of a few primers will be sufficient. High genetic differentiation of narrowly endemic Sinocalycanthus chinensis was revealed by RAPD analysis using 12 primers [25]. In the present study, 10 ISSR primers and 11 SSR primers were used to detected genetic variation of Hordeum vulgare L.: 93 bands were generated and 87 bands were polymorphic for ISSRs and 126 bands were generated and 100 bands were polymorphic for SSRs, which was enough to allow for complete differentiation.
The number of alleles in loci, and the genetic diversity and genetic differentiation factors were considered to be the most important indices for measuring the level of genetic diversity. The Tibetan wild barley investigated in this study was an adequate representation of the barley in Tibet, with respect to its agri-geographical distribution. Through the use of ISSR and SSR markers, we have observed a total of 93 ISSR alleles and 126 SSR alleles in the 90 wild barley samples. The experiments showed that both the number and the frequency of alleles revealed by the ISSR and SSR markers were higher among Tibetan wild close relatives of barley than ones from the Middle East. The total numbers of alleles for the Tibetan isolates were 91 for the ISSR markers and 100 for the SSR markers. For the Middle East isolates, these values were 82 for the ISSR markers and 78 for the SSR markers. Previously, Feng et al. [26] identified 229 allelic variants using 29 SSR primer pairs in 50 two-rowed wild close relatives of barley and showed that Tibetan wild barley had higher genetic diversity. The results of our study agreed with Feng et al. [26] and consequently, these results indicated that the genetic diversity of the Tibetan wild close relatives of barley was higher and that the Middle East barley had abundant allelic variants.
In the present study, we determined that the genetic diversity (He) in Tibetan wild barley was 0.286 for ISSR markers and 0.123 for SSR markers, these values for wild barley from the Middle East were 0.250 and 0.113 respectively. Previously, studies with SSR markers reported that the highest level of genetic diversity for wild barley was in Israel, the second highest from Iran and the lowest from Turkey [27]. This study, however, did not include any isolates of Tibetan wild barley or occidental wild barley. Correspondingly, in our study, the majority of the Middle East wild barley accessions studied was from Israel (Table 1). Furthermore, our results indicated that Tibetan wild barley had a higher genetic diversity than that of barley from Middle East. This was remarkably consistent with a study on the genetic diversity of hordein in wild close relatives of barley from Tibet [5].
4.2 Barley genetic diversity with ecology and geography
From an ecological perspective, different altitudes represent different climatic conditions, including different geographical environments, temperature, rainfall, light intensity, and UV intensity. Of the material tested in this study, the accessions collected from the highest elevation in Israel was at 1200 m (Galilee Hill 500–1200 m) while in the Tibet region the elevation ranged from 1600–4350 meters. As such, the wild close relatives of barley in Tibet and Israel belonged to different geographical environments based on their different altitudes and climate conditions. The great differences in the ecological environments between the Qinghai–Tibet Plateau and the Middle East along with the extensive natural hybridization of barley [28] lead to the distinct morphological characteristics of the two-rowed wild barley of the Qinghai–Tibet Plateau and the Middle East. Ma [29] compared the morphological characters of Qinghai–Tibet Plateau two-rowed wild barley (H. vulgare L. ssp. spontaneum) and the Middle Eastern H. vulgare L. ssp. spontaneum using the randomly selected accessions: Qinghai–Tibet Plateau 232 H. vulgare L. ssp. spontaneum accessions and the Middle East 237 H. vulgare L. ssp. spontaneum. The results showed that there were evident differences between the H. vulgare L. ssp. spontaneum of the Qinghai–Tibet Plateau and the Middle Eastern accessions. The genetic variations above were closely correlated with the local ecological environments. The solar radiation intensities of the Qinghai–Tibet Plateau were strong enough to change successive planting for several years of covered barley into naked barley. Eventually, the color characters of H. vulgare L. ssp. spontaneum from the Qinghai–Tibet Plateau were influenced by sunshine length and spectroscopic properties and ultimately formed stable dark characters. However, the climate in the Middle East (elevation ⩽ 1500 m) was hot, dry and rainless. Thus, the wild barley in this ecological environment was become xerophilic, had light-colored spikes and grains, and did not have a winter season to overwinter. Their genetic variability was relatively narrow.
Genetic diversity is the result of the interactions of genotypes and their environment, with the system developing over the long-term. Based on the present results, we assumed that the different geographical environments contributed greatly to the differences in the genetic diversity of the two barley regions, Tibet and the Middle East. In our study, the greatest number of alleles was detected in the Tibetan wild close relatives of barley that were distributed in higher altitude areas (3650–4350 m). Few accessions were obtained in the lower altitudes areas under 3000 m. In addition, the total gene diversity values (HT) for the Tibetan barley (0.227 for ISSRs and 0.126 for SSRs) was higher than those of the Middle East (0.212 for ISSRs and 0.102 for SSRs). Moreover, the UPGMA cluster analyses separated the Tibetan barley and the Middle East barley into two distinct groups according to their different geographical environments. This may be due to the fact that the UV intensity increases with altitude, and as a result, more genetic variation is generated. Also, the Tibetan wild close relatives of barley are distributed in all these areas, which cover more than 2000 kilometers from Markam County of the Jinsha River on the east to Zanda County of the Ali Plateau on the west, and East Asia and Cona County on the south to Gongbogyamda County of Qamdo Prefecture on the north. Furthermore, the Tibetan wild close relatives of barley can be found among the vast agricultural areas and the semi-pastoral areas at altitudes ranging from 1600 to 4350 m between the 27°–32°N and 80°–100°E. Consequently a richer genetic diversity has been generated in the Tibetan wild close relatives of barley, and favors the argument that the Qinghai–Tibet Plateau is the center of origin for cultivated barley in the Oriental region [5,30,31].
4.3 Genetic diversity of Tibetan wild close relatives of barley and the origin of barley
In this study, the genetic variation of alleles, genetic diversity and genetic differentiation of the genomes in Tibetan wild barley were analyzed with ten ISSR loci and eleven SSR loci. The results revealed abundant genetic diversity in Tibetan wild barley and also indicated a certain degree of geographical differentiation between the six barley sub-regions of Tibet. There have been some reports about the genetic diversity of Tibetan barley. Tang et al. [32] obtained 60 different electrophoretic fingerprints of hordein from 184 Tibetan wild barley accessions and the results of cluster analysis displayed similar geographical environments grouping with similar fingerprint patterns. Another study on Tibetan barley from the perspective of classification system pointed out that almost all of the world's barley types could be found in Tibetan region [28]. In addition, an analysis of isozymes [30] showed that the types of isoenzymes in Tibetan barley were rich in high genetic polymorphisms, and were also very different from the isoenzyme types of other areas of the world. These results along with the results from our study demonstrate that Tibetan wild barley is an abundant germplasm resource with a high level of genetic diversity.
Hypotheses concerning the origin of barley have maintained that the varieties growing in the centers of origin generally contain large amounts of dominant genetic genes. For wild barley, the progenitor of cultivated barley, the region with the highest level of genetic diversity is also most likely the center of origin for cultivated barley. There have been a number of viewpoints concerning the origin of barley in the world, which have been debated for nearly 100 years: the Oriental origin hypothesis [33], the Occidental origin hypothesis [34] and the Diphyletic hypothesis [35]. The Oriental origin hypothesis suggested that six-rowed barley, H. vulgare L. ssp. agriocrithon [Åberg] Hsü, found in the Tibet of China was the ancestor of cultivated barley. The Occidental origin hypothesis proposed a given zone of the Near East or Southwest Asia as the center of origin for cultivated barley. The diphyletic hypothesis proposed that the six-rowed cultivated barley in the Oriental region was derived from wild six-rowed barley, while the two-rowed cultivated barley in Southwest Asia originated from wild two-rowed H. vulgare L. ssp. spontaneum [Koch] Hsü. In our study, Tibetan wild barley and the Middle East wild barley both had high levels of genetic diversity. However, the number of alleles obtained from both the ISSRs and the SSRs and the variation of genetic diversity were higher in the Tibetan wild close relatives of barley than that in the Middle East wild barley. Furthermore, the dendrograms generated by the ISSRs and SSRs indicated that the Tibetan wild barley and the wild barley from the Middle East were distinctly clustered into two groups according to their geographic origin. For the ISSRs, one group included all samples of Tibetan origin, while the second group included all but two of the accessions of the different countries in the Middle East. And for the SSR analysis, one cluster was comprised of all of the Tibetan wild barley and another consisted of all of the Middle East wild barley. Our cluster analysis results implied that Tibetan barley and Middle Eastern barley may be from different centers of origin. Moreover, a study of the monophyletic vs. polyphyletic origin of crops suggested that the place of origin can be where the wild progenitor varies spatially and can be subdivided into distinct geographic races – each with its specific isozymes and/or DNA fingerprinting [36,37]. In recent years, nucleotide diversity was widely employed to research the phylogeny and evolution of cultivated barley. Based on nucleotide diversity and haplotype combinations in domestication-related traits in barley, phylogenetic analysis of domesticated barley gave new support to the notion of a diphyletic origin for cultivated barley [38,39]. The same notion was endorsed by Morrell and Clegg [40]. Their results indicated at least two domestications of barley: one within the Fertile Crescent and a second one 1500–3000 km farther east. The Fertile Crescent domestication contributed to the majority of diversity in European and American cultivars, whereas the second domestication contributed to most of the diversity in barley from Central Asia to the Far East. In addition, Saisho and Purugganan's [41] analysis of five genes of domesticated barley in the old world revealed that landraces found in South and East Asia was genetically distinct from those in Europe and North Africa. They also suggested differentiation in the presence of a naked caryopsis and spikelet row number between eastern and western barley accessions. However, these studies have seldom included Tibetan barley accessions. Only Azhaguvel and Komatsuda [39] employed two barley accessions in their study, and they supported the view that barley lines from Tibet and Israel must have different origins [42]. In addition, Tibetan wild barley is grown as a crop in the Qinghai–Tibet Plateau (including the upper reaches of the Yellow River) and has an ancient history in the agricultural records dating back to 3000 years B.C. [3]. This region is also geographically isolated from the rest of the world by several of the world's largest mountain ranges. Consequently, our results of the genetic diversity analyses on Tibetan barley combined with the geographical environments of Tibet provide further evidence to support the hypothesis that the Qinghai–Tibet Plateau and its vicinity are the center of origin for cultivated barley in the Oriental region.
Acknowledgements
This research was supported by grant no. 30270709 from the National Nature Sciences Foundation of China and by Program for Changjiang Scholars and Innovative Research Team in University of the Education Ministry of China.