

1 Introduction
Any alteration in or perturbation to an ecosystem – such as agriculture, road construction, logging, or other forms of human use of a habitat otherwise in equilibrium – provokes an unbalanced situation which has, even when discrete, strong repercussions on the plant and animal communities. As a result, their specific compositions change, whether momentarily or over the long term. A great concern for modern ecologists is to have the tools at hand that allow them to quickly evaluate the diversity of focal taxa and to easily pinpoint local changes in ecosystems caused by human activity. In this context, ants are among the most utilized biological indicators (e.g., species or communities whose function, population, or status can be used to determine ecosystem or environmental integrity) due to their functional importance in ecosystems and sensitivity to environmental changes; the ease of sampling, sorting and identifying them; and their local richness and abundance (i.e., Conservation International's Rapid Assessment Program; see [1–5]). Also, the anthropogenic alteration of ecosystems allows the introduction and/or dissemination of exotic species or, more generally, favors the spread of certain endemic ones. Concerning ants, any exogenous species will interact with native communities and sometimes be responsible for the localized extinction of endemic organisms [6]. Given these settings, there is a need to develop analytical approaches that can maximize the information extracted from available data, such as “simple” presence–absence data.
In this study conducted in French Guiana, we examined the impact of traditional land use by Wayana Amerindians through a comparison of the ant communities in habitats presenting a gradient of anthropization: from pristine forests to a village itself. This is the first study where ants are used to examine traditional land use and forest regeneration. We also hope to show that a simplified assessment method is particularly useful and perfectly reliable for such a study where the resources (especially time and space) for sampling are greatly limited. For that reason, we schematically represented traditional land use by Amerindian using Kohonen's Self-Organizing Maps (SOM, neural network) [7] based on data obtained from our study on ants in and around the village. The SOM yields a clear bi-dimensional projection of a relatively large volume of site-specific data on species occurrences. In addition the “weight” (or connection intensity) of each species in each cell of the SOM can be interpreted as its probability of occurrence in a given area (with reference to land use in this study), even in areas in which they did not occur during sampling.
2 Material and methods
2.1 Some characteristics of Wayana Amerindians in French Guiana
The Wayana live along several rivers in Brazil, French Guiana and Suriname. Irregularly distributed in small villages of 20 to 200 inhabitants, their total population is around 1400 individuals [8], only 750 of whom reside in French Guiana, according to the French Demographic Census of 1996. Their main traditional source of food results from “slash-and-burn” agriculture augmented by fishing and hunting. This sort of agriculture, adapted to the infertile soils prevalent in the Amazon region, has been practiced for centuries by many Amerindian nations and their mixed-race descendants living along rivers. Despite a recent tendency to settle in one place, the Wayana were not traditionally limited by space, and they moved their villages more or less every 7 years [8]. Like other Amerindian peoples, the Wayana practice shifting cultivation where plots are farmed for short periods of 2–3 years, followed by long periods of fallow of 2 or more decades [9–12].
2.2 Study site and methods
This study was carried out during three field outings (2000–2002) to the Wayana village of Tidamali, 3 km south of Maripasoula (3.6°N, 54.0°W), French Guiana, on the banks of the Maroni River that separates French Guiana from Suriname.
Six areas were sampled using the pit-fall trap technique: (1) the village; (2) a recent cassava plantation with most plant individuals more than 3 m tall; (3) a cassava plantation abandoned for 6 years dominated by 10–15 m tall Apeiba tibourbou (Tiliaceae); (4) a terra firma forest fragment preserved by villagers in the middle of their cultivated lands; (5) a riparian forest (e.g., a forested area of land adjacent to a body of water such as a river, stream, lake etc. in this case, the Maroni River); and (6) a primary terra firma forest. Both of the latter are located 4 kilometers from the village. The village and all of the plots were set up at the edge of the terra firma forest. In each area, 20 pit-fall traps were placed at 25 m intervals and left for 24 hours (the sampled area in each parcel is thus estimated to be 1.25 ha; 120 samples in total: pit-fall traps). Each trap consisted of a plastic cup, with a volume of 25 cm3, buried to its lip and containing around 2 cm of water with a few drops of liquid soap [13]. The ants were sorted in the field, then preserved in alcohol and identified later at the Laboratório de Mirmecologia in Itabuna, Bahia, Brazil. Voucher specimens were deposited in the laboratory's collection (CPDC), catalogue number #5295. The nomenclature of the identified material comes from Bolton [14,15].
Although they cannot be considered as a blanket solution for sampling ants because the results they provide may be biased [13,16,17], pit-fall traps permit ground-dwelling ants to be rapidly inventoried, especially in highly anthropized areas, where the ground is trampled and laid bare [18,19]. The other most common method, Winkler extraction, is only useful for leaf-litter fauna [13]. Because in this study we used the minimum number of samples recommended for a rapid inventory allowing comparable data [20] to be gathered (i.e., 20 samples at ca. 20 m intervals; 25 m in this case), we verified the validity of this protocol through the SOM (see below).
2.3 Ant diversity
The results are expressed as the number of samples where the species studied was found (presence/absence). Several ecological indices were used: Alpha, Shannon's and Simpson's Diversity Indices, and Berger–Parker Dominance Index [21].
2.4 Modeling procedure
In this study we analyzed data with the Self-Organizing Map algorithm [7] already used to pattern species assemblages using site-specific data on species occurrences [5,22,23]. Combining clustering and ordering abilities, the SOM is an unsupervised learning procedure, which transforms multi-dimensional input data into a two-dimensional map subject to a topological (neighborhood preserving) constraint [7].
The structure of the SOM consists of two layers of neurons connected by weights (or connection intensities): the input layer is composed of 75 neurons (one per ant species) connected to the 120 samples (pit-fall traps); the output layer is composed of 55 neurons (represented as hexagonal cells) organized in a grid containing 11 rows and 5 columns (see Fig. 1A). At the end of the learning process, pit-fall traps that are next to each other on the grid are expected to have similar ant assemblages, while pit-fall traps located very far from each other on the grid represent different ant assemblages (similar procedure was used as in [23]). The K-means algorithm was applied to the weights of the biological variables in the output neurons in order to identify the cluster boundaries on the SOM [24]. Fig. 1B provides a gradient analysis of the species' distribution for each ant. Using a qualitative presence/absence dataset, the model calculated continuous, quantitative values between 0 and 1. More specifically, the connection intensity between input and output layers calculated during the learning process can be considered as the probability of occurrence for each species in the area concerned. The probability of occurrence for each species in a given area corresponding to the connection intensity is shown on the SOM map in shades of grey, which therefore allowed us to analyze the effect of each variable (species) on the patterning input dataset (sites), and even to predict the probability of occurrence for each species in the sites (or clusters) where they were not consistently collected during the sampling (see [23]).
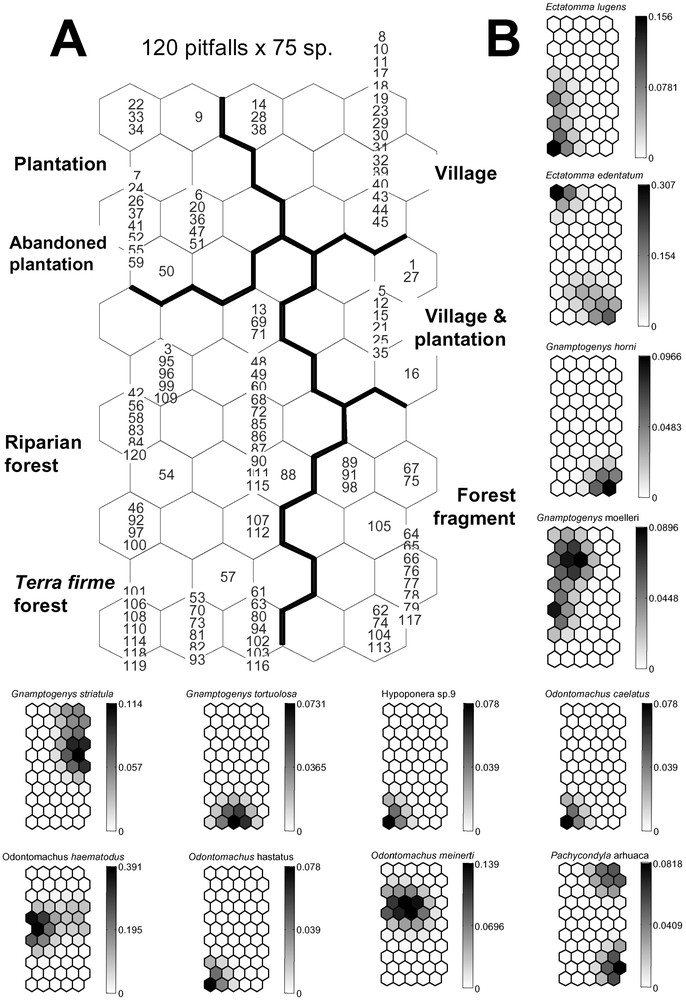
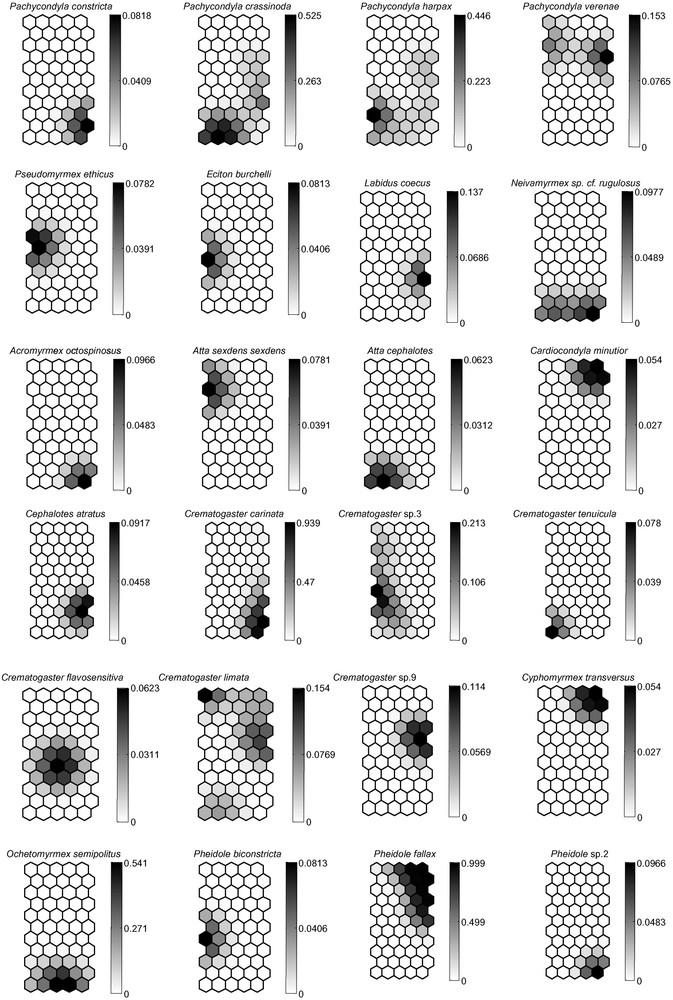
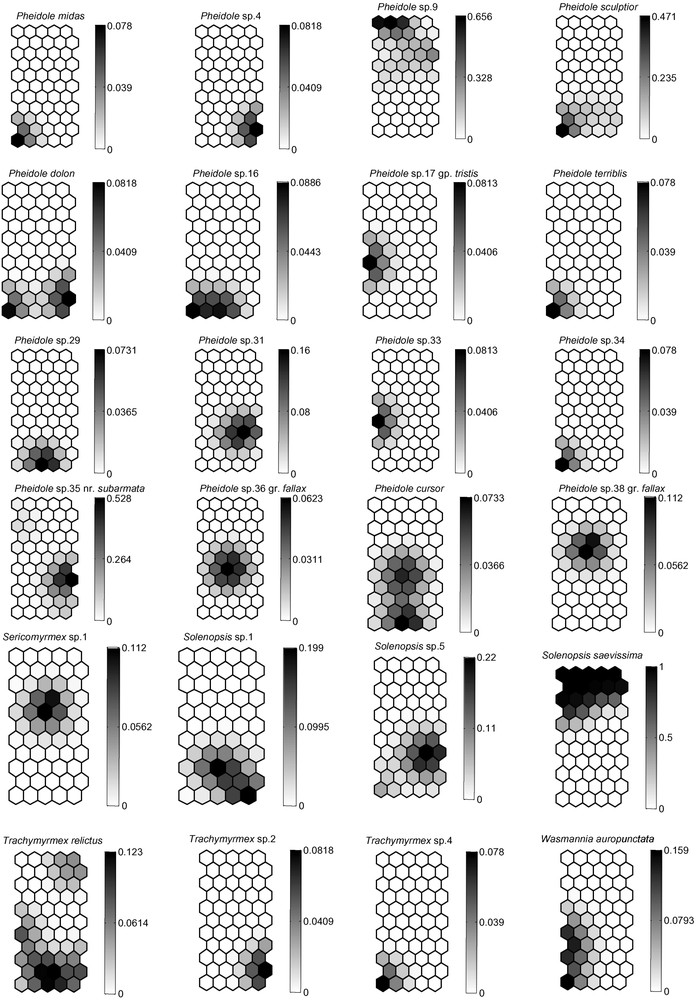
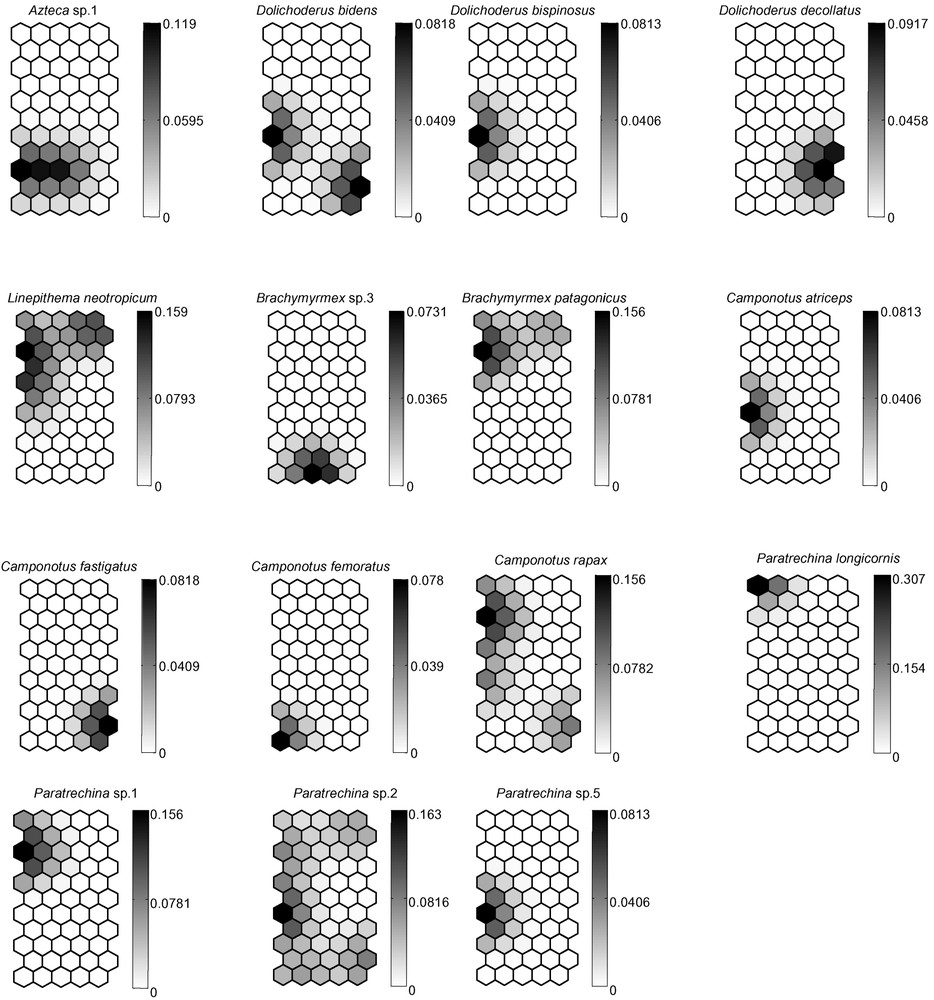
(A) Distribution of the 120 pit-fall trap samples on the Self-Organizing Map (SOM; 55 hexagons) according to the presence or absence of 75 ant species. Numbers correspond to the pit-fall traps. The different clusters (delineated with bold lines) were derived from the K-means algorithm. (B) Gradient analysis of the probability of occurrence for each of the 75 ant species on the trained SOM (presented in “A”), shown in a shaded scale (dark = high probability of occurrence, light = low probability of occurrence). Each smaller map, corresponding to one ant species, can be superimposed on map “A”, thus showing the probabilities of presence of each ant species within each pit-fall trap cluster.
To test the robustness of our interpretation of the dataset and the protocol used, we divided it into two new datasets arbitrarily chosen by sample number (odd- or even-numbered samples; samples in each case). The SOM procedure was repeated for each set, making the best use of each of the two maps containing 40 units organized into five clusters. Data were interpreted in the same way, allowing us to test if similar conclusions drawn from original data could be drawn using fewer data.
3 Results and discussion
3.1 Ant diversity and habitat disturbance
Among the different biological indicators considered as useful for studying landscape disturbance in terrestrial ecosystems, ants present numerous advantages over other arthropods and vertebrates. Indeed, occurring worldwide and taxonomically well known, they generally constitute the largest fraction of the animal biomass, occupy different places in the food web (e.g., they can be direct or indirect herbivores, scavengers, generalists or predators), and respond to stress on a finer scale than other animals; moreover, the sampling protocols for ground-dwelling species have been fine-tuned and standardized [2,4,13–20,25]. Consequently, ants have been used as indicators of environmental change in landscapes disturbed by activities such as mining, agriculture and military training [4,26–29], but never as indicators related to traditional land use as in the present study.
Ant diversity is known to decrease with the level of disturbance [26–29], something globally noted in this study (Table 1). Yet, slight disturbance, permitting species already present to remain (although their density decreases) while new species begin to appear, can result in a slight increase in diversity [29]. This was again the case in this study where the forest fragment near the villagers' dwellings and situated along a river was more species-rich than the natural riparian forest (Tables 1 and 2). Consequently, as discussed below, ant assemblages, each represented by emblematic species, characterize the degree of disturbance more than ant diversity does.
Ants collected with pit-fall traps in different cultivated and natural areas near Tidamali village, Maripasoula, French Guiana. The numbers presented in the table correspond to the numbers of occurrences for each ant species among the 20 pit-fall traps placed at 25 m intervals and left for 24 hours.
| Ant species | Village | Recent plantation | Abandoned plantation | Forest fragment | Riparian forest | Primary forest | Total |
| Ectatomminae | |||||||
| Ectatomma edentatum Roger | 2 | 1 | 2 | 5 | |||
| Ectatomma lugens Emery | 1 | 2 | 3 | ||||
| Gnamptogenys horni (Santschi) | 1 | 1 | |||||
| Gnamptogenys moelleri (Forel) | 1 | 1 | 2 | ||||
| Gnamptogenys striatula Mayr | 2 | 2 | |||||
| Gnamptogenys tortuolosa (Smith) | 1 | 1 | |||||
| Ponerinae | |||||||
| Hypoponera sp.9 | 1 | 1 | |||||
| Odontomachus caelatus Brown | 1 | 1 | |||||
| Odonto. haematodus (Linnaeus) | 1 | 1 | 3 | 1 | 6 | ||
| Odontomachus hastatus (Fabricius) | 1 | 1 | |||||
| Odontomachus meinerti Forel | 1 | 1 | 2 | ||||
| Pachycondyla arhuaca (Forel) | 1 | 1 | 2 | ||||
| Pachycondyla constricta (Mayr) | 1 | 1 | |||||
| Pachycondyla crassinoda (Latreille) | 1 | 2 | 4 | 3 | 3 | 13 | |
| Pachycondyla harpax (Fabricius) | 1 | 1 | 3 | 3 | 8 | ||
| Pachycondyla verenae (Forel) | 2 | 2 | |||||
| Pseudomyrmecinae | |||||||
| Pseudomyrmex ethicus (Forel) | 1 | 1 | |||||
| Ecitoninae | |||||||
| Eciton burchelli (Westwood) | 1 | 1 | |||||
| Labidus coecus (Latreille) | 1 | 1 | |||||
| Neivamyrmex sp. cf. rugulosus | 2 | 2 | |||||
| Myrmicinae | |||||||
| Acromyrmex octospinosus (Reich) | 1 | 1 | |||||
| Atta sexdens sexdens (Linnaeus) | 1 | 1 | |||||
| Atta cephalotes (Linnaeus) | 1 | 1 | |||||
| Cardiocondyla minutior Forel | 1 | 1 | |||||
| Cephalotes atratus (Linnaeus) | 1 | 1 | |||||
| Crematogaster carinata Mayr | 2 | 11 | 4 | 17 | |||
| Cremato. flavosensitiva Longino | 1 | 1 | |||||
| Crematogaster limata Fr. Smith | 2 | 2 | 4 | ||||
| Crematogaster sp.3 | 5 | 5 | |||||
| Crematogaster sp.9 | 1 | 1 | |||||
| Crematogaster tenuicula Forel | 1 | 1 | |||||
| Cyphomyrmex transversus Emery | 1 | 1 | |||||
| Ochetomyrmex semipolitus Mayr | 4 | 1 | 4 | 9 | |||
| Pheidole biconstricta Mayr | 1 | 1 | |||||
| Pheidole cursor Wilson | 2 | 2 | |||||
| Pheidole dolon Wilson | 2 | 2 | |||||
| Pheidole fallax Mayr | 14 | 13 | 3 | 30 | |||
| Pheidole midas Wilson | 1 | 1 | |||||
| Pheidole sculptior Forel | 8 | 8 | |||||
| Pheidole sp.2 gp. diligens | 1 | 1 | |||||
| Pheidole sp.4 | 1 | 1 | |||||
| Pheidole sp.9 | 4 | 6 | 1 | 11 | |||
| Pheidole sp.16 | 2 | 2 | |||||
| Pheidole sp.17 gp. tristis | 1 | 1 | |||||
| Pheidole sp.29 | 1 | 1 | |||||
| Pheidole sp.31 | 2 | 2 | |||||
| Pheidole sp.33 | 1 | 1 | |||||
| Pheidole sp.34 | 1 | 1 | |||||
| Pheidole sp.35 nr. subarmata | 1 | 3 | 3 | 7 | |||
| Pheidole sp.36 gp. fallax | 1 | 1 | |||||
| Pheidole sp.38 gp. fallax | 1 | 1 | |||||
| Pheidole terribilis Wilson | 1 | 1 | |||||
| Sericomyrmex sp.1 | 1 | 1 | |||||
| Solenopsis sp.1 | 4 | 4 | |||||
| Solenopsis sp.5 | 2 | 2 | 4 | ||||
| Solenopsis saevissima (Smith) | 13 | 16 | 10 | 39 | |||
| Trachymyrmex relictus Borgmeier | 3 | 2 | 5 | ||||
| Trachymyrmex sp.2 | 1 | 1 | |||||
| Trachymyrmex sp.4 | 1 | 1 | |||||
| Wasmannia auropunctata (Roger) | 1 | 3 | 4 | ||||
| Dolichoderinae | |||||||
| Azteca sp.1 | 1 | 1 | 2 | ||||
| Dolichoderus bidens (Linnaeus) | 1 | 1 | 2 | ||||
| Dolichoderus bispinosus (Olivier) | 1 | 1 | |||||
| Dolichoderus decollatus Smith | 1 | 1 | |||||
| Linepithema neotropicum Wild | 3 | 2 | 5 | ||||
| Formicinae | |||||||
| Brachymyrmex sp.3 | 1 | 1 | |||||
| Brachymyrmex patagonicus Mayr | 1 | 2 | 3 | ||||
| Camponotus atriceps (Smith) | 1 | 1 | |||||
| Camponotus fastigatus Roger | 1 | 1 | |||||
| Camponotus femoratus (Fabricius) | 1 | 1 | |||||
| Camponotus rapax (Fabricius) | 2 | 1 | 1 | 4 | |||
| Paratrechina longicornis (Latreille) | 2 | 2 | |||||
| Paratrechina sp.1 | 2 | 2 | |||||
| Paratrechina sp.2 | 5 | 1 | 6 | ||||
| Paratrechina sp.5 | 1 | 1 | |||||
| Number of species | 11 | 13 | 18 | 22 | 15 | 35 | 75 |
| Number of samples | 20 | 20 | 20 | 20 | 20 | 20 | 120 |
Diversity indices applied to the different habitats sampled around Maripasoula (Tidamali village grounds), French Guiana.
| Habitat | Alpha | Shannon | Simpson | Berger–Parker |
| Village | 3.76 | 1.62 | 3.38 | 0.325 |
| Recent plantation | 5.70 | 2.00 | 5.66 | 0.320 |
| Abandoned plantation | 11.49 | 2.57 | 12.53 | 0.250 |
| Forest fragment | 17.96 | 2.68 | 12.74 | 0.255 |
| Riparian forest | 15.91 | 2.55 | 21.42 | 0.120 |
| Primary forest | 35.14 | 3.34 | 34.76 | 0.129 |
In the present study, the village and recent plantations are characterized by the presence of Gnamptogenys striatula, Ph. fallax, S. saevissima and Linepithema neotropicum (Fig. 1B). These species, that commonly nest in well-trampled places such as the paths used by the villagers, are among the best indicators of anthropization. Solenopsis saevissima, also present in both types of plantations (Table 1), characterizes all anthropized areas of the Amazonian Basin [30]. Moreover, its aggressiveness and numerical dominance make its presence one of the strongest impediments to the regeneration – from the ground up – of abandoned plantations into secondary forests [30]. It is certainly the cause of the major differences we noted between the anthropogenetic and forested communities (Fig. 1A, B).
Because the ground was well shaded in the recent plantation, the ant assemblage was intermediary between that of the village with bare soil (cluster “Village & Plantation” characterized by Gnamptogenys striatula, a Neotropical species frequent in urban parks and secondary vegetation [31]; Fig. 1A) and the abandoned plantation well shaded by shrubs (cluster “Plantation” and “Abandoned plantation”; Fig. 1A).
While it retains characteristics of the most anthropized habitats due both to its proximity to the village and history of human activity, the abandoned cassava plantation resembled a forest in that forest ants were beginning to re-colonize it (Fig. 1A, B). The similarities in the relative frequencies in the pit-fall traps of P. crassinoda and other large Ponerinae suggest that they are good indicators of the start of the forest's regeneration in the abandoned plantation. The final phases are the longest; Meggers [10] estimated it to take about 20 years, but several hundred years are necessary for the vegetation in the Brazilian Atlantic forest to recover [32].
Although close to the village and both logged and burned accidentally, the forest fragment, left intact in the middle of cultivated fields, maintained an ant fauna very similar to that found in the unspoiled forests (Fig. 1A, B). Arboreal species such as Cephalotes atratus and Crematogaster carinata are present (the workers of arboreal species also forage on the ground; see [33]).
The transition between the forest fragment and riparian and terra firma forests appears as a gradient of occurrence for several ant species, particularly Odontomachus spp., Pachycondyla spp., Camponotus rapax and Ochetomyrmex semipolitus. Finally, the habitat quality of the pristine, terra firma forest was mostly marked by the diversity of the genus Pheidole and the occurrence of other species such as Ochetomyrmex semipolitus (Fig. 1B).
3.2 Biological insights
The Berger–Parker index clearly shows that species dominance may be a good parameter of anthropogenic disturbance [34] (Table 2). Indeed, we noted five “dominant” species or species observed more than 10 times in the six sampling sites: Crematogaster carinata, Pachycondyla crassinoda, Pheidole sp.9, Ph. fallax and Solenopsis saevissima. This kind of dominance needs to be distinguished from the notion of “numerical dominance” [36] that rather pertains to species with large colonies.
Among the Myrmicinae, the distribution of leaf-cutting, fungus-growing ants reflects their known distribution [35], although these ants are reported to avoid pit-fall traps. Atta sexdens is adapted to living in semi-open habitats, while A. cephalotes is typically found in pristine forest, and the more generalist Acromyrmex octospinosus is here limited to the forest fragment (Fig. 1B).
Only three ant species (i.e., O. haematodus, P. crassinoda and P. harpax), all Ponerinae, were noted in four to five habitats. Although no statistical analyses could be conducted due to our limited sampling, the frequency of the two Pachycondyla species seems to be linked to undisturbed habitats. The genus Pheidole, which is the most species-rich ant genus in the Neotropics [37], was, as expected, very diverse with 19 total species, and its species number increased according to the state of habitat preservation. Its diversity is therefore a good indicator of local ant species richness and accounts for approximately 1/7 (poor conservation) to 1/3 (good conservation) of the diversity of the ant community in the habitats [37]. Among the Formicinae, Camponotus rapax characterizes primary or secondary forests in the Amazonian Basin, while the genus Paratrechina occurs mostly in anthropized areas [36].
We noted three “tramp species” likely to be invasive. “Tramp species” are ant pests transported worldwide through human activity that have a propensity to displace local ant species when introduced; move out when disturbed; show an absence of intraspecific, but a high rate of interspecific aggressiveness; are polygynous; and reproduce by colony fission [6]. Two of them, Cardiocondyla minutior and Paratrechina longicornis, were supposedly introduced from Africa [38]. Even though they were found in and around human habitats, their occurrence was relatively low (Fig. 1B). Wasmannia auropunctata, a Neotropical species, is present everywhere in the leaf-litter in South American forests. Its populations sometimes explode in cultivated areas, so that its presence usually indicates human-related perturbation [39]. This species occurred only a few times in our study and did not seem influenced by human activity in these particular conditions.
The presence of the forest fragment can play a role in favoring the colonization of abandoned plantations due to its proximity and thanks to the conservation of both riparian fauna and flora (see Fig. 1B). We do not know if leaving a forest fragment in the middle of cultivated lands is truly a traditional practice, but, while traveling on the river, we noted that large areas of native riparian vegetation were interspersed between Wayana villages and their cultivated plots, sometimes even among the plots, favoring forest regeneration. This must have also been true in the recent past as zones corresponding to abandoned villages were easily recognizable due to the presence of Cecropia spp., mango and coconut trees.
3.3 Verification of the quality of the results obtained using the Self-Organizing Maps
When testing the robustness of our interpretation of the dataset and the protocol used, we obtained very similar results using our original data and only even-numbered samples. However, some differences occurred for the odd-numbered samples that, nevertheless, separated the forest (riparian, terra firma forest and forest fragment) from the anthropized areas (village, recent and abandoned plantations) (figures not shown). Consequently, the experimental protocol used in this study is appropriate for comparing the ant assemblages; even a relatively weak data set (20 pit-fall traps for each area compared) can produce valuable and robust information for the study of such a succession cycle.
Our conclusion is three-fold: (1) The use of the pit-fall trap technique, well adapted to this study, can be recommended for other studies at geographically remote sites because it involves only a minimum amount of equipment and time; (2) The SOM is a powerful tool for studying and comparing ant communities, allowing the interactions between faunal components and vegetal structure to be solidly interpreted, even when the data seem relatively weak; (3) The combination of using pit-fall traps to sample ants and the SOM algorithm to interpret the data appears to be very well adapted to analyzing a succession cycle where the plots to be sampled are of different sizes and distances from each other as is the case in this landscape influenced by traditional Amerindian agricultural practices.
Acknowledgements
We are grateful for Sébastien Durou, Charles L.G. Sanchez and Cristiana Souza Vieira for technical support and to John T. Longino and Marco Antônio Matiello Fadini for helpful commentaries on an earlier version of this manuscript. This research was funded by a CNPq grant (to J.H.C. Delabie), GIP ECOFOR (N° 98) for field studies in 2000, the Programme Amazonie of the French Centre National de la Recherche Scientifique (projects BIG and 2ID) and the Programme Convergence 2007–2013, Région Guyane from the European Community (project DEGA).