

1 Introduction
Understanding the adaptive success of invasive species is a long-standing problem, challenging theoretical impacts of the genetic bottleneck on introduced populations [1]. Nonetheless, the question has rarely been addressed to investigate the phenotypic variability in natural populations. Phenotypic variability is the raw material for Darwinian natural selection and for understanding the evolutionary capacity of a natural population. This obviously implies that part of the variance is heritable, i.e. the genetic additive variance [2]. Drosophilid species are a widespread model in evolutionary biology, and heritability in nature has been addressed mostly in Drosophila melanogaster natural populations, by a series of investigators [3–12]. Most studies have considered body size related traits, although some other trait such as bristle numbers and body pigmentation were sometimes considered. A general conclusion has been that heritability in nature was generally much less than in laboratory experiments. This is due to the fact that the genetic variance is assumed to be quite stable while the environmental component, due to heterogeneous environmental conditions (HEC) may be considerably increased [13,14]. A convenient way to compare the results from different studies is to consider a relative measurement of the phenotypic variability, i.e. the coefficient of variation (CV). All previous investigations on body size variability in natural populations of D. melanogaster and D. simulans have found consistent results with CVs in the range of 6–7 (see [7,12]). By contrast, variability in the laboratory was always much less, with generally a CV inferior to 3.
In a recent paper [15], the phenotypic variability of two recent drosophilid invaders (Zaprionus indianus and Z. tuberculatus) was investigated in the Nile delta in Egypt. Two main conclusions were drawn. Firstly, the phenotypic variance of size traits was very high, with a CV approaching 10, while a usual, lesser value (2.5), was found in laboratory grown progeny. Secondly, a meristic character, the sternopleural (STP) bristle number exhibited almost the same variability in nature and in the laboratory.
Z. indianus is a powerful invasive species, which, from a tropical African origin, successfully colonized the Indian subcontinent more than 4 decades ago, more recently South America and is found now in North America [16]. Yassin et al. [15] suggested that the very high variability of size observed in the Nile delta could be a consequence of very harsh heterogeneous environmental conditions (HEC) under a Mediterranean climate, including hot temperature, desiccation stress and insecticide treatments. We tried to check this hypothesis by investigating other populations of the same species living in a completely different and more benign tropical environment. Three natural samples of Z. indianus were collected at latitudes close to tropics and living under a wet and humid climate in Brazil. These population are genetically different from the Egyptian population, as was shown by cytogenetic [17,18] and molecular studies [16]. Our main conclusion is that, in wild collected flies, body size variability was always very high and similar across populations and continents. This very high phenotypic plasticity might be an intrinsic property of Z. indianus, reflecting its capacity to use, in a single place, a broader diversity of resources and microhabitats. We also confirmed the relative insensitivity of bristle number to HEC, and discuss the developmental significance of this observation. In addition, interesting morphometrical information has been obtained on thoracic shape, correlations among traits and sexual dimorphism.
2 Methods
2.1 Populations investigated
The Egyptian population (see [15]) was collected in November 2004, in the farm of the University of Alexandria (latitude 31.1° N; sea level), in an orchard of guava trees (average temperature was less than 20 °C). Two Brazilian samples were collected in Rio de Janeiro (22.6° S; sea level) on the campus of the Federal University. One sample was collected at the end of spring (December 2004), during the rainy season with an average temperature of 25 °C. The other sample was collected in the same place in April 2005, at the end of summer and the average temperature was 26 °C. A last Brazilian sample was collected in December 2004 from Campinas in Sao Paulo State (22.9° S), again in the University campus. Due to a higher altitude (600 m) average temperature was less and about 23 °C.
2.2 Collection and laboratory breeding
In all cases, flies were collected with banana traps, that is, rotting bananas in plastic bottles, hanging in trees. Since Zaprionus were always very abundant, a sufficient number could be collected within 2 to 3 days. A random sample of 50 wild living flies of each sex was measured a few days after collection. For obtaining a laboratory progeny, 5 groups of 10 females and 10 males collected in nature were used as parents for each population. Each group was allowed to oviposit on a killed-yeast, rich nutrient medium, and transferred daily to a fresh vial. Oviposition took place at 20–22 °C and then, vials with eggs were settled at 25 °C. About 13 days later, emerged adults were transferred to fresh food and stored at a low temperature (17 °C), waiting to be measured. From each group, 10 females and 10 males were randomly taken and measured, for a total of 50 flies of each sex in each population. Variations among vials were small and non-significant, so that the data were pooled for each population.
2.3 Traits measured
On each fly, 4 quantitative traits were measured. Three of them are metric, size-related traits measured with a micrometer in a binocular microscope, and then transformed into mm × 100. The last is a meristic, bristle number trait. The 3 metric traits are wing length (W) measured from the thoracic articulation to the tip; thorax length (T) on a left side, lateral view, from the neck to the tip of the scutellum; thorax width (t) measured from a ventral view as the distance between the two major posterior sternopleural bristles. From the 3 size traits, we calculated 2 ratios. The wing/thorax ratio () is negatively correlated to wing loading [19], and provides information on flight capacity. The thorax length/thorax width () ratio, which, to our knowledge, was never considered except by Yassin et al. [15], provides some information on the shape of the thorax and may be defined as an elongation index. The ratio was also calculated but it did not provide interesting information so that it is not considered further in this article.
Sternopleural bristles (STP), a meristic trait, were counted on each side of the thorax and their sum used in most calculations. Finally, sexual dimorphism (SD) of all traits was considered and analyzed as a female/male (F/M) ratio [20,21]. Data were analyzed with SYSTAT 12.0 (Systat Software Inc., 2007).
3 Results
3.1 Mean values
Basic data for the 6 characters investigated in the 4 populations are given in Table 1. For each trait, the results were submitted to a 3 way ANOVA, shown in Table 2. For the sake of simplicity, the table gives only the amount of the total variability explained by each factor or their interactions. For all traits, the error term due to individual variability accounts at least for 60% and sometimes more than 80% of the total variance. According to the traits, the results may be subdivided into 3 categories.
Mean values of the various traits investigated in nature and laboratory flies for 3 Brazilian and one Egyptian population, living under different climates. Each sample is the mean of 50 flies. The overall mean among populations is also given, as well as the between-population coefficient of variation (CV).
| Trait | Sex | Population | Mean ± s.e. | CV | |||
| Rio Dec_2004 | Rio Apr_2005 | Campinas Dec_2004 | Alexandria Nov_2004 | ||||
| Nature | |||||||
| Wing length | F | 281.44 | 266.40 | 283.20 | 275.96 | 276.75 ± 3.78 | 2.73 |
| M | 271.52 | 255.20 | 275.36 | 269.44 | 267.88 ± 4.40 | 3.29 | |
| Thorax length | F | 125.84 | 120.12 | 125.40 | 121.28 | 123.16 ± 1.44 | 2.34 |
| M | 121.72 | 114.72 | 122.24 | 119.00 | 119.42 ± 1.72 | 2.88 | |
| Thorax width | F | 71.76 | 68.92 | 71.32 | 68.40 | 70.10 ± 0.84 | 2.40 |
| M | 70.16 | 67.36 | 70.72 | 68.24 | 69.12 ± 0.79 | 2.29 | |
| W/T ratio | F | 2.240 | 2.224 | 2.261 | 2.280 | 2.251 ± 0.012 | 1.07 |
| M | 2.236 | 2.232 | 2.257 | 2.270 | 2.248 ± 0.009 | 0.76 | |
| T/t ratio | F | 1.754 | 1.742 | 1.759 | 1.773 | 1.757 ± 0.006 | 0.70 |
| M | 1.736 | 1.703 | 1.729 | 1.743 | 1.728 ± 0.009 | 1.00 | |
| STP number | F | 18.98 | 17.32 | 19.28 | 20.70 | 19.07 ± 0.69 | 7.27 |
| M | 17.98 | 17.00 | 17.66 | 20.02 | 18.16 ± 0.65 | 7.17 | |
| Laboratory | |||||||
| Wing length | F | 292.56 | 289.60 | 288.80 | 290.88 | 290.46 ± 0.82 | 0.57 |
| M | 285.60 | 285.60 | 284.56 | 286.72 | 285.62 ± 0.44 | 0.31 | |
| Thorax length | F | 134.52 | 133..44 | 131.92 | 133.36 | 133.31 ± 0.53 | 0.80 |
| M | 133.72 | 132.64 | 130.56 | 132.96 | 132.47 ± 0.68 | 1.02 | |
| Thorax width | F | 78.16 | 76.64 | 75.82 | 76.44 | 76.77 ± 0.50 | 1.29 |
| M | 78.46 | 77.26 | 76.32 | 77.20 | 77.31 ± 0.44 | 1.14 | |
| W/T ratio | F | 2.175 | 2.171 | 2.190 | 2.181 | 2.179 ± 0.004 | 0.39 |
| M | 2.136 | 2.154 | 2.180 | 2.160 | 2.156 ± 0.009 | 0.83 | |
| T/t ratio | F | 1.722 | 1.741 | 1.740 | 1.750 | 1.737 ± 0.005 | 0.62 |
| M | 1.705 | 1.717 | 1.711 | 1.725 | 1.714 ± 0.004 | 0.46 | |
| STP number | F | 18.94 | 18.94 | 19.14 | 21.38 | 19.60 ± 0.60 | 6.07 |
| M | 17.44 | 18.12 | 17.42 | 20.00 | 18.25 ± 0.61 | 6.66 |
Results of a three-way ANOVA applied on each investigated trait. For clarity, only the percentage of the total variance explained by each factor is given. Conditions refer to wild living and laboratory grown flies. df = degrees of freedom.
| Factor | df | Wing length | Thorax length | Thorax width | STP | ||
| Sex (S) | 1 | 3.38⁎⁎⁎ | 1.16⁎⁎⁎ | 0.03 | 0.84⁎⁎⁎ | 7.22⁎⁎⁎ | 5.62⁎⁎⁎ |
| Condition (C) | 1 | 17.78⁎⁎⁎ | 29.70⁎⁎⁎ | 35.27⁎⁎⁎ | 34.07⁎⁎⁎ | 3.23⁎⁎⁎ | 0.41⁎ |
| Population (P) | 3 | 3.65⁎⁎⁎ | 1.61⁎⁎⁎ | 1.89⁎⁎⁎ | 3.36⁎⁎⁎ | 2.42⁎⁎⁎ | 18.83⁎⁎⁎ |
| S × C | 1 | 0.29 | 0.46⁎ | 0.37⁎ | 0.48⁎⁎⁎ | 0.11 | 0.22 |
| S × P | 3 | 0.11 | 0.09 | 0.09 | 0.23 | 0.32 | 0.69 |
| C × P | 3 | 3.63⁎⁎⁎ | 2.06⁎⁎⁎ | 1.40⁎⁎⁎ | 1.07⁎⁎⁎ | 2.10⁎⁎⁎ | 1.91⁎⁎⁎ |
| S × C × P | 3 | 0.06 | 0.07 | 0.04 | 0.15 | 0.16 | 0.05 |
| Error | 784 | 71.09 | 64.85 | 60.91 | 59.80 | 84.44 | 72.26 |
⁎ ;
⁎⁎⁎ .
For the 3 size related traits, the major effect is due to developmental conditions (nature versus laboratory), which accounts on average for 27.6% of the total variance. Population effects are also highly significant, but explain only 2.38% of the total variance. The sex effect is highly significant for wing and thorax length, but not for thorax width. Among interactions, a highly significant condition × population (C × P) interaction is observed accounting for 2.36% of the total variance. The difference between wild and laboratory flies is illustrated by the overall distribution of wing lengths (Fig. 1A): wild living flies are far more variable than their laboratory progeny, and the lower mean value is due to the occurrence of many small or very small individuals.
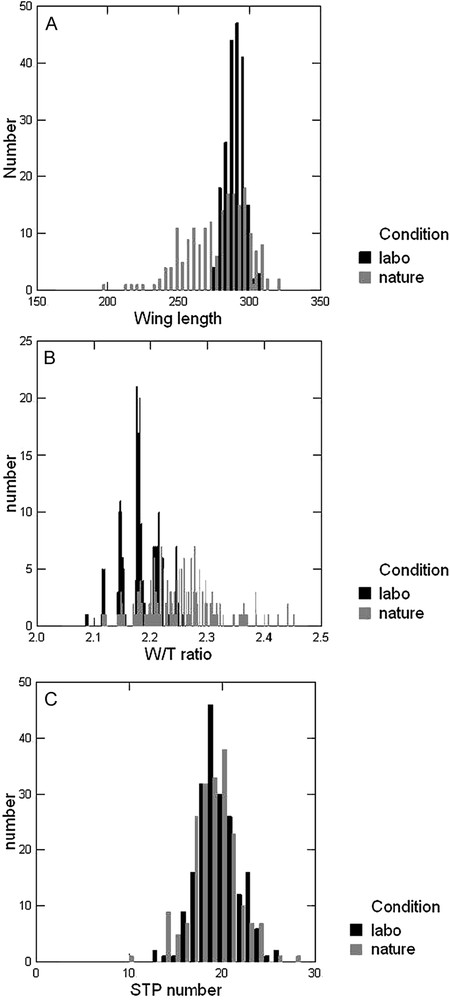
Frequency distributions of 3 quantitative traits in wild collected Zaprionus indainus and their F1 laboratory progeny. (A) Wing length (mm × 100), (B) wing/thorax length ratio, (C) Sternopleural bristles.
The two ratios among size traits provide quite different results. The ratio is mainly sensitive to developmental conditions and population. Minor effects are due to sex and to sex × condition (S × C) and C × P interaction. The ratio (the thorax elongation) is mostly influenced by sex and, to a lesser degree, by conditions, populations and C × P interaction. The condition effect is illustrated for ratio in Fig. 1B. As seen from Table 1, wild collected flies have an average higher ratio, i.e. a lesser wing loading. The distribution in wild flies is characterized by a long tail of individuals with a greater ratio. A closer inspection of the data revealed that the individuals with very high ratios were those with a smaller size.
Finally, the STP bristle number is mainly influenced by populations (18.8%), sex (5.6%) while conditions have only a very minor effect. The similarity of the distributions of STP bristles in nature collected and laboratory flies is illustrated in Fig. 1C.
Considering the mean values in Table 1, we may discuss more precisely some of these differences. The sex effect is, in almost all cases, due to the fact that females exhibit slightly greater values than males. There is however one exception, for the thorax width which, in laboratory grown flies, is greater in males.
Laboratory flies have greater mean values than wild collected ones. This is classically explained by the fact that many wild collected flies have a small size, due to adverse developmental conditions. Interestingly, the difference between conditions for STP bristle is very small, and the effect seems variable according to the population. In most cases, there are more bristles in females, but the reverse is observed in the December sample of Rio.
Differences among populations may have a genetic and an environmental origin. Size variation among populations, appreciated by a between-populations CV (Table 1) are much greater for wild living (average ) than for laboratory flies (average ) ( in each case). Between-populations CVs are less for the two ratios: for wild living and for laboratory grown flies. Finally, the difference between conditions almost disappears for STP bristle ( vs. ) but the between-populations heterogeneity is relatively greater than for size traits.
3.2 Phenotypic variability within populations (CVs)
As stated in Section 2, we used a standardized statistics, the CV, to compare the different samples and different traits. Averaged values, over populations, are given in Table 3 as well as the results of an ANOVA.
Mean values of the within-sample coefficients of variation. F: female, M: male. For each trait, 16 values are available and submitted to a three-way ANOVA. The percentage of total variability is given, as well as the level of significance as well as the number of degrees of freedom; the error term comprises all interactions.
| Trait | CV mean values | ANOVA (% VAR) | ||||||
| Nature | Laboratory | Sex | Condition | Population | Error | |||
| F | M | F | M | 1 | 1 | 3 | 10 | |
| Wing length (W) | 7.57 ± 0.72 | 8.12 ± 0.73 | 2.16 ± 0.01 | 2.28 ± 0.19 | 0.32 | 90.08⁎⁎⁎ | 1.59 | 8.01 |
| Thorax length (T) | 9.28 ± 0.83 | 10.07 ± 0.76 | 2.46 ± 0.26 | 2.40 ± 0.19 | 0.23 | 92.23⁎⁎⁎ | 1.25 | 6.28 |
| Thorax width (t) | 9.15 ± 0.81 | 9.83 ± 0.71 | 2.57 ± 0.30 | 2.69 ± 0.13 | 0.31 | 91.84⁎⁎⁎ | 1.30 | 6.55 |
| W/T | 2.67 ± 0.20 | 3.24 ± 0.30 | 1.56 ± 0.11 | 1.44 ± 0.09 | 1.84 | 79.02⁎⁎⁎ | 6.85 | 12.29 |
| T/t | 2.25 ± 0.15 | 2.63 ± 0.14 | 2.09 ± 0.29 | 1.82 ± 0.05 | 0.33 | 32.89⁎ | 10.86 | 55.92 |
| STP | 11.46 ± 0.92 | 11.64 ± 0.71 | 10.20 ± 0.39 | 10.30 ± 0.58 | 0.28 | 23.34 | 16.10 | 60.28 |
⁎ ;
⁎⁎⁎ .
For the 3 size-related traits developmental conditions explained, on average, more than 91% of the total variation, and the error term only 7%. Neither sex nor population had a significant effect. For each condition, we compared the 3 traits (ANOVA, not shown) and there was no significant difference among them. The average CVs for body size in Z. indianus are thus and in wild living and laboratory grown flies, respectively (4 populations ×3 traits ×2 sexes, thus in each case). In other words, the variance (the squared CV) is 13.7 times greater in nature than in the laboratory.
For the two ratios, the average CVs were clearly reduced with respect to the traits themselves, with a mean value of in nature and of in the laboratory ( in each case). Such a reduction in variance is expected when a correlation exists between two traits. ANOVA revealed only a significant effect for conditions, more pronounced for the ratio.
Finally, the results for STP bristles clearly confirmed what was already suspected by Yassin et al. [15]. For this trait, developmental conditions did not practically change the phenotypic variability. Although the condition explained 23% of the total variability, this effect was not significant. Average CVs over sex and population are and in wild and laboratory flies, respectively ( in each case).
The contrasting variability pattern observed between metric and meristic traits is illustrated in Fig. 2, as correlation diagrams between CVs.
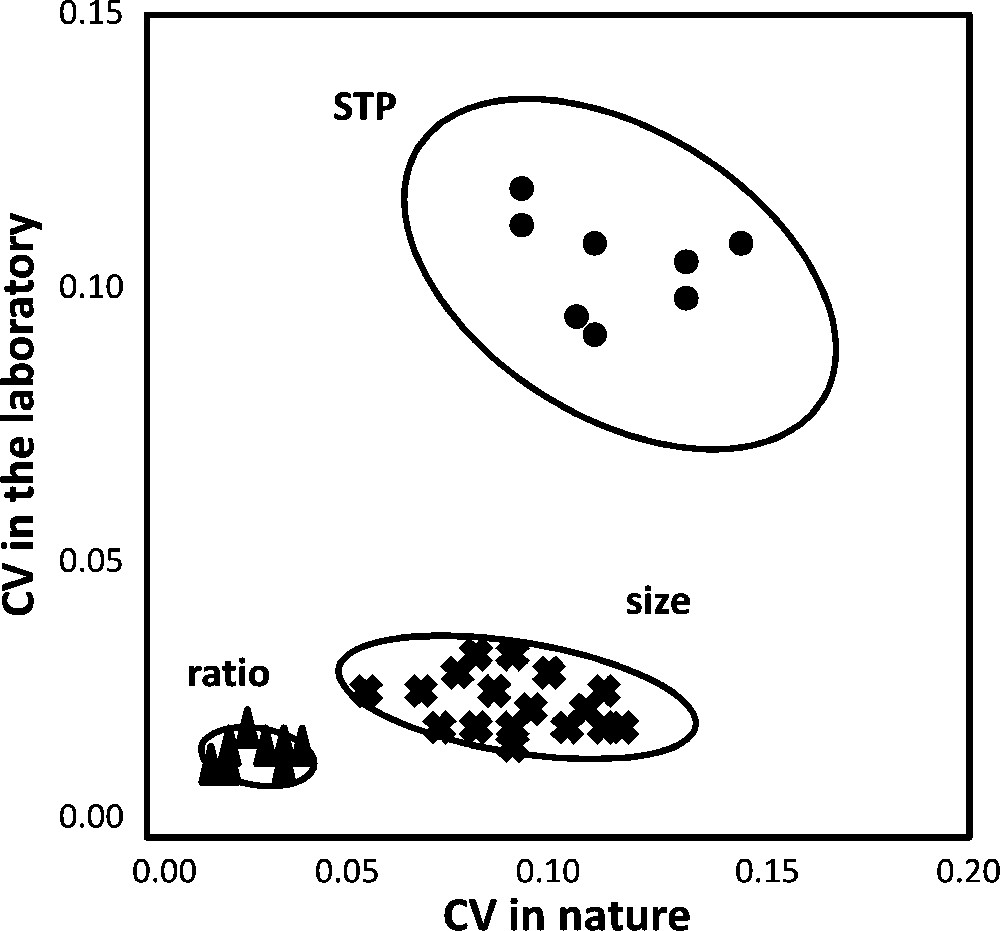
Correlation diagram between coefficients of variation (CV) in nature-collected and laboratory-grown flies. STP: sternopleural bristles (n = 8 samples of 50 flies, sexes separated); ratios W/T and W/t (n = 16); size: wing length (W), thorax length (T) and thorax width (t) (n = 24). Notice the similar variability in nature and laboratory flies for STP number, but the strong reduction of size variability in laboratory flies. Ellipses of 95% probability are drawn to help visualize the distribution.
3.3 Correlations among traits
Correlation coefficients were calculated in each population for 6 pairs of traits, and the average values are given in Table 4, as well as the results of a 3 way ANOVA, after a z-transformation.
Correlation coefficients among population means of various traits. Each value is the mean ± s.e. of four observations. In each case, data were submitted to ANOVA after a z transformation, and the table shows the percentage of total variance explained by each factor. W: wing length, T: thorax length, t: thorax width, STP: sternopleural bristles (sum), STPR and STPL: bristles on right and left side, respectively.
| Correlation | ANOVA (% VAR) | |||||||
| Nature | Laboratory | Sex | Condition | Population | Error | |||
| F | M | F | M | 1 | 1 | 3 | 10 | |
| W − T | 0.97 ± 0.01 | 0.97 ± 0.01 | 0.78 ± 0.05 | 0.80 ± 0.04 | 0.11 | 86.34⁎⁎⁎ | 2.62 | 10.93 |
| W − t | 0.95 ± 0.01 | 0.96 ± 0.01 | 0.60 ± 0.07 | 0.66 ± 0.05 | 0.27 | 91.28⁎⁎⁎ | 2.03 | 6.42 |
| T − t | 0.97 ± 0.01 | 0.96 ± 0.01 | 0.68 ± 0.04 | 0.73 ± 0.05 | 0.01 | 92.45⁎⁎⁎ | 0.92 | 6.63 |
| STP − W | 0.39 ± 0.07 | 0.34 ± 0.10 | 0.03 ± 0.04 | −0.03 ± 0.10 | 1.10 | 60.94⁎⁎⁎ | 20.98⁎ | 16.98 |
| STP − T | 0.38 ± 0.08 | 0.34 ± 0.08 | 0.12 ± 0.03 | 0.02 ± 0.10 | 2.41 | 53.48⁎⁎⁎ | 24.06⁎ | 20.05 |
| STP − t | 0.38 ± 0.06 | 0.34 ± 0.10 | 0.08 ± 0.03 | 0.17 ± 0.09 | 0.48 | 40.13⁎⁎⁎ | 24.08 | 35.31 |
| STPL − STPR | 0.48 ± 0.07 | 0.54 ± 0.08 | 0.47 ± 0.07 | 0.40 ± 0.03 | 0.12 | 9.67 | 2.76 | 87.46 |
⁎ ;
⁎⁎⁎ .
Among the size traits, 3 correlations are calculated, and a major difference is found between nature and laboratory flies: developmental conditions explain almost 90% of the total variance. Average correlations over the 3 traits are and for wild collected and laboratory grown flies respectively ( in each case). This observation is illustrated in Fig. 3A. The 3 possible correlations were also compared within each conditions by ANOVA and a significant heterogeneity was evidenced in laboratory flies: , . A post-hoc test showed that the correlation was greater for than for .
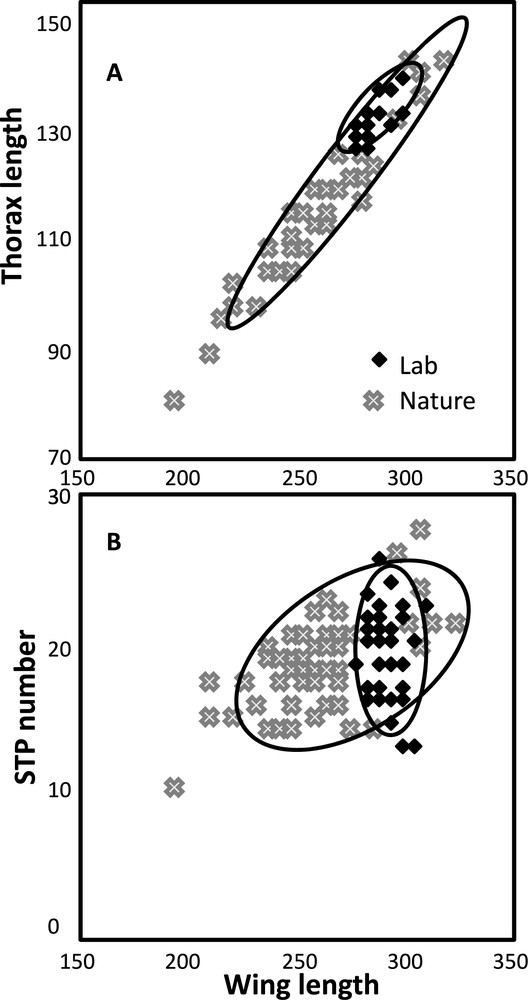
Correlation diagrams between size (wing length) and (A) another size trait, thorax length; (B) sternopleural bristle number. Notice the very high correlation between the two size traits and the low or absence of correlation with sternopleural bristles. Sample size is 400 flies in each case (see legend, Fig. 1). Ellipses of 95% probability are drawn to help visualize the distribution.
Three correlations involve the STP bristles and each size trait. Again, a clear contrast was found between nature and laboratory flies with average values of and , respectively (Fig. 3B). Only the first correlation is significantly greater than zero. Table 4 also shows that, when STP bristles were involved, a small but significant heterogeneity existed among populations. A more detailed inspection of the data revealed that this effect was mainly due to low correlations in the Rio December 2004 population (average values: nature: ; laboratory: , in each case). Such a result is difficult to explain since it was not found in the Rio April 2005 population.
In conclusion, correlations are less in laboratory than in wild living flies, and also much less between STP bristles and size traits than between different size traits, and these results are illustrated in Fig. 4.
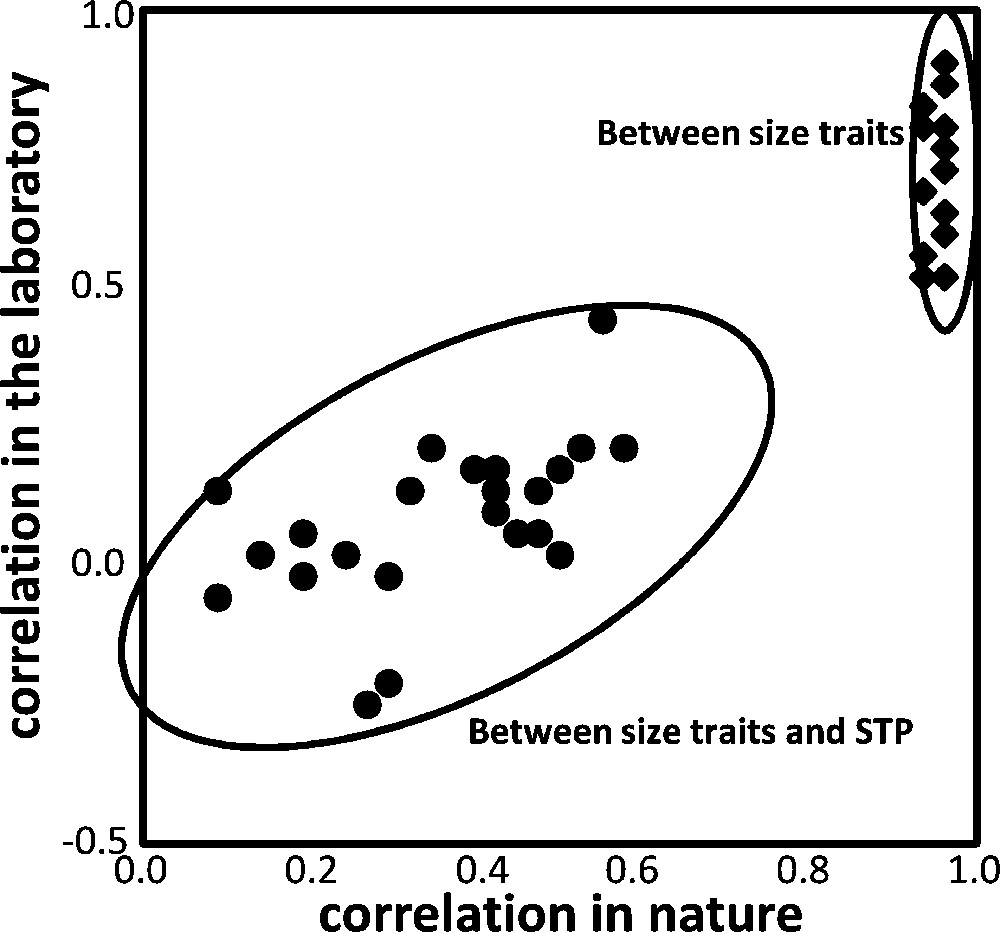
Scatter plot of the correlation coefficients in wild collected and laboratory flies, between different kinds of traits (n = 24 in each case, see Table 4). Between size traits, the correlations are always very high, although less in the laboratory. Between size and STP number, correlations are much less, and significant only in wild-collected flies. Ellipses of 95% probability are drawn to help visualize the distribution.
Table 4 also presents the correlation between STP bristle on the left and right sides of the thorax. Such a correlation is an estimate of the strength of bilateral symmetry [22]. Our results show that no significant difference was detected between conditions. The overall value of is quite low, and suggests a fairly strong developmental noise.
3.4 Sexual dimorphism
Sexual dimorphism (SD) was calculated as a female/male (F/M) ratio for each trait in each sample of 50 flies of each sex. The fairly big sample size reduces to role of the sampling error and permits quite accurate calculations. The results are summarized in Table 5.
Sexual dimorphism, expressed as a female/male ratio and the various traits investigated in different populations. Nat: nature flies; Lab: laboratory progeny. Comparison is between Nat and Lab flies (Student's test, df = 6).
| Trait | Condition | Rio Dec_2004 | Rio Apr_2005 | Campinas Dec_2004 | Alexandria Nov_2004 | Mean ± s.e. | Comparison (t) |
| Wing length | Nat | 1.037 | 1.044 | 1.029 | 1.024 | 1.034 ± 0.004 | 3.31⁎ |
| (W) | Lab | 1.024 | 1.014 | 1.015 | 1.015 | 1.017 ± 0.002 | |
| Thorax length | Nat | 1.033 | 1.046 | 1.026 | 1.010 | 1.031 ± 0.006 | 2.95⁎ |
| (T) | Lab | 1.006 | 1.006 | 1.010 | 1.003 | 1.006 ± 0.005 | |
| Thorax width | Nat | 1.023 | 1.023 | 1.008 | 1.002 | 1.014 ± 0.005 | 3.87⁎⁎ |
| (t) | Lab | 0.996 | 0.992 | 0.993 | 0.990 | 0.993 ± 0.001 | |
| W/T ratio | Nat | 1.002 | 0.997 | 1.002 | 1.005 | 1.001 ± 0.002 | 2.83⁎ |
| Lab | 1.018 | 1.008 | 1.005 | 1.012 | 1.011 ± 0.003 | ||
| T/t ratio | Nat | 1.011 | 1.023 | 1.017 | 1.017 | 1.017 ± 0.002 | 1.23ns |
| Lab | 1.010 | 1.014 | 1.017 | 1.013 | 1.014 ± 0.001 | ||
| STP number | Nat | 1.055 | 1.019 | 1.092 | 1.034 | 1.050 ± 0.016 | 1.25ns |
| Lab | 1.086 | 1.045 | 1.099 | 1.069 | 1.075 ± 0.012 |
⁎ ;
⁎⁎ .
For the 3 size traits, sex dimorphism was greater in nature than in laboratory grown flies. This suggests that males were relatively more affected by adverse conditions encountered in nature. The F/M ratio was generally greater than one, except for thorax width in the laboratory: in that case, males were bigger than females and the ratio less than unity. The dimorphism of ratio was also greater in the laboratory. This is a logical consequence of the fact that thoracic SD was more strongly reduced by laboratory development than that of the wing. SD of ratio was, however, not affected by developmental conditions. An interesting observation is that this ratio is significantly greater than unity. In other word, the female thorax is more elongated than the male thorax. For STP number, the dimorphism was on average more pronounced than for size. Males and females are slightly more similar in nature, but the difference is not significant.
4 Discussion
4.1 Body size variation
The role of body size in the success of invasive species has been strongly hypothesized in many previous studies [23–25]. In morphometry, body size variation is often considered as a cause for other traits to evolve, due to allometric relationships [26,27]. In our case, size variations appear as an effect of the environment and more precisely of heterogeneous environmental conditions (HEC) encountered by different individuals in natural habitats. From a functional point of view, the determinism of size is well understood, resulting from an interaction between metabolic activity and hormones production in larvae [28]. Two major environmental factors are known to influence adult size: temperature and feeding. An increase in temperature results in an overall decrease of size, sometimes called the temperature–size rule [29,30]. In the present study temperature variations could play a minor role, since different resources may be at slightly different temperatures, for example in sunny or shadowed places. Such effects are likely to be of little importance, since Zaprionus larvae tend to pupate in the soil (unpublished observation), i.e. under more stable conditions. Little doubt therefore remains that most of the variability was due to feeding effects (different resources with different nutritive values, larval competition, etc.). Such variable feeding conditions will affect similarly the different traits which are related to size, resulting in a very high variance and very high correlations. Contrary to our expectation, natural populations living under a humid climate were not less variable that the population living under a dry and more stressful climate. The very high phenotypic variability in Zaprionus indianus might thus be an intrinsic property of this invasive species, related for example to a capacity to use a broader diversity of resources and micro habitats and to better survival of very small larvae.
Up to now, other species investigated in the wild such as D. melanogaster and D. simulans have also evidenced a greater variability in nature, but all published papers so far [3,5,7,12,31] have found CV values in the range 6–7%, contrasting with an average of 9% in Zaprionus [15]. In other words, the nature phenotypic variance in Z. indianus is almost twice that in other species. The variance ratio (F parameter) is highly significant due to the great number of flies measured ( for Zaprionus). Interestingly, under the favorable environment of the laboratory, the CV found in Z. indianus was 2.5%, that is practically identical to what is found in other species [12,32].
4.2 Size ratios: body shape
The two calculated ratios ( and ) were clearly less variable than the trait themselves. This is expected when traits are correlated, and this a classical means for getting rid, at least partly, of the body size effect. See for example the many indices used in drosophilid taxonomy [33,34].
The wing/thorax () ratio, which is negatively correlated to wing loading [19] is known to decrease almost linearly according to growth temperature [32] and thus exhibits a parallel decrease with body size. We have found, however, that this ratio was greater in wild living than in laboratory grown flies, in spite of an average smaller size. This suggests that adverse feeding conditions affect more the thorax than the wing, and this novel hypothesis should be submitted to specific experiments.
As stated previously, the (thorax length/thorax width) ratio provides information on the shape of the thorax and defines an elongation index. This shape did not vary very much between developmental conditions and, in this respect, it could be considered as strongly canalized. It is, however, not constrained among species, since the average value in Z. indianus (1.73) is much larger than in D. melanogaster (1.55; J.R.D. unpublished).
4.3 Sternopleural bristles
STP bristle number is a paradigm in Drosophila quantitative genetics studies, with a high heritability and a fast response to directional selection [2]. It is also a target of natural selection, evidenced by latitudinal clines [35,36]. Our data confirmed the high level of individual variability (CV around 10%) which may be considered as a consequence of a low level of developmental canalization [37]. The comparison of wild and laboratory grown flies points, surprisingly, to an opposite conclusion: HEC, which are efficient to produce a huge amount of body size variance, are not able to increase significantly the STP variance, in agreement with previous observations [15]. Such a difference is difficult to interpret. In D. melanogaster, it was shown [38] that a daily thermal stress mostly resulted in an antisymmetric response of STP bristle number, revealing a sensibility of the trait to internal, left–right side variations. May be this sensibility to an internal developmental noise makes the trait less sensitive to external perturbations. STP number is not, however, completely protected against HEC. Wild living flies had somehow less bristles than laboratory ones although this effect was complicated by a condition × population interaction (Table 2). More convincingly, the correlation between bristle number and size was significantly positive in nature, but very close to zero in laboratory flies, demonstrating some sensitivity of STP number to HEC. Anyway, this low sensitivity suggests that the two components of the phenotypic variance (environmental and genetic) are not very different in nature and laboratory. In other words, heritability in nature might be high for STP number, and this hypothesis deserves further investigations.
4.4 Sexual dimorphism
Our data confirmed the very low SD of body size in Z. indianus, and a greater SD for STP number [21]. Concerning the effects of developmental conditions, we found small, significant differences in the two kinds of traits but in opposite direction: lesser SD in laboratory flies for size traits, greater SD for STP bristles in wild flies. A higher SD in a harsh environment suggests that males are more affected than females. However, the discrepancy between size and bristle number cannot be accounted for by such a general hypothesis.
For the elongation index () we made an interesting observation: SD was not different according to conditions, but always significantly superior to 1. This means that females have a relatively longer thorax than males; this shape difference is very stable and not affected by the environment. For the ratio, a major effect due to conditions was found, that is a higher value in the wild samples (34% of total variance explained; Table 2). This might be due to lower developmental temperature in the nature for some samples (Alexandria and Campinas) but the expected effect is not big. It is more likely that the production of very small flies by HEC is accompanied by a stronger reduction of the thorax length than that of the wing length (Fig. 1B).
5 Concluding remarks and perspectives
A first conclusion is that our data suggest further investigations for answering two questions: (1) Are there significant and consistent differences among species with respect to their phenotypic variability in nature? (2) Do other meristic traits, such as abdominal bristles or ovariole number, react in the same way than STP bristles?
There is a need of further research studies on the ecology of drosophilids in nature, for example what are the larval breeding and pupal sites. Experimental studies should also consider the effect of manipulating the developmental condition, using different foods and different larval densities. An interesting observation of this paper is that a reduction of adult size seems to increase the ratio, a result which is in opposition with the well know temperature effect [32].
Finally, we would like to point out the general interest of investigating phenotypic variability in nature, which is the raw material for natural selection and a significant parameter in life history investigations. Moreover, morphological variation of natural populations is the only information available to paleontologists [39]. A recent paper [40] evidenced a Cambrian peak in morphological variation within trilobite species. Such a variability of the phenotypic variance is certainly very interesting in evolutionary studies, but more extensive data on extant species should certainly be appreciated.
Acknowledgements
This work was supported by grants from the Comité français d'évaluation de la coopération universitaire avec le Brésil (COFECUB), the Coordenação de Aperfeicoamento de Pessoal de Nivel Superior (CAPES) and the Fundação de Amparo à Pesquisa do Estado de São Paulo (FAPESP).