

1 Introduction
Pycnogonids or sea spiders are exclusively marine organisms, found from shallow waters to abyssal depths in all oceans and seas. They comprise 1334 described species arranged in 10 families [1]: Ammotheidae, Austrodecidae, Callipallenidae, Colossendeidae, Endeidae, Nymphonidae, Pallenopsidae, Phoxichilidiidae, Pycnogonidae and Rhynchothoracidae. The group is characterized by several morphological autapomorphies, such as the prominent external proboscis, the ovigers (a specialized pair of appendages on the cephalosoma) and multiple gonopores [2]. Most morphological and molecular systematists consider that they belong to Chelicerata [3–6], and the homology between the chelifores of pycnogonids and chelicerae of euchelicerates (horseshoe crabs and arachnids) has been confirmed using Hox gene expression patterns [7].
Six molecular markers are currently used in most arthropod phylogenies dealing with inter- and intrafamilial relationships: 18S and 28S rRNA genes (18S and 28S), Histone H3 (H3), cytochrome c oxidase subunit 1 (CO1), 12S and 16S rRNA genes (12S and 16S). For instance, they have been used to infer the phylogenetic relationships among centipedes [8], flies [9], decapods [10], and spiders [11]. The phylogeny of Pycnogonida has been also explored recently employing all these six markers [1] or only the 18S gene [12]. These studies have provided conflicting results for interfamilial and intergeneric relationships (Fig. 1). Four families were found monophyletic in both analyses: Colossendeidae, Endeidae, Pallenopsidae and Pycnogonidae. Members of the families Callipallenidae and Nymphonidae were grouped together, but the monophyly of each family was not supported. Concerning the family Ammotheidae, Ascorhynchus and Eurycyde were found to be distantly related to other ammotheid genera – either as the sister group of Nymphonidae and Callipallenidae [1], or as an early offshoot of sea spiders [12]. Surprisingly, Nakamura et al. [12] included them in their own family Ascorhynchidae, even though their analyses indicated paraphyly of this group. Other genera of Ammotheidae, such as Ammothea, Achelia, Sericosura and Tanystylum, were found to belong to a clade including the family Endeidae, as well as Anoplodactylus, one of the three genera of the family Phoxichilidiidae. In Arango and Wheeler [1], Rhynchothorax (Rhynchothoracidae) was also included in this clade, whereas Phoxichilidium was related to Pycnogonidae, suggesting polyphyly of Phoxichilidiidae. On the contrary, Nakamura et al. [12] found Rhynchothorax to be the sister-group of Pycnogonidae.

Conflicts between previous molecular phylogenies of Pycnogonida. The phylogeny of Arango and Wheeler [1] (on the left) is compared to the phylogeny of Nakamura et al. [12] (on the right). Main conflicts lie in the positions of the families Pallenopsidae and Rhynchothoracidae, and those of the genera Ascorhynchus, Eurycyde and Tanystylum.
The main aim of the present study is to identify the causes or sources of conflicting results between the molecular studies of Arango and Wheeler [1] and Nakamura et al. [12], in order to provide a better understanding of pycnogonid phylogeny. Several non-exclusive hypotheses can be advanced to explain these conflicts: inadequate taxonomic sampling (including choice of outgroup species), DNA contamination, misidentification of species, missing data, use of different methods of tree reconstruction (direct optimization versus multiple alignment, total evidence versus separate analyses), over-interpretation of the results (lack of signal), conflicting signals among genes, and significant heterogeneity in nucleotide composition and/or evolutionary rates among taxa.
To address these issues and to reassess the phylogeny of Pycnogonida, we produced new sequences and constructed two different datasets for phylogenetic analyses. The first dataset incorporated 115 sequences of the 18S gene, representing a large diversity of pycnogonid species. It was used to allow direct comparisons with the study of Nakamura et al. [12], and to detect possible cases of DNA contamination or taxonomic misidentification. The second dataset included all of the six molecular markers used in Arango and Wheeler [1]: three nuclear genes (18S, 28S and H3) and three mitochondrial genes (12S, 16S and CO1). The sampling was intentionally reduced to 43 taxa, to avoid the misleading impact of missing data in phylogenetic reconstruction. The genes were analyzed separately to test the existence of conflicting signals, and they were also concatenated to benefit the signal from markers evolving with different mutational patterns (nuclear versus mitochondrial genes) and selective pressures (rRNA versus protein-coding genes). The nucleotide composition was also analyzed at third codon positions of the CO1 gene to detect possible reversals of mutational rates during the mitochondrial evolution of Pycnogonida. In order to better understand the evolution of nucleotide composition, we also analyzed the complete mitochondrial genome of three species: two pycnogonids, Achelia bituberculata (family Ammotheidae) and Nymphon gracile (family Nymphonidae), and Limulus polyphemus (Xiphosura, Limulidae).
2 Materials and methods
2.1 Extraction, PCR and sequencing
Total DNA was extracted from specimens preserved in 70–95% ethanol using the QIAamp DNA Micro Kit (Qiagen, Germany), following the manufacturer's protocol. Six markers were sequenced for this study, including three nuclear genes (one protein-coding gene, H3, and two rRNA genes, 18S and 28S) and three mitochondrial genes (one protein-coding gene, CO1, and two rRNA genes, 12S and 16S). Each gene was amplified using the primers listed in Table 1. PCR reactions were carried out in a 30 μl final volume using the following conditions: 10x reaction buffer with MgCl2, 3 μl; dNTP mix (6.6 mM), 3 μl; primers (10 μM), 1.5 μl; H2O, 19.3 μl; Sigma Red Taq DNA polymerase, 0.70 μl, and DNA template, 1 μl. The cycling protocol included an initial denaturation step for four minutes at 94 °C, 30 cycles of 30 s at 94 °C, 30 s at the appropriate annealing temperature and 60 s at 72 °C. Final extension followed for 10 min at 72 °C. Purification and cycle-sequencing reactions were performed at the Genoscope (Evry, France). Both DNA strands were sequenced for all PCR products. Sequences were edited and assembled using Sequencher 4.7 (Gene Codes Corporation, Ann Arbor, MI, USA).
Primer sequences.
| Gene | Name | Primer sequence 5’-3’ | Reference |
| 18S rRNA | 1F | TACCTGGTTGATCCTGCCAGTAG | [13] |
| 5R | CTTGGCAAATGCTTTCGC | [13] | |
| 3F | GTTCGATTCCGGAGAGGGA | [13] | |
| Bi | GAGTCTCGTTCGTTATCGGA | [14] | |
| A2.0 | ATGGTTGCAAAGCTGAAAC | [14] | |
| 9R | GATCCTTCCGCAGGTTCACCTAC | [13] | |
| 28S rRNA | R1S | ACCCGCTGAATTTAAGCAT | This study |
| R1AS | GCTATCCTGAGGGAAACTTC | This study | |
| R2S | CGACCCGTCTTGAAACACGGA | This study | |
| R2AS | CACCTTGGAGACCTGCTGCGGAT | This study | |
| R3S | CAGATCTTGGTGGTAGTAGCA | This study | |
| R3AS | GCCTTAGGACACCTGCGTTA | This study | |
| Histone H3 | H3F1 | ATGGCTCGTACCAAGCAGACVGC | [15] |
| H3R1 | ATATCCTTRGGCATRATRGTGAC | [15] | |
| CO1 | U1m3 | TCWACWAATCATAAAGACATTGGAAC | This study |
| L1pyc | CTATRATDGCRAATACDGCTCCTA | This study | |
| 16S rRNA | 16SS | CTGGCTYACGCCGGTYTGAACTCA | This study |
| 16Sa-mod | CGCCTGTTTAWCAAAAACAT | This study | |
| 12S rRNA | 12SS | AGRGYGACGGGCGATDTGTACA | This study |
| 12SAS-mod | AGGATTAGATACCCTRGTAT | This study |
2.2 Taxonomic sampling
Two different datasets were analyzed in this study: a dataset containing only 18S sequences and a dataset including six genes. The nine outgroup taxa used for the analyses of both datasets were chosen using the two following criteria: (1) complete sequences available for all the six selected markers; and (2) no evidence of reverse strand bias in the mitochondrial sequences. They include two Crustacea, two Euchelicerata, two Hexapoda and three Myriapoda (Table 2).
Taxa used in the multimarker analyses.
| Species | 18S rRNA | 28S rRNA | H3 | CO1 | 16S rRNA | 12S rRNA |
| PYCNOGONIDA | ||||||
| Ammotheidae | ||||||
| Achelia assimilis | DQ3899321 | DQ3901431 | DQ3901961 | DQ3900871 | DQ3900361 | DQ3899811 |
| Achelia hispida MNHN-JAC85 | FJ862857* | FJ862867* | FJ862886* | FJ862875* | FJ862845* | FJ862835* |
| Ammothea clausi | DQ3898941 | DQ3901041 | DQ3901581 | DQ3900521 | DQ3899981 | DQ3899481 |
| Ammothea hilgendorfi | DQ3899361 | DQ3901471 | DQ3902001 | DQ3900911 | DQ3900391 | DQ3899851 |
| Ammothea ovatoides | DQ3899261 | DQ3901371 | DQ3901901 | DQ3900811 | DQ3900301 | DQ3899761 |
| Ammothea sp. MNHN-JAA24 | FJ862850* | FJ862862* | FJ862881* | FJ862871* | FJ862841* | FJ862831* |
| Ammothella appendiculata | DQ3898991 | DQ3901091 | DQ3901631 | DQ3900561 | DQ3900031 | DQ3899531 |
| Ammothella tuberculata | DQ3899381 | DQ3901491 | DQ3902031 | DQ3900941 | DQ3900421 | DQ3899881 |
| Ascorhynchus castellioides | DQ3899051 | DQ3901141 | DQ3901691 | DQ3900601 | DQ3900081 | DQ3899571 |
| Ascorhynchus sp. MNHN-JAD1 | FJ862858* | FJ862868* | FJ862887* | FJ862876* | FJ862846* | FJ862836* |
| Eurycyde raphiaster | DQ3899201 | DQ3901311 | DQ3901851 | DQ3900751 | DQ3900241 | DQ3899701 |
| Nymphopsis duodorsospinosa | DQ3899151 | DQ3901251 | DQ3901791 | DQ3900691 | DQ3900181 | DQ3899651 |
| Tanystylum sp. MNHN-JAA23 | FJ862849* | FJ862861* | FJ862880* | FJ862870* | FJ862840* | FJ862830* |
| Austrodecidae | ||||||
| Austrodecus glaciale ** | DQ389890 | DQ390100 | DQ390154 | DQ390048 | DQ389994 | DQ389944 |
| Callipallenidae | ||||||
| Callipallene novaezealandiae | DQ3899271 | DQ3901381 | DQ3901911 | DQ3900821 | DQ3900311 | DQ3899771 |
| Oropallene minor | DQ3899041 | DQ3901131 | DQ3901681 | DQ3900591 | DQ3900071 | DQ3899561 |
| Propallene longiceps | DQ3898961 | DQ3901061 | DQ3901601 | DQ3900541 | DQ3900001 | DQ3899501 |
| Pseudopallene ambigua | DQ3899301 | DQ3901411 | DQ3901941 | DQ3900851 | DQ3900341 | DQ3899791 |
| Colossendeidae | ||||||
| Colossendeis macerrima MNHN-JAB47 | FJ862854* | FJ862865* | FJ862884* | FJ862873* | FJ862843* | FJ862833* |
| Colossendeis sp. MNHN-JAD2 | FJ862859* | FJ862869* | FJ862888* | FJ862877* | FJ862847* | FJ862837* |
| Decolopoda australis | DQ3899091 | DQ3901181 | DQ3901721 | DQ3900631 | DQ3900121 | DQ3899611 |
| Rhopalorhynchus filipes MNHN-JAB41 | FJ862852* | FJ862864* | FJ862883* | FJ862872* | FJ862842* | FJ862832* |
| Endeidae | ||||||
| Endeis australis | DQ3898921 | DQ3901021 | DQ3901561 | DQ3900501 | DQ3899961 | DQ3899461 |
| Endeis spinosa MNHN-JA22 | FJ862848* | FJ862860* | FJ862879* | AY7311732 | FJ862839* | FJ862829* |
| Nymphonidae | ||||||
| Nymphon brevicaudatum | DQ3898891 | DQ3900991 | DQ3901531 | DQ3900471 | DQ3899931 | DQ3899431 |
| Nymphon gracile MNHN-JA25 | FJ862851* | FJ862863* | FJ862882* | NC_0085723 | NC_0085723 | NC_0085723 |
| Nymphon uniunguiculatum | DQ3898951 | DQ3901051 | DQ3901591 | DQ3900531 | DQ3899991 | DQ3899491 |
| Pentanymphon antarcticum | DQ3898911 | DQ3901011 | DQ3901551 | DQ3900491 | DQ3899951 | DQ3899451 |
| Pallenopsidae | ||||||
| Pallenopsis macneilli | DQ3899311 | DQ3901421 | DQ3901951 | DQ3900861 | DQ3900351 | DQ3899801 |
| Pallenopsis sp. MNHN-JAC37 | FJ862856* | FJ862866* | FJ862885* | FJ862874* | FJ862844* | FJ862834* |
| Phoxichilidiidae | ||||||
| Anoplodactylus batangensis | DQ3899181 | DQ3901281 | DQ3901821 | DQ3900721 | DQ3900211 | DQ3899681 |
| Anoplodactylus erectus | DQ3899341 | DQ3901451 | DQ3901981 | DQ3900891 | DQ3900381 | DQ3899831 |
| Anoplodactylus viridintestinalis | DQ3899331 | DQ3901441 | DQ3901971 | DQ3900881 | DQ3900371 | DQ3899821 |
| Pycnogonidae | ||||||
| Pycnogonum diceros | DQ3899391 | DQ3901501 | DQ3902041 | DQ3900951 | DQ3900431 | DQ3899891 |
| Pycnogonum stearnsi | DQ3899021 | DQ3901111 | DQ3901661 | DQ3900581 | DQ3900051 | DQ3899551 |
| OUTGROUP | ||||||
| EUCHELICERATA | ||||||
| Limulus polyphemus | L81949 | AF212167 | AF370813 | NC_003057 | NC_003057 | NC_003057 |
| Mastigoproctus giganteus MNHN-JAA17 | AF005446 | AY859587 | FJ862878* | AY731174 | FJ862838* | FJ862828* |
| MYRIAPODA | ||||||
| Lithobius | AF000773a | AY210824-25b | AF110853c | NC_002629d | NC_002629d | NC_002629d |
| Scutigera coleoptrata | AF173238 | AY859601 | AY744902 | NC_005870 | NC_005870 | NC_005870 |
| Diplopoda | AY210829e | AY210828e | AF110859f | NC_003344g | NC_003344g | NC_003344g |
| PANCRUSTACEA | ||||||
| Squillidae | L81946h | AY210842h | AF110873i | NC_007444h | NC_007444h | NC_007444h |
| Triops | AF144219j | AY210844k | AF110870l | NC_006079j | NC_006079j | NC_006079j |
| Acrididae | AF370793m | AY859546n | AF370817m | NC_001712m | NC_001712m | NC_001712m |
| Tenebrionidae | X07801o | AY210843p | EU048316o | NC_003081q | NC_003081q | NC_003081q |
The first dataset was constructed by using all nearly complete 18S sequences available for Pycnogonida in the GenBank/EMBL/DDBJ nucleotide databases. Several sequences were characterized by high levels of missing data or degenerate nucleotides, suggesting problems during PCR amplification or chromatograms of bad quality (double peaks, weak signal, etc.). The more the amount of missing data is important in a sequence, the more the quality of the rest of the sequence is doubtful and can have an impact on phylogenetic reconstruction. We used therefore two successive criteria for selecting high-quality 18S sequences: a sequence length superior to 1200 nucleotides and less than 10% of missing data and/or gaps in the final alignment. Our alignment includes 115 sequences and represents all the 10 families of pycnogonids currently recognized.
The second dataset was constructed to compare the phylogenetic signals between six markers (12S, 16S, 18S, 28S, CO1 and H3). To limit the impact of missing data, we used only taxa for which all the six genes were sequenced for more than 90% of the total length. Our final alignment includes 43 sequences, and represents eight pycnogonid families (Table 2).
2.3 Alignments and phylogenetic analyses
Alignments were performed manually with Se-Al v2.0a11 [18]. All regions in the alignments involving ambiguity for the position of the gaps were excluded from the analyses to avoid erroneous hypotheses of primary homology. The alignments of rRNA genes were found to be problematic for the most divergent outgroup taxa. Therefore, non-ambiguous regions were first determined by aligning ingroup species, and this framework was then used to align outgroup taxa. The alignments are available upon request from the authors.
Separate and combined analyses were carried out using Bayesian inference (BI) and maximum likelihood (ML). The model of molecular evolution was selected under jModelTest 0.1.1 [19] using Akaike and Bayesian Information Criteria (AIC and BIC). The best-fit model was GTR+I+G for all markers. Bayesian posterior probabilities (PP) were calculated with MrBayes 3.1.2 [20] using four independent Markov chains run for 10,000,000 Metropolis-coupled MCMC generations, with tree sampling every 100 generations and a burn-in of 50,000 trees. The node robustness was also estimated after 1000 replicates by ML bootstrap analyses under RAxML v7.0.4 (BP) [21]. The parameters of the GTR+I+G model were estimated using different partitions under MrBayes and RAxML, corresponding to each of the markers used and each of the three positions for protein-coding genes (CO1 and H3).
2.4 Analyses of nucleotide composition
The strand bias in nucleotide composition was analyzed at third codon positions of CO1 sequences using the approach detailed in Hassanin et al. [16]. As similar trends were found for two- and four-fold degenerate sites, we used a simplified method where all third positions were analyzed together. The frequencies of complementary nucleotides were compared and tested by skewness: AT skew = [A − T]/[A + T] and CG skew = [C − G]/[C + G]; AT and CG skews were statistically significant if the null hypothesis of symmetry was rejected at a confidence level of 0.05.
The analyses were also carried out for each of the 13 protein-coding genes of three complete mitochondrial genomes: two species of Pycnogonida, A. bituberculata (NC_009724; [22]) and N. gracile (NC_008572; [17]), and the horseshoe crab L. polyphemus (NC_003057; [23]).
3 Results
3.1 Analyses of 18S rRNA sequences
3.1.1 Dataset construction
Two successive criteria were applied to select the 18S sequences used for phylogenetic analyses: sequence length and percentage of missing data or gaps. In a first approach, all 18S sequences of pycnogonids longer than 1200 nt were extracted from the NCBI database. The sequences were then aligned with our own sequences. After exclusion of sites ambiguous for primary homology, we obtained a data matrix of 1615 characters for 115 taxa (including 106 pycnogonid species).
Within sea spiders, the mean percentage of missing data and/or gaps is 5.89%. However, several published sequences are characterized by higher percentages. In order to improve the quality of our dataset, we therefore decided to exclude all sequences showing more than 10% of missing data and/or gaps, i.e., those of Anoplodactylus evansi (DQ389906); Anoplodactylus sp. (DQ389917); Ascorhynchus castelli (DQ389913); Austrodecus glaciale (DQ389890); Nymphon hamatum (DQ389921); Pallenopsis macronyx (DQ389908) and Phoxichilidium femoratum (DQ389901).
The reduced dataset was realigned and ambiguous sites were removed. Pairwise distances were estimated with PAUP* [24]. The mean percentage difference between pycnogonids is 1.6%. The sequences of Pantopipetta sp. (DQ389903) and Pentapycnon charcoti (DQ389924) are found to be highly divergent from other pycnogonids: 8.9 and 5.4%, respectively. Surprisingly, these values are higher than the mean pairwise distance calculated between pycnogonids and the Euchelicerata outgroup (5.2%). Furthermore, they are highly divergent from the Euchelicerata outgroup, with a mean percentage difference of 8.1 and 10.4%, respectively. These results suggest that either the data of Arango and Wheeler [1] suffer from many sequencing errors, or that the 18S sequences of Pantopipetta and Pentapycnon have diverged rapidly due to a strong and uncommon relaxation of selection pressure. Consequently, these two taxa were excluded from the analyses. The 18S matrix yielded a final alignment of 1551 unambiguous characters for 97 pycnogonids and nine outgroup taxa.
3.1.2 Phylogenetic results
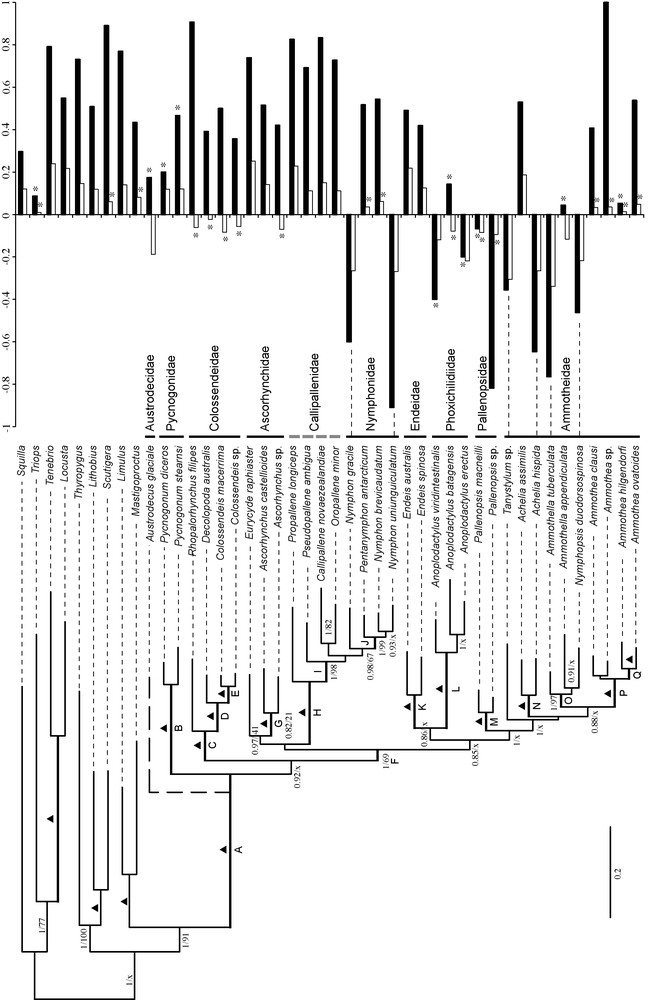
In the Bayesian tree (Fig. 2), the class Pycnogonida constitutes a well-supported monophyletic group (PP = 1, BP = 100). Three published sequences present a discordant phylogenetic position, as they result in the apparent polyphyly of three distinct genera and families: Anoplodactylus (DQ389912; [1]), Callipallene (AY210808; [25]) and, Colossendeis (AF005440; [26]). For instance, the sequence of Colossendeis AF005440 is found within a clade including Ascorhynchidae, Callipallenidae and Nymphonidae families. Three hypotheses can be advanced to explain this result: real polyphyly, taxa misidentification or carryover contamination. All the nine other sequences of Colossendeis are robustly enclosed in the family Colossendeidae with the sequences of three other genera (Decolopoda, Hedgepia and Rhopalorhynchus). The fact that these sequences were produced by three independent teams [1,12, and this study] supports their authenticity, and strongly questions that of AF005440 sequence, which may be therefore interpreted as taxa misidentification or carryover contamination. The same argumentation can be made for the sequences of Anoplodactylus DQ389912 and Callipallene AY210808.

Bayesian tree reconstructed using 18S rRNA sequences. The values indicated on the branches are posterior probabilities (superior to 0.75), above, and bootstrap proportions under RAxML, below. A star indicates taxa showing an anomalous phylogenetic position that were excluded from the final analyses; “x” shows the nodes that conflict with ML analysis. Branches cut in length by a factor of two are indicated with the symbol //. Families are indicated in the margin, and a dotted line is used for non-monophyletic families.
The phylogenetic position of Anoplodactylus lentus (DQ389912) depends on the method used for tree reconstruction: it is placed within Ascorhynchus in the BI tree, and with other Anoplodactylus in the ML tree. As pointed out by Hassanin [27], such a topological instability may be encountered in cases of chimeric sequences. According to Arango and Wheeler [1], the sequence of A. lentus was generated using three different PCR products. Our Neighbor-joining analyses reveal that the first fragment clusters with Ascorhynchus, while the two other fragments cluster with Anoplodactylus (data not shown). We therefore conclude that the sequence of Arango and Wheeler [1] is a chimera of Ascorhynchus and Anoplodactylus. The positions of Callipallene (AY210808) and Colossendeis (AF005440) are stable whatever the phylogenetic method employed. Taking into account that both taxa are not identified at species level and that they question the monophyly of two distinct and well-represented families in our dataset, we strongly suggest that these unlikely results are the consequences of taxonomic misidentification.
When these three doubtful sequences are excluded from the dataset, we recover the monophyly of Anoplodactylus (PP = 1, BP = 100), Callipallene (PP = 1, BP = 100) and Colossendeis (PP = 1, BP = 95). The analyses also support the monophyly of three pycnogonid families: Endeidae (PP = 0.98, BP = 86), Pallenopsidae (PP = 1, BP = 62) and Pycnogonidae (PP = 1, BP = 98). The monophyly of Colossendeidae is weakly supported (PP < 0.75, BP = 50). Our results also indicate a robust sister-group relationship between Rhynchothorax mediterraneus and Pycnogonidae (PP = 1, BP = 89), their early divergence within Pycnogonida (PP < 0.75, BP = 39), and a large clade including members of all other families except Colossendeidae (PP = 0.75, BP = 48).
The family Ammotheidae is not recovered as a monophyletic group, because Ascorhynchus and Eurycyde are found to be distant from a clade including all other ammotheids (PP = 0.93, BP = 73). Within the latter, the genera Ammothella and Cilunculus are polyphyletic (PP = 1, BP = 94), whereas the genus Tanystylum is paraphyletic due to the inclusion of Achelia sawayai (PP = 1, BP = 99).
The branch leading to Pantopipetta lonbituberculata is extremely long, suggesting higher rates of substitution in this taxon. The comparison with a partial 18S sequence of A. glaciale (DQ389890), another species of the family Austrodecidae, shows only 1.6% of divergence. These results suggest uncommon selective pressure in the 18S gene of Austrodecidae. The phylogenetic position of Austrodecus is found to be unstable: it occupies a position similar to that of Pantopipetta after Bootstrap analyses (BP = 51), whereas it is the sister-group of all other pycnogonids in the ML tree (data not shown).
3.2 Analyses of the multigene dataset
3.2.1 Phylogenetic information of markers
In Table 3 the following characteristics of DNA alignments are indicated: total number of characters, unambiguous positions, and parsimony-informative characters. Three markers involve considerable loss of characters because many regions in multiple sequence alignments are ambiguous for primary homology assignment: 12S (63.4%), 28S (51%), and 16S (48.4%).
Characteristics of the DNA alignments used in this study.
| Nuclear DNA | Mitochondrial DNA | |||||
| 18S | 28S | H3 | CO1 | 16S | 12S | |
| A1: Alignment length | 1924 | 3849 | 317 | 714 | 558 | 391 |
| A2: Unambiguous positions | 1609 | 1885 | 309 | 714 | 288 | 143 |
| Percentage | 83.6 | 49 | 97.5 | 100 | 51.6 | 36.6 |
| Parsimony-informative sites in A2 | 202 | 413 | 125 | 390 | 134 | 92 |
| Percentage | 12.6 | 21.9 | 40.5 | 54.6 | 46.5 | 64.3 |
| Ingroup parsimony-informative sites in A2 | 71 | 107 | 117 | 364 | 113 | 79 |
| Percentage | 4.4 | 5.7 | 37.9 | 51 | 39.2 | 55.2 |
The lowest numbers of parsimony-informative sites concerned the 18S and 28S, with 12.6 and 21.9%, respectively. When the ingroup alone is considered, number of parsimony-informative characters falls drastically to 4.4 and 5.7%, respectively, for 18S and 28S genes. The high degree of conservation of nuclear rRNA genes suggests that they will be insufficient for resolving relationships within sea spiders. Thus, most of the potential phylogenetic information for relationships within Pycnogonida is contained in H3 (37.9% of informative sites) and the mitochondrial datasets (16S: 39.2%; CO1: 51%; 12S: 55.2%).
3.2.2 Separate analyses
The six datasets were analyzed separately to evaluate their own signal, and to detect potential cases of serious incongruence by comparing the topologies and nodal support under BI and ML methods. The results are given in Table 4 and Appendix A.
Node robustness.
| Total | mtDNA | Mitochondrial markers | nuDNA | Nuclear markers | ||||||||||||||
| CO1 | 16S | 12S | 18S | 28S | H3 | |||||||||||||
| Reliable nodes | PP | BP | PP | BP | PP | BP | PP | BP | PP | BP | PP | BP | PP | BP | PP | BP | PP | BP |
| A | 1 | 100 | 1 | 100 | 1 | 96 | 0.78 | – | – | 12 | 1 | 100 | 1 | 100 | 1 | 100 | X | – |
| B | 1 | 100 | 1 | 100 | 1 | 100 | 1 | 100 | 1 | 100 | 1 | 100 | 1 | 100 | 1 | 100 | 0.98 | 77 |
| C | 1 | 100 | 1 | 100 | 1 | 81 | 1 | 79 | X | X | 1 | 94 | 0.58 | – | 1 | 92 | 1 | 96 |
| D | 1 | 100 | 1 | 99 | 1 | 97 | 0.92 | 92 | 0.97 | 95 | 1 | 99 | 1 | 86 | 1 | 100 | X | X |
| E | 1 | 100 | 1 | 100 | 0.99 | 97 | 1 | 100 | 0.96 | 95 | 0.95 | 96 | 0.99 | 97 | 0.34 | X | X | X |
| F | 1 | 69 | 0.52 | 47 | – | – | X | – | – | – | 0.96 | 45 | 0.97 | 56 | X | X | X | – |
| G | 1 | 100 | 1 | 98 | 0.99 | – | 0.8 | 46 | 0.38 | 45 | 1 | 87 | 1 | 91 | 0.39 | – | X | – |
| H | 1 | 100 | 1 | 100 | 1 | 100 | 0.98 | 73 | 1 | 100 | 1 | 98 | 0.87 | 31 | 1 | 99 | X | X |
| I | 1 | 98 | 1 | 96 | – | – | 0.51 | 63 | 0.92 | 90 | 0.93 | 70 | – | – | 0.99 | 72 | X | X |
| J | 1 | 99 | 1 | 97 | – | – | X | 91 | – | X | 1 | 69 | – | – | 0.99 | 63 | X | X |
| K | 1 | 100 | 1 | 100 | 0.96 | 80 | 1 | 98 | 1 | 90 | 1 | 99 | 0.95 | 94 | 0.48 | – | – | – |
| L | 1 | 100 | 1 | 100 | 1 | 100 | 1 | 96 | 1 | 89 | 1 | 100 | 1 | 99 | 1 | 100 | X | X |
| M | 1 | 100 | 1 | 100 | 0.52 | – | 1 | 95 | 1 | 80 | 1 | 89 | 0.86 | 58 | 1 | 96 | X | – |
| N | 1 | 100 | 1 | 85 | – | – | 1 | 83 | 0.69 | 25 | 1 | 99 | 0.54 | 85 | 1 | 99 | 1 | 100 |
| O | 1 | 97 | 0.65 | 67 | 0.99 | 71 | – | – | – | – | 1 | 93 | 1 | 97 | X | – | X | X |
| P | 1 | 100 | 1 | 100 | 1 | 95 | 1 | 90 | 1 | 72 | 1 | 98 | 0.97 | 66 | 1 | 97 | 0.97 | 68 |
| Q | 1 | 100 | 1 | 87 | – | X | 0.96 | 74 | 0.96 | 62 | 1 | 98 | 1 | 96 | 0.81 | 67 | – | – |
| Reliable nodes (A–Q) % | 100 | 100 | 100 | 100 | 71 | 59 | 82 | 82 | 65 | 76 | 100 | 100 | 88 | 82 | 88 | 71 | 24 | 24 |
| Conflicting hypotheses % | 0 | 0 | 0 | 0 | 0 | 6 | 12 | 0 | 6 | 12 | 0 | 0 | 0 | 0 | 12 | 12 | 65 | 41 |
Two taxa are found to be monophyletic with all markers: Ammothea and Pycnogonidae. All markers except H3 support the monophyly of five taxa: Anoplodactylus, Ascorhynchus, Callipallenidae + Nymphonidae, Pallenopsidae, and Pycnogonida. Three taxa are never supported: Ammotheidae, Callipallenidae and Nymphon. Finally, four taxa are found to be monophyletic with at least one mitochondrial and one nuclear marker: Achelia, Colossendeidae, Colossendeis, and Endeidae.
Surprisingly, the analyses of H3 sequences show a high level of topological incongruence with other markers. When the comparisons are made for the 17 most reliable nodes of our analyses (i.e., found with both mtDNA and nuDNA datasets; Table 4), we find between 41 and 65% of robust conflicts with H3 (versus 0–12% for other markers). A close scrutiny of the H3 sequences published by Arango and Wheeler [1] reveals that two sequences have a reading-frame shift due to the insertion of one nucleotide (DQ390185, G at position 13; DQ390194, C at position 51), two sequences necessitate compensating indels (DQ390155, deletion of G at position 185 and gap insertion at position 192; DQ390198, deletion of C at position 153 and G at position 155, and gap insertion at positions 140 and 158), and several sequences present amino acid changes at highly conserved positions within Eumetazoa: DQ390155, S → F at position 80; DQ390163, R → G at position 76; DQ390166, K → N at position 57; DQ390194, E → K at position 90 and H → Q at position 106; DQ390195, K → N at position 7 (positions are indicated in reference to the sequence of Achelia assimilis DQ390196).
It is worth noting that we encountered difficulties when amplifying H3 in the laboratory. Several phases of optimization were often necessary to increase both specificity and intensity of PCR products. These technical problems can be explained by the small size of H3 and by the use of degenerate primers that amplified across arthropods. The low quality of H3 sequences of pycnogonids available in GenBank suggests that other teams encountered similar problems. On the basis of all these observations, we performed combined analyses with and without H3.
3.2.3 Combined analyses
Phylogenetic analyses were also conducted on three combined datasets: the first, here referred to as ‘nuDNA’, combined 18S and 28S genes (3494 characters); the second, termed ‘mtDNA’, included the three mitochondrial genes (1145 characters); and the third, named ‘total’, was composed of the six genes (4948 characters) or all genes except H3 (4639 characters).
Taking into account sequencing errors detected in published H3 sequences, and the difficulties encountered during PCR amplification of H3 in our laboratory, we choose to present only the results of combined analyses without H3. However, Bayesian and ML analyses including H3 produced similar results, but the family Ascorhynchidae was not found monophyletic (data not shown). The Bayesian and ML analyses of the total data matrix produce similar topologies. Comparisons with the analyses of mitochondrial and nuclear datasets allow us to identify the most reliable nodes (Table 4 and Fig. 3). All three analyses (total, mtDNA, and nuDNA) strongly support the monophyly of Chelicerata and that of several other higher taxa, such as Colossendeidae, Endeidae, Pallenopsidae, Phoxichilidiidae, Pycnogonida and Pycnogonidae (PP = 1, BP = 91–100).
Bayesian tree reconstructed combining the five markers (CO1, 12S, 16S, 18S and 28S). The values indicated on the branches are: Bayesian posterior probabilities (PP), and bootstrap percentages (BP) obtained with RAxML. Triangles indicate nodes with maximum PP and BP values; “x” indicates nodes that conflict with ML analysis. Thick branches are those recovered independently with nuclear and mitochondrial analyses; within Pycnogonida, they are labeled with letters (A–Q). The dotted branch indicates the phylogenetic position of Austrodecus glaciale – because of its partial 18S sequence, this taxa was not included in the first combined analyses. The nucleotide composition of CO1 at third codon positions is shown above the tree: CG skews are in black and AT skews in white. An asterisk (*) indicates that the null hypothesis of strand symmetry in base composition was not rejected at a confidence level of 0.05.
The clade (Callipallenidae–Nymphonidae) is found in all combined analyses (PP = 1, BP = 93–100). The monophyly of Nymphonidae is supported by all combined analyses, except the ML analysis of the nuDNA dataset (Total: PP = 0.98, BP = –67; mtDNA: PP = 0.8; BP = 58; nuDNA: PP = 0.8). The genus Nymphon is paraphyletic through inclusion of Pentanymphon antarcticum (PP = 1, BP = 69–99). Callipallenidae are found to be paraphyletic in all combined analyses (PP = 1, BP = 70–98).
The total analysis suggests that Pycnogonidae and Colossendeidae arose first with respect to all other pycnogonid families (PP = 1, BP = 69). Whereas the family Pycnogonidae is found to be the earliest offshoot of sea spiders in BI analysis (PP = 0.92), it appears as the sister group of Colossendeidae in the ML analysis (BP = 81). This sister-group relationship is based mainly on the 12S signal, whereas 16S and 18S markers instead support Pycnogonidae as the earliest branch (Appendix A). The family Ammotheidae is split into two unrelated groups: the first is composed of Ascorhynchus and Eurycyde, two genera included in their own family (Ascorhynchidae) by Nakamura et al. [12]; and the second corresponds to all other ammotheid genera, i.e. Achelia, Ammothea, Ammothella, Nymphopsis and Tanystylum (Ammotheidae sensu stricto). The total data matrix suggests the monophyly of Ascorhynchidae (PP = 0.97, BP = 41), but this result lies only on the 18S (Appendix A). The family Ammotheidae sensu stricto is found to be monophyletic with the Bayesian and ML approaches (PP = 1, BP = 36), but paraphyletic in all the separate analyses (Appendix A). The genera Achelia and Ammothea are monophyletic in all combined analyses (PP = 1, BP = 85–100), whereas Ammothella is paraphyletic in the total analyses due to the inclusion of Nymphopsis duodorsospinosa (PP = 1, BP = 97).
The relationships between Endeidae, Phoxichilidiidae and Ammotheidae sensu stricto remain uncertain because conflicting results are found with the two different methods: Phoxichilidiidae are linked to Endeidae in the Bayesian tree (PP = 0.86), whereas they are the sister group of Ammotheidae sensu stricto in the ML tree (BP = 56).
Following our sequence selection criteria, Austrodecidae and Rhynchothoracidae were not included in the combined analyses. In order to test the position of the family Austrodecidae, we performed a second combined analysis including Austrodecus glaciale (Appendix A), a species for which all markers are available but with a partial sequence of 18S (1227 nt). The results suggest a basal divergence of Austrodecidae with respect to all other pycnogonid families (PP = 0.55, BP = 61). However, the reliability of this result remains to be tested since its not robustly supported with mtDNA and nuDNA analyses (mtDNA: BP = 40; nuDNA: PP = 0.52, BP = 44).
3.3 Nucleotide composition
3.3.1 Analysis of CO1
The nucleotide composition was analyzed at third codon positions of CO1 (Fig. 3). For most taxa, CG and AT skews show similar trends, i.e., both are either positive or negative. In addition, CG skews are generally higher than AT skews, suggesting that CG skews are more reliable than AT skews for indicating reversals of strand bias [16,28].
By considering only statistically significant values of skew, it appears that most species of Pycnogonida are characterized by positive CG and AT skews, indicating an excess of C relative to G nucleotides and an excess of A relative to T nucleotides. Six unrelated species are, however, characterized by a reverse strand bias (i.e., with negative CG and AT skews): Achelia hispida, Ammothella tuberculata, Nymphopsis duodorsospinosa and Tanystylum sp. in the family Ammotheidae sensu stricto, and Nymphon gracile and Nymphon uniunguiculatum in the family Nymphonidae. Surprisingly, two genera include species with positive and negative strand biases: Achelia and Nymphon. A significant negative AT skew is associated with a negative, but statistically insignificant, CG skew in two species of Anoplodactylus: A. viridintestinalis and A. erectus. In addition, a significant negative AT skew is associated with a positive, but statistically insignificant, CG skew in Ammothella appendiculata and Austrodecus glaciale. Three unrelated species present no deviation from the equilibrium, i.e., C ≈ G and A ≈ T: Ammothea hilgendorfi, Anoplodactylus batagensis and Pallenopsis macneilli.
3.3.2 Analysis of complete mitochondrial genomes
The nucleotide composition of third codon positions was analyzed for each protein-coding gene of three mitochondrial genomes (Fig. 4): Limulus polyphemus [23], which has a gene order identical to that deduced for the common ancestor of Chelicerata [16], and two pycnogonids, i.e., Achelia bituberculata [22], belonging to the family Ammotheidae sensu stricto, and Nymphon gracile [17], belonging to the family Nymphonidae.
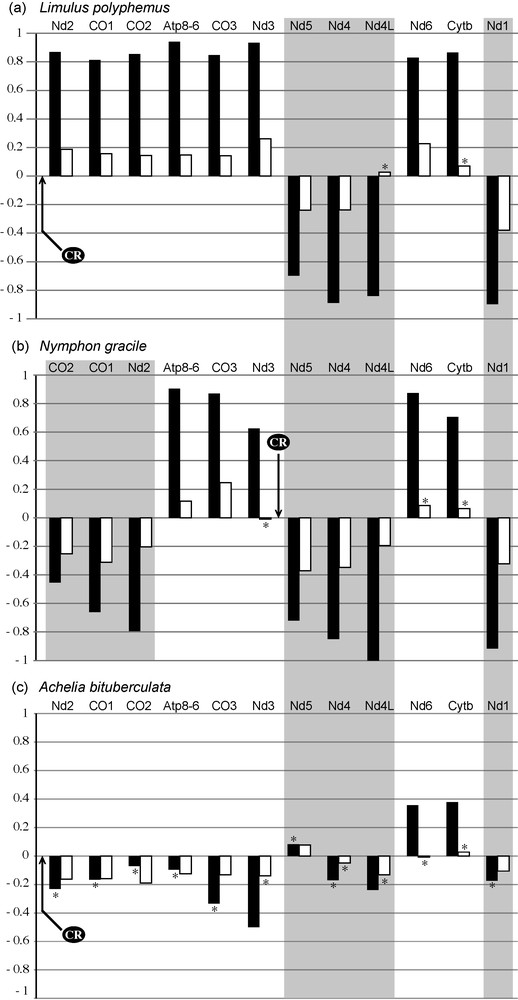
Strand bias composition of three complete mitochondrial genomes. The strand bias in nucleotide composition was analyzed at third codon positions of each protein-coding gene for Limulus polyphemus (a), Nymphon gracile (b) and Achelia bituberculata (c). The genomic order of protein-coding genes is respected for each taxon, an arrow indicates the position of the control region (CR) and gene inversions are surrounded with a grey zone; CG skews are in black and AT skews in white. An asterisk (*) indicates that the null hypothesis of strand symmetry in base composition was not rejected at a confidence level of 0.05. Abbreviations: Atp: ATP synthase F0 subunits 6 and 8; CO: cytochrome c oxidase subunits 1, 2, and 3; Cytb: cytochrome b; Nd: NADH dehydrogenase subunits 1, 2, 3, 4, 4L, 5 and 6.
In the genome of Limulus, the genes found on the “positive strand” are characterized by positive CG and AT skews. On the contrary, the genes of the other strand, i.e., “negative strand”, present a reverse strand bias (negative CG and AT skews). Similar trends were found for Nymphon gracile: all genes of the “positive strand” have positive skews and all genes of the “negative strand” have negative skews. Note however that a genomic segment, including the three protein-coding genes CO1, CO2 and Nd2, has been inverted. The situation is different in the genome of Achelia bituberculata. Although the arrangement of protein-coding genes is identical to that of Limulus, the genomic segment including Nd2, CO1, CO2, Atp8-6, CO3, Nd3, and Nd5 genes is characterized by apparent reversals of strand bias: negative CG and AT skews from Nd2 to Nd3, and positive skews for Nd5. However, the null hypothesis of strand symmetry in base composition (C = G, or A = T) is not rejected at a confidence level of 0.05 for most skew values.
4 Discussion
4.1 Choice of outgroup
Adequate taxonomic sampling is a fundamental prerequisite in phylogenetic reconstruction. Particularly important is the choice of outgroup taxa, because incorrectly rooted trees may result in erroneous interpretations of phylogenetic relationships. The inclusion of at least three outgroups, which have a paraphyletic position with respect to the ingroup, is therefore highly recommended, because it allows the monophyly of the ingroup to be tested, reduces the chances of inappropriate outgroup selection, and it may be used to break up the branch between ingroup and outgroup, thus reducing long-branch attraction problem [29,30]. In case of substantial acceleration of evolutionary rates in the sister taxon of the ingroup, more distantly related, but less divergent, outgroups may also be used to prevent spurious placement of the root [31].
On the basis of 18S sequences, Nakamura et al. [12] have concluded that Ascorhynchus and Eurycyde are early offshoots of sea spiders. However, they used only one outgroup for rooting their tree (Euchelicerata, represented by five species). We included two additional outgroups in our analyses: Myriapoda and Pancrustacea. Both 18S and multigene analyses show a different pattern for basal relationships, since the families Pycnogonidae and Colossendeidae appear as early offshoots, a topology which is in agreement with the results of Arango and Wheeler [1]. It is straightforward that the tree provided by Nakamura et al. [12] was incorrectly rooted, due to the long-branch separating pycnogonids from euchelicerates.
4.2 Taxa misidentification and carryover contamination
How reliable are the sequences available in nucleotide databases? A portion of nucleotide sequences is known to contain systematic sequencing errors [32], or to be generated from misidentified taxa [33] or due to carry-over DNA contamination [27]. The identification of arthropods may be especially problematic, particularly in the case of pycnogonids, which are poorly studied and for which morphological characters are not easily discerned.
Our analysis of all available 18S sequences of Pycnogonida indicate that two published sequences may be misidentified at the genus level: AF005440 (Colossendeis) and AY210808 (Callipallene). Despite the fact that these sequences were not included in previous pycnogonid phylogenies, their integration into further analyses would be at the origin of a misinterpretation of phylogenetic results. Unfortunately, the first sequence cannot be linked to a voucher specimen, which prevents further studies to determine its taxonomic status. If keeping voucher specimens has always been the ideal approach for systematics, it was not a standard practice in the beginnings of molecular systematics. From this point of view, the Barcode of Life Data system (BOLD) represents a real improvement for future phylogenetic studies. DNA barcoding is a DNA-based identification system, which is founded on the mitochondrial gene CO1. It focuses on the assembly of reference libraries of barcode sequences for voucher specimens with authoritative taxonomic identifications [34]. This strategy would usually make it possible to determine whether the organism from which the DNA was extracted had been correctly identified.
DNA contamination is also problematic for phylogenetic reconstruction. The use of chimeric sequences can have dramatic effects, as it can lead to robust but incorrect conclusions, or can lead to lack of resolution by increasing the levels of phylogenetic incongruence amongst sites [27,35]. For instance, we pointed out that one of the three fragments of the 18S sequence DQ389912 of A. lentus is a carry-over DNA contamination by Ascorhynchus. This kind of contaminations is very difficult to detect. It should be standard practice to analyze the segments separately where concatenated sequences are combined from multiple PCR products. The deposit of chromatograms in sequence databases would dissipate such cases of uncertainty.
4.3 Missing data
Missing data have long been considered as a source of error in phylogenetic analyses, because the inclusion of taxa with incomplete data can lead to a lack of resolution [36,37]. Simulation and empirical studies suggest, however, that missing data are not problematic for phylogenetic inferences if the number of characters is sufficient to provide a robust signal [38,39].
Two kinds of missing data have to be distinguished: partial DNA sequences and incomplete taxa sampling for one or several markers. Incorporating low quality sequences in our datasets introduces noise which may have two different consequences: the lack of signal can lead to a lower phylogenetic resolution, and the introduction of sequencing errors can lead to erroneous phylogenetic inferences. Our strategy was to minimize missing data in our analyses in order to provide equivalent phylogenetic information among taxa, a necessary condition for comparing the signals of different markers. This approach allowed us to study the contribution of each marker to the phylogenetic results, and to identify conflicting signals between genes. By contrast, Arango and Wheeler [1] included several taxa with a large proportion of missing data. For example, Rhynchothorax australis (family Rhynchothoracidae) was only sequenced for H3 (327 nt) and a small part of the 28S gene (280 nt), which represent less than 10% of the total number of characters. Although Rhynchothorax was found associated with Ammotheidae sensu stricto (Fig. 1), Arango and Wheeler [1] did not provide any support value. Our ML analyses indicate that R. australis belongs to a large clade composed of all pycnogonid families except Pycnogonidae and Colossendeidae (BP = 76), but there is no signal for supporting a relationship with Ammotheidae sensu stricto (data not shown). Using an 18S sequence of R. mediterraneus, Nakamura et al. [12] have obtained a different position for the genus Rhynchothorax: it was found to be allied with Pycnogonidae (BP = 86), hypothesis here confirmed by our ML analyses (BP = 91, data not shown).
There are reasons to think that there may be a problem with the sequences of Rhynchothorax provided by Arango and Wheeler [1]. Firstly, only two genes on six have been sequenced, which indicates a poor DNA conservation for this specimen. Secondly, absence of contamination cannot be guaranteed because the sequences are the result of short (327 nt and 280 nt) and unique amplification products. Interestingly, a sister-group relationship between Pycnogonidae and Rhynchothoracidae is corroborated by the presence of a unique pair of genital pores in females of these families [40]. Considering correct the identification of R. mediterraneus [12], we are in favor of a sister–group relationship between Pycnogonidae and Rhynchothoracidae.
4.4 Alignments
Two categories of multiple sequence alignment can be distinguished: the traditional approach, and the direct optimization approach [41]. In the traditional approach, homology is defined prior to tree reconstruction, whereas alignment and tree search are performed simultaneously in the direct optimization approach implemented in the program POY [42].
Comparisons of rRNA sequences often show important variations in the length of loop segments of secondary structure. The alignments of rRNA loops are therefore characterized by many indels and most of them have uncertain positions [43]. Indeed, all of our rRNA datasets contain high percentages of ambiguously aligned sites (63.4, 48.4, 16.4 and 51% for 12S, 16S, 18S, and 28S, respectively; Table 3). This issue is particularly problematic for the mitochondrial rRNA genes (12S and 16S), because they evolve much faster than the nuclear ones (18S and 28S). We first aligned each marker, focusing on ingroup taxa. Integrating outgroup taxa increased uncertain positions and the strict application of the primary homology criterion to all taxa would have constrained us to discard 82.9 and 66.7% of sites for 12S and 16S, respectively (data not shown). Given these difficulties, the use of mitochondrial rRNA genes for deciphering basal relationships within Pycnogonida is questionable.
Under direct optimization, ambiguous characters are not removed. According to Gatesy et al. [44], the exclusion of these ambiguously aligned sites is subjective and associated with a loss of parsimony-informative characters. As pointed by Simmons [45], positions that would be considered ambiguously aligned with the similarity criterion, and therefore excluded because of violation of primary homology, may be considered unambiguously aligned using the DO criterion.
Several studies have concluded that the dynamic approach is less accurate than the traditional approach [46,47]. Direct optimization does not offer a realistic model of indel evolution and the way in which POY handles rRNA loops remains problematic. Moreover, it has been demonstrated that the removal of ambiguous regions can lead to better trees [48]. Because we consider that character homology assessment is an essential step in phylogenetic analyses, we recommend the exclusion of ambiguous regions.
Another advantage of traditional alignment is that it can reveal sequencing errors in published data, such as a shift of the reading frame in protein coding gene sequences. This strategy has the advantage of checking each gene matrix prior to proceeding to phylogenetic inferences and allowed us to identify major sequencing errors in sequences extracted from nucleotide databases. Indeed, several H3 sequences published by Arango and Wheeler [1] are affected by a reading-frame shift. Because they are not identified when performing a direct optimization approach, such sequencing errors contradict the primary homology criterion and can lead to misleading conclusions.
4.5 Strand bias analysis
A typical metazoan mitochondrial genome is a circular and double-stranded DNA molecule. Most mitochondrial genomes present a strand asymmetry: one strand is rich in Adenine and Cytosine, whereas the other is rich in Thymine and Guanine [16,49] The strand with positive AT and CG skews can be defined as the “positive strand”, whereas the other strand can be defined as the “negative strand” [5].
Several independent reversals of asymmetric mutational constraints have been demonstrated during the evolution of Metazoa. The most spectacular cases include the echinoderm Florometra, the mollusk Katharina and several arthropods, such as the cephalocarid Hutchinsoniella, the copepod Tigriopus and the hemipterans Aleurodicus and Trialeurodes [5,16]. The study of Echinodermata has shown that asymmetric mutational constraints can be reversed through two different mechanisms: (i) inversion of the control region, which results in a global reversal, and (ii) gene inversion, which results in a local reversal [16]. Interestingly, two main groups of Chelicerata are characterized by global reversals of asymmetric mutational constraints in their mitochondrial genome, including all sequenced species of scorpions and Opisthothelae spiders [5,50]. It has been therefore suggested that two independent inversions of the control region occurred during the evolution of Chelicerata: one in the ancestor of scorpions, and another one in the ancestor of opisthothele spiders [5].
In this study, the strand bias was described by skewness (AT and CG skews) at third codon positions of CO1. The results revealed a strong heterogeneity in nucleotide composition within sea spiders (Fig. 3): six unrelated species of Ammotheidae sensu stricto and Nymphonidae present a reversed nucleotide composition, which suggests that several reversals of asymmetric mutational constraints have occurred independently within Pycnogonida. We suggest that the reversals of base composition observed in the CO1 gene of these species are the consequences of independent genomic inversions, concerning either CO1 alone, a genomic fragment including CO1 and other genes, or the control region. With time, substitutions accumulated in CO1 sequences, which has led to the establishment of several independent strand bias reversals. The analyses of the two complete mitochondrial genomes of Pycnogonida available in the databases confirm our hypothesis (Fig. 4). Both genomes differ from Limulus polyphemus, a species that presents the same organization as the ancestor of Chelicerata [16]. In Nymphon gracile, the genomic fragment including the three protein-coding genes Nd2, CO1 and CO2 is inverted [17] and, logically, the strand compositional bias of this fragment is reversed with respect to that of Limulus. The case of Achelia bituberculata is more delicate to interpret because the values of strand bias are not significant, i.e. A ≈ T and C ≈ G. These results suggest that the transposition of tRNA-Q between the 12S gene and the control region [22] was a recent event accompanied by the inversion of the control region, thus inducing a global reversal of asymmetric mutational constraints.
The analysis of base composition in the CO1 gene revealed a strong heterogeneity between species of Achelia: A. assimilis exhibits significant positive AT and CG skews, whereas A. hispida has significant negative values of strand bias (Fig. 3). These results suggest multiple changes in asymmetric mutational constraints during the recent evolution of Achelia, which may have been caused by several independent genomic rearrangements. This hypothesis needs to be confirmed by sequencing the complete mitochondrial genome of A. hispida and A. assimilis.
Several previous studies have shown that reversals of strand-specific bias can be strongly misleading for phylogenetic inference, since taxa with reverse nucleotide composition tend to group together [5,16]. To prevent the misleading impact of reversals of asymmetric mutational constraints on phylogenetic reconstruction, we did not used outgroup taxa showing negative CG and AT skews, such as Onychophora, Araneae and Scorpiones. As discussed above, several changes in asymmetric mutational constraints have been demonstrated in Pycnogonida. Despite some differences between phylogenetic analyses (total, mtDNA and nuDNA), there is no important conflict in the position of species characterized by strand bias reversals. This result therefore suggests that reversal events are too recent in the evolution of pycnogonids to erase the phylogenetic signal among closely related species. Comparison of the mitochondrial genome organization of various pycnogonid genera in a phylogenetic framework will be essential for a better understanding of the molecular evolution of the group and for a detailed analysis of mitochondrial features.
4.6 Reliability of the results
In an attempt to resolve pycnogonid relationships, we sequenced all the six markers currently used in arthropod phylogeny: CO1, 12S, 16S, H3, 18S and 28S. Estimations of parsimony-informative sites for each gene highlight the poor efficiency of 18S and 28S genes to answer this question, with respectively 4.4 and 5.7% of parsimony-informative sites for the ingroup (Table 3). Other markers show higher levels of phylogenetic information (38–55%). As revealed by separate analyses, the results of H3 are divergent from those found with other markers (Table 4). The origin of these conflicts may be linked to DNA contamination and sequencing errors, because several uncommon changes have been detected in the sequences of H3, including shifts of translation reading-frame or changes in highly conserved amino acids. Such sequencing problems are expected to be particularly frequent during PCR amplification of H3 due to its small size (less than 400 nt) and the use of degenerated primers that amplify across Arthropoda. Consequently, the H3 fragment was excluded from our combined analyses and we do not recommend this marker for future molecular studies on Pycnogonida and more generally on Arthropoda.
The analyses based on mtDNA, nuDNA, and total datasets allowed us to compare the phylogenetic signals provided by two independent evolutionary units: the mitochondrial genome, which is maternally inherited, and the nuclear genome, which has a maternal and paternal inheritance. We consider that nodes supported by both mtDNA and nuDNA are the best indicators of “true relationships” among species. Using this repeatability criterion, we identified 17 reliable nodes in the tree of Pycnogonida (Fig. 3).
4.7 Pycnogonid relationships
Previous studies have provided discordant conclusions for basal relationships within Pycnogonida (Fig. 1). On the one hand, Arango and Wheeler [1] have proposed a major dichotomy separating Austrodecidae, Colossendeidae, Pycnogonidae and Phoxichilidium from all other Pycnogonida. On the other hand, Nakamura et al. [12] have obtained a basal position for Ascorhynchus. Our analyses instead support an early divergence of the family Austrodecidae, and the existence of a large clade including all other families except Colossendeidae, Pycnogonidae and Rhynchothoracidae. Although not strongly supported, these results are probably reliable, because they are recovered by both mtDNA and nuDNA analyses (Table 4 and Appendix A). Unfortunately, the position of Rhynchothoracidae as sister-group of Pycnogonidae was only supported by 18S sequences, and that of Phoxichilidium could not be tested here due to lack of data. It is worth noting that the family Austrodecidae presents significant morphological autapomorphies: a slender and annulated proboscis; a biradiate mouth [1,51]. However, characters supporting its early divergence with respect to other pycnogonid lineages have not been demonstrated.
Nakamura et al. [12] removed Ascorhynchus and Eurycyde from the family Ammotheidae and included them into their own family, Ascorhynchidae. Surprisingly, their analyses show a paraphyletic pattern for both Ascorhynchidae and Ascorhynchus at the base of the pycnogonid tree. However, as explained above, this pattern is due to misrooting, the consequence of which is that all basal relationships within Pycnogonida were erroneously interpreted in Nakamura et al. [12]. According to Arango [52], several morphological characters support the monophyly of Ascorhynchidae: presence of terminal claws; multiple spine rows in ovigers; absence of auxiliary claws and heel spines in walking legs. Our phylogenetic inferences did not produce a strong signal for the monophyly of Ascorhynchidae. However, Ascorhynchus and Eurycyde are distantly related to Ammotheidae, suggesting that they should be excluded from this family.
The monophyly of Ammotheidae sensu stricto is retrieved in the combined analysis. Nevertheless, the matter is not completely settled, since mtDNA and nuDNA analyses instead indicate paraphyly of the group. Monophyly of Ammotheidae sensu stricto was not recovered in Arango and Wheeler [1] due to the inclusion of Rhynchothorax. In Nakamura et al. [12], Ammotheidae sensu stricto is not supported because of the sister-group relationship between Tanystylum and Anoplodactylus (Fig. 1). Ammotheidae is constituted by 395 species in 28 genera [1], so adding taxa in future analyses will be necessary to better understand relationships within this family and determine its validity. Furthermore, as suggested by Bamber [51], only the addition of distinct ammotheid genera such as Bathyzetes, Calypsopycnon or Heterofragilia can clarify the validity of both Ammotheidae and Ascorhynchidae.
Paraphyly of Callipallenidae was obtained in all separate and combined analyses, supporting the reliability of this result. Contrary to Arango and Wheeler [1], we found Nymphonidae to be monophyletic. However, the taxon involved in the polyphyly of Nymphonidae in their study, Nymphon floridanum, was not integrated in our datasets due to our sequence selection criteria. The clade uniting Callipallenidae and Nymphonidae is retrieved as monophyletic in all analyses. The long-branch leading to the clade was found in all trees (obtained from separate and combined datasets), suggesting close affinities among members of these two families and their recent diversification. This result was also obtained in Arango and Wheeler [1] and Nakamura et al. [12]. In view of this, their grouping into a single family should be considered as a better taxonomic choice.
4.8 Diversification of sea spiders
The first occurrence of Pycnogonida in the fossil record is that of Cambropycnogon klausmuelleri, a larva from the Upper Cambrian of Sweden [53]. The origin and diversification of the extant pycnogonid groups is more enigmatic, and two periods have been proposed in the literature: Paleozoic or Mesozoic.
A Paleozoic origin of extant pycnogonids is supported by the morphological analyses of Siveter et al. [54] and Arango and Wheeler [1], who concluded that there were close relationships between extant families and Paleozoic fossils, such as Haliestes from the Silurian of England (425 Mya), and Palaeothea and Palaeopantopus from the Lower Devonian of Germany (390 Mya).
More recently, Charbonnier et al. [55] discovered three fossils from the Middle Jurassic of France (160 Mya), which have been assigned to three different extant families: Palaeopycnogonides (Ammotheidae), Colossopantopodus (Colossendeidae) and Palaeoendeis (Endeidae). They suggested that the evolution of pycnogonids proceeded in two steps, with an initial Paleozoic diversification, followed by a Mesozoic radiation that gave rise to the extant families.
Our molecular analyses tend to support the hypothesis of Charbonnier et al. [55]. Indeed, all of our phylogenetic trees show a long branch between the separation of Pycnogonida from other groups of Arthropoda and the common ancestor of extant sea spiders (Figs. 2 and 3). This result suggests that a very long period of time occurred between the origin of Pycnogonida, and the subsequent diversification that led to extant families.
5 Conclusion
This study pointed out several problems in previous phylogenetic analyses of Pycnogonida, such as DNA contamination, taxonomic misidentification, sequencing errors, missing data, and misrooting, and showed that most current markers are not powerful for resolving interfamilial and intergeneric relationships. Due to its small size and functional constraints, H3 does not bring a lot of phylogenetic information at these taxonomic levels; in addition, the use of degenerate primers renders difficult its amplification. The mitochondrial fragments of 12S and 16S rRNA genes are too small to contain enough phylogenetic information, and a large part of the data is excluded from the phylogenetic analyses because of numerous ambiguous regions in the alignments, precluding the use of these markers for taxonomic levels higher than the genus. The 18S and 28S markers present a large amount of non-variable sites limiting their interest at intergeneric levels. However, their contribution is the most important to resolve interfamilial relationships. Because of its function, CO1 is a strongly constrained gene. Therefore, most of the variation is only detected in third codon positions. With time, these synonymous positions are rapidly submerged by high levels of homoplasy. As a consequence, the analyses of CO1 sequences often result in multifurcating topologies for taxonomic levels higher than the genus. Obviously, new nuclear makers should be developed to better decipher inter- and intrafamilial relationships within arthropods.
Acknowledgements
We are indebted to the following colleagues who kindly provided pycnogonid samples: Bonnie A. Bain, Lucie Bittner, Marie-Catherine Boisselier, Régis Cléva, Muriel Jager, Guillaume Lecointre, Julien Lorion, Michaël Manuel, Eric Queinnec, Sarah Samadi and Thomas Silberfeld. We are also grateful to Bertrand Richer de Forges and Philippe Bouchet for access to material from the Musorstom 5, Santo 2006 and SalomonBoa3 deep-sea cruises. We also thank Mark Judson for his helpful comments on the first draft of the manuscript, and two anonymous reviewers for their corrections and suggestions. This work was supported by the program “État et structure de la biodiversité actuelle et fossile” (MNHN), and the “Consortium national de recherche en génomique”. It forms part of agreement no. 2005/67 between the Genoscope and the MNHN on the project “Macrophylogeny of life”, directed by Guillaume Lecointre.