

1 Introduction
Rice crops suffer from a number of diseases. In Bangladesh, around 32 diseases have been identified of which ten are considered as major and blast is one of them [1]. Rice blast caused by Magnaporthe oryzae is also one of the most important widely distributed plant diseases in the world [2]. Blast resistant rice varieties are available, but this resistance is often either partial or controlled by a dominant single gene, which is therefore inherently unstable to an onslaught by a genetically variable pathogen [3]. Geographically, variability of the blast pathogen has been extensively studied in various countries [4–6].
Ufra caused by Ditylenchus angustus, is a serious nematode disease in Bangladesh [7,8]. D. angustus is mainly associated with deep-water rice. However, with the development of intensive rice cropping and irrigation, it has been reported in irrigated rice adjacent to deep-water rice field. Yield loss caused by ufra disease has been reported up to 10 to 15% in India [9], 20 to 90% in Thailand [10], 50 to 100% in Vietnam [11] and 40 to 60% or occasionally 100% yield loss in Bangladesh [12]. Hashioka [10] tested several varieties of rice against this nematode in Thailand and found only the variety, “Khao Tah Haeng 17” to be resistant with an infection rate of 42.9%. According to Miah and Bakr [13], Oryza sabulata (wild rice) and the cultivars R16-06 showed some resistance to this nematode.
Genetic variability is the mainstay for the success of any breeding program hence, assessing the level of genetic variation among the rice varieties or genotypes has been of great interest to the breeders. Rice taxonomists are interested in the rapid classification of different taxonomic groups, while breeders are concerned about the determination of usable agronomic variation in breeding programs [14].
Molecular marker technologies can assist conventional breeding efforts and are valuable tools for the analysis of genetic relatedness and the identification and selection of desirable genotypes for crosses as well as for germplasm conservation in gene banks. Microsatellites or simple sequence repeats markers (SSR) are co-dominant, hyper-variable, abundant and well distributed throughout the rice genome [15]. Abundance of microsatellite markers is now available through the published high-density linkage map [16,17] or public database. Our study is involved with the blast and ufra resistant genotypes, those were not cultivated by the farmers or poorly used as parents in rice breeding program. These germplasms can function as the source of alternative genetic pools to the improved varieties. The major aim of present study is to carry out molecular characterization of 14 blast and 12 ufra resistant genotypes and to evaluate their potential utility in the breeding program.
2 Materials and methods
2.1 Plant materials
A total of 14 blast and 12 ufra and resistant genotypes including susceptible cheeks were collected from the gene bank of Bangladesh Rice Research Institute (BRRI) and International Rice Blast Nursery (IRBN), International Network for Genetic Evaluation of Rice (INGER), International Rice Research Institute (IRRI) for this study (Table 1). Five grams of germinated seed from each genotype was sown in pots.
List of 14 Blast and 12 ufra resistant and susceptible genotypes.
| Sl. No. | Genotypes | Sources | Reaction types |
| Blast resistant genotypesa | |||
| 1. | BR6017 | IRBN, INGER | Resistant |
| 2. | IR45912 | IRBN, INGER | Resistant |
| 3. | ZhongYu7 | IRBN, INGER | Resistant |
| 4. | OM1207 | IRBN, INGER | Resistant |
| 5. | NR11 | IRBN, INGER | Resistant |
| 6. | IR60913 | IRBN, INGER | Resistant |
| 7. | S1P1692033 | IRBN, INGER | Resistant |
| 8. | QINGLIALI1 | IRBN, INGER | Resistant |
| 9. | NJ70507 | IRBN, INGER | Resistant |
| 10. | BR14 | Gene Bank, BRRI | Resistant |
| 11. | BR16 | Gene Bank, BRRI | Resistant |
| 12. | BR28 | Gene Bank, BRRI | Moderately resistant |
| 13. | BR29 | Gene Bank, BRRI | Highly susceptible |
| 14. | BR36 | Gene Bank, BRRI | Moderately susceptible |
| Ufra resistant genotypesb | |||
| 15. | Fukuhonami | Gene Bank, BRRI | Highly resistant (local type) |
| 16. | Matsuhonami | Gene Bank, BRRI | Highly resistant (local type) |
| 17. | Rayda | Gene Bank, BRRI | Resistant (local type) |
| 18. | Bajail | Gene Bank, BRRI | Resistant (local type) |
| 19. | Hunenwase | Gene Bank, BRRI | Resistant (local type) |
| 20. | Shinanokogane | Gene Bank, BRRI | Resistant (local type) |
| 21. | Kinonishiki | Gene Bank, BRRI | Resistant (local type) |
| 22. | Aokazi | Gene Bank, BRRI | Resistant (local type) |
| 23. | Koshinishini | Gene Bank, BRRI | Resistant (local type) |
| 24. | Reihou | Gene Bank, BRRI | Susceptible (local type) |
| 25. | BR3 | Gene Bank,BRRI | Highly susceptible (HYV) |
| 26. | BR11 | Gene Bank, BRRI | Highly susceptible (HYV) |
2.2 Molecular markers
A total of nine microsatellite or SSR markers and three minisatellite or variable number tandem repeats (VNTR) markers with clear amplifications were selected for the variability study of 26 blast and ufra resistant rice genotypes (Table 2).
SSR and VNTR primers used for genetic variability study of blast and ufra resistant genotypes.
| Primers | Oligonucleotide sequence |
| SSRs | |
| RM11 | ATAGCGGGCGAGGCTTAG-R |
| TCTCCTCTTCCCCCGATC-F | |
| RM531 | CACGTTTCCTTCTTCAGATCATGG -R |
| GTTCCCACTCATAGTAAACCGATACG -F | |
| RM443 | CCAGTCCCAGAATGTCGTTTCG -R |
| GCGAAGCCCAATCTGAAGAAGC-F | |
| RM17 | GGTGATCCTTTCCCATTTCA-R |
| TGCCCTGTTATTTTCTTCTCTC-F | |
| RM21 | ACAGTATTCCGTAGGCACGG-R |
| GCTCCATGAGGGTGGTAGAG-F | |
| RM222 | CTTAAATGGGCCACATGCG-R |
| CAAAGCTTCCGGCCAAAAG-F | |
| RM80 | TTGAAGGCGCTGAAGGAG-R |
| CATCAACCTCGTCTTCACCG-F | |
| RM108 | TCTCTTGCGCGCACACTGGCAC-R |
| CGTGCACCACCACCACCACCAC-F | |
| RM23 | CATTGGAGTGGAGGCTGG-R |
| GTCAGGCTTCTGCCATTCTC-F | |
| VNTRs | |
| RY | CAGCAGCAGCAGCAG |
| MR | GAGGGTGGCGGTTCT |
| GF | TCCTCCTCCTCCTCC |
2.3 Genotyping protocol
Genomic DNA was extracted from young leaves of 3-weeks-old plants following a simple and modified protocol for PCR analysis which did not require liquid nitrogen and required only a very small amount of tissue samples [18].
PCR was performed in 12.5 μl reaction containing 5 to 25 ng of DNA template, 1.25 μl of MgCl2-free 10X PCR buffer (100 mM Tris-HCl pH 9.0 at 25 °C, 500 mM KCl, 0.1% Triton® X-100 and H2O), 1.5 μl of 25 mM MgCl2, 0.25 μl of 10 mM dNTPs, 0.25 μl of 5 U/μl Taq polymerase enzyme, 0.625 μl each of 10 μM forward and reverse primers using an MJ research single 96-well thermal cycler. The mixer was overlaid with a drop of mineral oil to prevent evaporation.
After initial denaturation for 5 min at 94 °C, each cycle comprised of 1 min denaturation at 94 °C, 1 min annealing at 55 °C, and 2 min extension at 72 °C with a final extension for 7 min at 72 °C at the end of 35 cycles. The PCR products were mixed with bromophenol blue gel-loading dye and were analysed by electrophoresis on 8% polyacrylamide gel using mini vertical polyacrylamide gels for high throughput manual genotyping (CBS Scientific Co. Inc., CA, USA). PCR amplification products (2.5 μl) were resolved by running gel in 1 x TBE buffer for 2 to 2.5 hrs depending upon the allele size at around 75 V and 180 mA current. The gels were stained in 0.5 mg/mL ethidium bromide and were documented using UVPRO (Uvipro Platinum, EU) gel documentation unit. Polymorphism information content (PIC) values were calculated with the following formula [19]:
2.4 Data analysis
Molecular weight for each amplified allele was measured in base pair using Alpha-EaseFC 5.0 software. The summary statistics including the number of alleles per locus, major allele frequency, gene diversity, PIC values were determined using Power Marker version 3.25 [20]. Genetic distance was calculated using the “Nei 1983” distance. The allele frequency data from Power Marker 3.25 was used to export the data in binary format (allele presence = “1” and allele absence = “0”) for analysis with NTSYS-pc version 2.1 [21]. A similarity matrix was calculated with the “Simqual” subprogram using the Dice coefficient, followed by cluster analysis with the SAHN subprogram using the UPGMA clustering method as implemented in NTSYS-pc. The similarity matrix was also used for principal coordinate analysis (PCoA) in same program.
3 Results
3.1 Overall simple sequence repeats markers diversity for blast resistant and susceptible genotypes
A total of 33 alleles were detected at the loci of eight SSR markers across 14 blast resistant genotypes. The number of alleles per locus ranged from two (RM108) to five (RM21, RM80, RM531), with an average of 4.13 alleles across the eight loci (Table 3).
Number of alleles, size range and polymorphism information content (PIC) found among 14 rice genotypes for blast resistant genotypes.
| Marker | Chr No | Position (cM) | Motifa | Allele no. | Size range (bp) | Allele | PIC Value | |
| Size (bp) | Freq. (%) | |||||||
| RM11 | 7 | 47.0 | (GA) 11 | 5 | 141.9–185.5 | 175 | 41.67 | 0.6990 |
| RM17 | 12 | 109.1 | (GA) 21 | 4 | 208.3–278.9 | 217 | 46.15 | 0.5556 |
| RM21 | 11 | 85.7 | (GA) 18 | 5 | 151.6–229.8 | 228 | 28.57 | 0.7261 |
| RM108 | 9 | 73.3 | (GGT) 10 | 2 | 57.5–68.0 | 59 | 78.57 | 0.2800 |
| RM23 | 1 | 71.6 | (GA) 15 | 4 | 105.7–123.0 | 106 | 42.86 | 0.6549 |
| RM80 | 8 | 103.7 | (TCT) 25 | 5 | 93.6–114.9 | 105 | 42.86 | 0.6574 |
| RM531 | 8 | 90.3 | (AT) 15 | 5 | 203.1–231.1 | 228 | 28.57 | 0.6999 |
| RM443 | 1 | 122.7 | (GT) 10 | 3 | 131.6–114.6 | 116 | 60.00 | 0.4662 |
| Mean | 4.13 | 46.20 | 0.5924 |
a Motif of the SSR and number of repeats as previously published (http://www.gramene.org).
The PIC values ranged from 0.280 (RM108) to 0.726 (RM21) across the eight loci. The highest PIC value (0.726) was obtained in RM21 followed by RM531 (0.699), RM11 (0.699), RM80 (0.657) and RM23 (0.654), respectively (Table 3). The frequency of the most common allele at each locus ranged from 28.6 (RM21 and RM531) to 78.6% (RM108). On an average, 46.2% of the 14 rice genotypes shared a common major allele at any given locus. Fig. 1 shows a gel picture of the microsatellite marker, RM21 for all 14 genotypes.
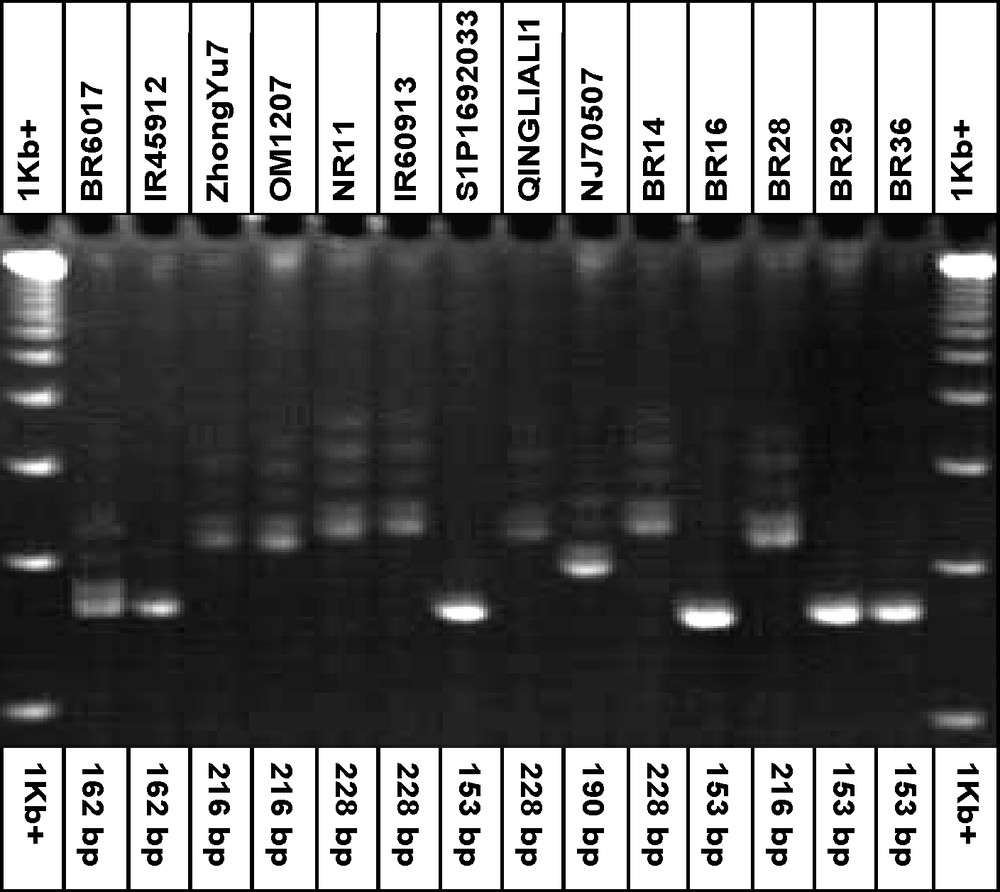
DNA profile of the 14 rice genotypes with the simple sequence repeats marker, RM21 for blast resistant genotypes.
3.2 Overall simple sequence repeats markers diversity for ufra resistant and susceptible genotypes
A total of 45 alleles were detected from seven SSR markers across 12 ufra resistant genotypes. The number of alleles per locus ranged from five (RM11) to eight (RM23), with an average of 6.43 alleles (Table 4). PIC values ranged from 0.5953 (RM17) to 0.8296 (RM23) across the seven loci. The highest PIC value was found in RM23 (0.8296) followed by RM80 (0.8119), RM222 (0.7956), RM21 (0.7193) and RM108 (0.7193), respectively. The frequency of the most common allele at each locus ranged from 25.00 (RM23, RM80 and RM222) to 43.50% (RM17). On an average, 34.58% of 12 ufra resistant genotypes shared a common major allele at any given locus. Fig. 2 showed a gel picture of the microsatellite marker, RM21 for all 12 genotypes.
Number of alleles, size range and polymorphism information content (PIC) found among 12 ufra resistant genotypes.
| Marker | Chr No | Position (cM) | Motifa | Allele no. | Size range (bp) | Allele | PIC Value | |
| Size (bp) | Freq (%) | |||||||
| RM11 | 7 | 47.0 | (GA) 11 | 6 | 141–185 | 170 | 40.20 | 0.6870 |
| RM17 | 12 | 109.1 | (GA) 21 | 5 | 208–278 | 220 | 43.50 | 0.5953 |
| RM21 | 11 | 85.7 | (GA) 21 | 6 | 70–100 | 82 | 41.67 | 0.7193 |
| RM222 | 10 | 11.3 | (CT) 18 | 7 | 127–246 | 152 | 25.00 | 0.7956 |
| RM80 | 8 | 103.7 | (TCT) 25 | 7 | 129–167 | 140 | 25.00 | 0.8119 |
| RM108 | 9 | 73.3 | (GGT) 10 | 6 | 41–54 | 46 | 41.67 | 0.7193 |
| RM23 | 1 | 71.6 | (GA) 15 | 8 | 51–105 | 56 | 25.00 | 0.8296 |
| Mean | 6.43 | 34.58 | 0.7369 |
a Motif of the SSR and number of repeats as previously published (http://www.gramene.org).
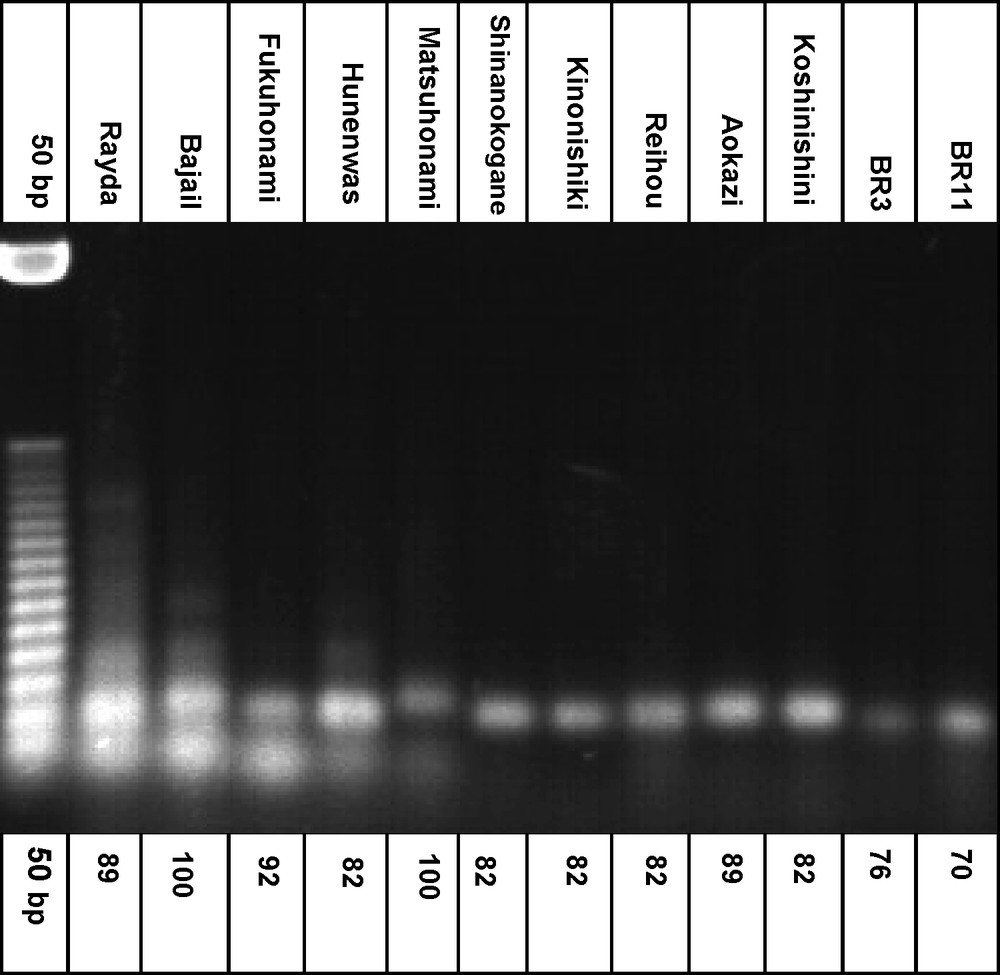
DNA profile of the 12 rice genotypes with the simple sequence repeats marker, RM21 for ufra resistant genotypes.
3.3 Genetic distance-based analysis for blast resistant genotypes
3.3.1 UPGMA cluster analysis
In addition to eight SSR markers, three VNTR markers have been added for genetic diversity analysis of 14 blast resistant and susceptible genotypes. As the VNTR primers were random so, more than one locus was present in VNTR (Appendix 1). In each amplified locus, presence or absence of allele was considered and binary outputs were used in the analysis. The genetic similarity analysis using UPGMA clustering system generated nine genetic clusters with similarity coefficient of 0.66 (Fig. 3). Six clusters consisted of six resistant genotypes, i.e. each cluster contained a single genotype. The clusters were IV, V, VI, VII, VIII and IX containing the genotypes BR6017, BR16, IR60913, Qingliali1 and NJ70507, respectively. Cluster I possessed two genotypes viz. BR14 and SIPI692033, which were resistant to blast. Again, three resistant genotypes against blast viz. IR45912, OM1207 and ZhongYu7 were grouped in cluster number, V. Only the cluster number III possessed the susceptible genotypes, BR29 and BR36.
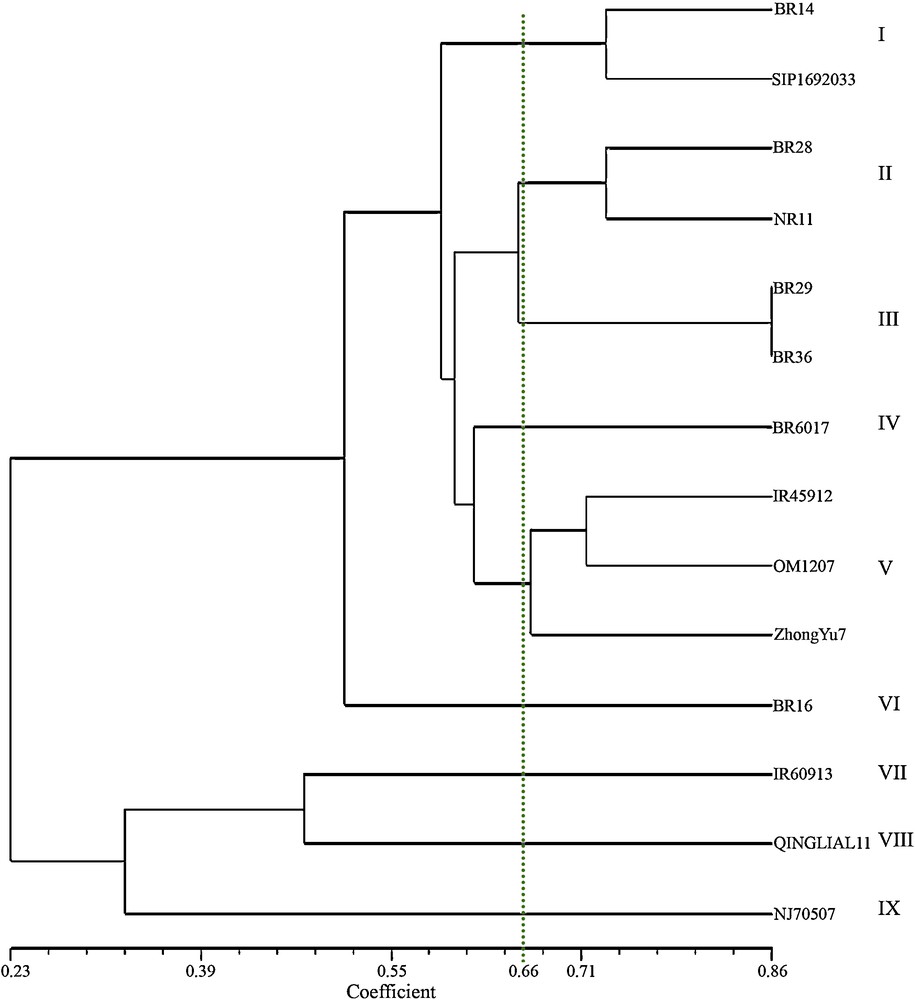
UPGMA dendrogram showing the genetic relationships among 14 blast resistant and susceptible genotypes based on eight simple sequence repeats markers and three variable number tandem repeats markers.
3.3.2 Principal coordinate analysis (PCoA)
Two-dimensional PCoA showed the spatial distribution of the genotypes along the two principal axes. The genotypes viz. ZhongYu7, BR14, OM1207, SIPI692033, BR29, BR36, QINGLIALI1, IR60913 and NJ70507 were found to be placed far away from the centroid of the cluster and rest of the genotypes were placed more or less around the centroid.
3.3.3 Genetic distance
Pair-wise quantitative genetic distance between different genotypes was calculated using “Nei 1983” coefficient. The highest genetic distance was found between NJ70507 with BR36 and BR29 as well as between QINGLIALI No.1 and BR6017 (0.8571) (Table 5) followed by IR60913 and BR6017 (0.8333), NJ70507 and BR14 and IR60913 and BR16 (0.7778), IR60913 and BR36 and ZhongYu 7 and QINGLIALI No. 1 (0.7500). BR36 and BR29 were the most similar genotypes (0.0588) followed by BR28 and BR29 (0.1176) and BR36 and BR28 (0.1250).
Genetic distances among 14 blast resistant and susceptible rice genotypes using eight SSR and three VNTR markers.
| Genotypes | BR14 | BR16 | BR28 | BR29 | BR36 | BR6017 | IR45912 | IR60913 | NJ70507 | NR11 | OM1207 | QINGLIALI1 | S1P1692033 | ZhongYu7 |
| BR14 | 0.0000 | |||||||||||||
| BR16 | 0.2667 | 0.0000 | ||||||||||||
| BR28 | 0.3333 | 0.4375 | 0.0000 | |||||||||||
| BR29 | 0.2857 | 0.2667 | 0.1176 | 0.0000 | ||||||||||
| BR36 | 0.3846 | 0.3333 | 0.1250 | 0.0588 | 0.0000 | |||||||||
| BR6017 | 0.3846 | 0.3846 | 0.3333 | 0.2667 | 0.3333 | 0.0000 | ||||||||
| IR45912 | 0.3750 | 0.4286 | 0.2941 | 0.2941 | 0.3125 | 0.2500 | 0.0000 | |||||||
| IR60913 | 0.4000 | 0.7778 | 0.4545 | 0.6250 | 0.7500 | 0.8333 | 0.5000 | 0.0000 | ||||||
| NJ70507 | 0.7778 | 0.7500 | 0.6000 | 0.8571 | 0.8571 | 0.5714 | 0.5556 | 0.6667 | 0.0000 | |||||
| NR11 | 0.2778 | 0.4667 | 0.2000 | 0.2353 | 0.3125 | 0.2000 | 0.2222 | 0.1818 | 0.5000 | 0.0000 | ||||
| OM1207 | 0.2500 | 0.2941 | 0.2727 | 0.2632 | 0.3333 | 0.3125 | 0.2000 | 0.4545 | 0.6000 | 0.2273 | 0.0000 | |||
| QINGLIALI1 | 0.7143 | 0.6667 | 0.4444 | 0.5556 | 0.5556 | 0.8571 | 0.4444 | 0.3750 | 0.5000 | 0.3333 | 0.5000 | 0.0000 | ||
| S1P1692033 | 0.2000 | 0.3529 | 0.2727 | 0.2778 | 0.2353 | 0.1875 | 0.3684 | 0.6364 | 0.6000 | 0.2727 | 0.2917 | 0.6667 | 0.0000 | |
| ZhongYu7 | 0.2941 | 0.4286 | 0.3333 | 0.3750 | 0.4000 | 0.2000 | 0.2778 | 0.5556 | 0.5556 | 0.2105 | 0.2000 | 0.7500 | 0.3000 | 0.0000 |
3.4 Genetic distance-based analysis for ufra resistant genotypes
3.4.1 UPGMA cluster analysis
Alleles and loci of SSR and VNTR markers of ufra resistant genotypes are presented in Appendix 2. The UPGMA clustering system generated five genetic clusters with similarity coefficient of 0.42. Here resistant genotype, Rayda was grouped in single cluster, II (Fig. 4). Resistant genotypes, Koshinishini and Aokazi formed another cluster, I. Two highly resistant (Fukuhonami and Mutsuhonami) and two resistant (Bajail and Hunenwase) genotypes respectively grouped in cluster, III while two resistant (Kinonishiki and Shinanokogane) and a susceptible genotype (Reihou) formed another cluster, V. Actually, there were two sub-clusters under cluster V, the susceptible genotype, Reihou was grouped in the different sub-cluster. The susceptible genotypes, BR11and BR3 formed a single cluster, IV.
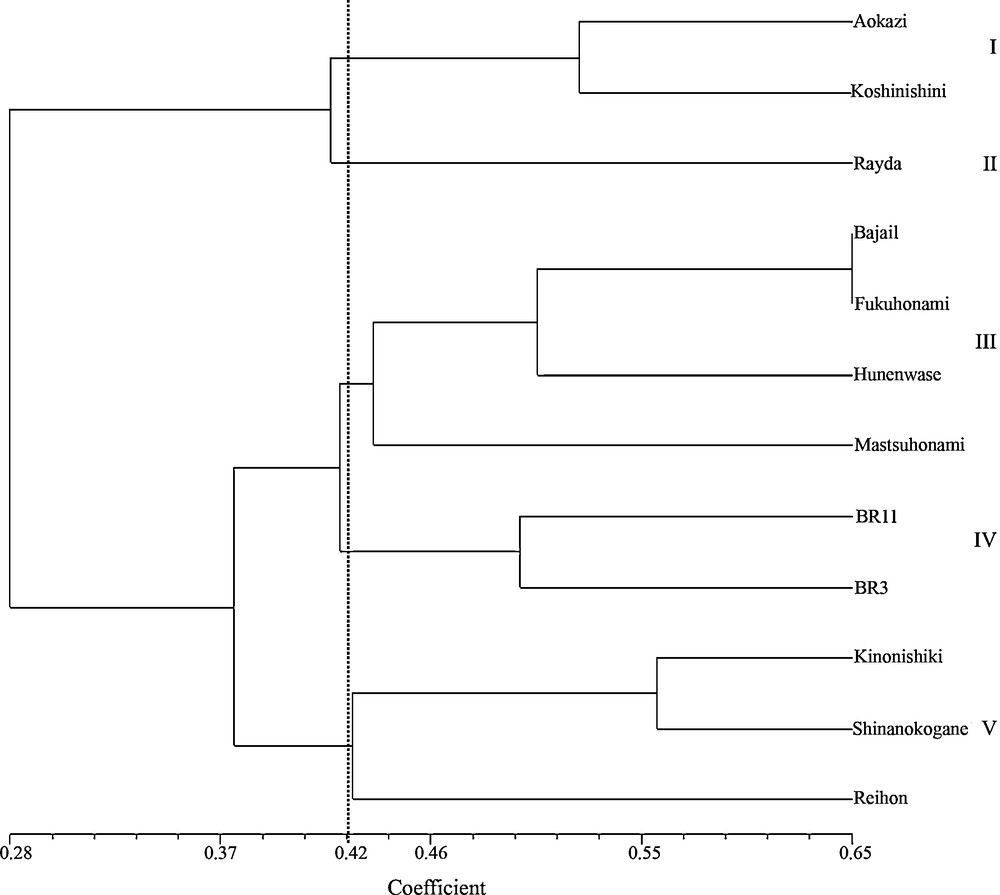
UPGMA dendrogram showing the genetic relationships among 12 ufra resistant and susceptible genotypes based on seven simple sequence repeats and three variable number tandem repeats markers.
3.4.2 Principal coordinate analysis
PCoA showed the spatial distribution of the genotypes along the two principal axes. The genotypes viz. Rayda, Reihou, BR11, Shinanokogane, Bajail and Fukuhonami were found to be placed far away from the centroid of the cluster and rest of the genotypes were placed more or less around the centroid.
3.4.3 Genetic distances
Pair-wise genetic distances were computed among 12 ufra resistant genotypes. Genetic distance was the smallest between genotypes, Hunenwase and Shinanokogane (0.2500) followed by Fukuhonami and Bajail (0.2857) and Aokazi and Koshinishini (0.2857), Shinanokogane and Kinonishiki (0.3000), Hunenwase and Matsuhonami (0.3333) and Kinonishiki and Bajail (0.3333) and Koshinishini and Hunenwase (0.3333), Rayda and Bajail (0.3636), Hunenwase and Aokazi (0.3750) and Kinonishiki and Koshinishini (0.3750) (Table 6). On the other hand, genetic distance was the highest between genotypes, Aokazi and Reihou (0.8333), Aokazi and BR11 (0.8333) and Shinanokogane and Matsuhonami (0.8333) followed by Shinanokogane and Aokazi (0.8000) and Aokazi and BR3 (0.8000), Matsuhonami and Rayda (0.7143), Aokazi and Bajail (0.7143), Reihou and Rayda (0.7143), BR3 and Rayda (0.7143), Aokazi and Matsuhonami (0.6667), Reihou and Koshinishini (0.6667), Kinonishiki and Aokazi (0.6667), Shinanokogane and Rayda (0.6250), BR11 and Rayda (0.6250), Shinanokogane and BR3 (0.6250) and Reihou and BR3 (0.6250).
Genetic distances among 12 ufra resistant and susceptible rice genotypes using seven SSR and three VNTR markers.
| Genotypes | Aokazi | Bajail | BR11 | BR3 | Fukuhonami | Hunenwase | Kinonishiki | Koshinishini | Matsuhonami | Rayda | Reihou | Shinanokogane |
| Aokazi | 0.0000 | |||||||||||
| Bajail | 0.7143 | 0.0000 | ||||||||||
| BR11 | 0.8333 | 0.4167 | 0.0000 | |||||||||
| BR3 | 0.8000 | 0.4000 | 0.4545 | 0.0000 | ||||||||
| Fukuhonami | 0.5714 | 0.2857 | 0.4167 | 0.5000 | 0.0000 | |||||||
| Hunenwase | 0.3750 | 0.3846 | 0.5000 | 0.5000 | 0.4167 | 0.0000 | ||||||
| Kinonishiki | 0.6667 | 0.3333 | 0.4545 | 0.4000 | 0.4545 | 0.4000 | 0.0000 | |||||
| Koshinishini | 0.2857 | 0.4545 | 0.5556 | 0.5000 | 0.4000 | 0.3333 | 0.3750 | 0.0000 | ||||
| Matsuhonami | 0.6667 | 0.4000 | 0.5000 | 0.4444 | 0.5000 | 0.3333 | 0.4444 | 0.5000 | 0.0000 | |||
| Rayda | 0.5000 | 0.3636 | 0.6250 | 0.7143 | 0.5000 | 0.5556 | 0.5556 | 0.5000 | 0.7143 | 0.0000 | ||
| Reihou | 0.8333 | 0.5556 | 0.4444 | 0.6250 | 0.5000 | 0.4000 | 0.4444 | 0.6667 | 0.5714 | 0.7143 | 0.0000 | |
| Shinanokogane | 0.8000 | 0.5000 | 0.5556 | 0.6250 | 0.5000 | 0.2500 | 0.3000 | 0.5714 | 0.8333 | 0.6250 | 0.4444 | 0.0000 |
4 Discussion
The average number of alleles per locus was 4.13 across the eight SSR markers in blast resistant genotypes while an average of 6.43 alleles per locus was found across seven SSR markers in ufra resistant genotypes. In a study conducted by Hossain et al. [22] with microsatellite markers, the average number of alleles obtained was 4.53 in rice. Allelic variation and genetic diversity of genotypes with abiotic and biotic stress tolerances have been studied by the several scientists in home and abroad [23–25].
For blast resistant genotypes, the highest PIC value was obtained in marker, RM21 followed by for RM11 and RM531, RM80 and RM23, respectively. PIC value revealed that RM21 was considered as the best marker for 14 blast resistant genotypes. On the other hand, the highest PIC value was found in RM23 compared to other markers for ufra resistant genotypes. Therefore, RM23 was considered as the best marker for characterizing the 12 ufra resistant genotypes and to a lesser extent RM21, RM108, RM80 and RM222 makers should be useful for molecular characterization of ufra resistant and susceptible genotypes. These reports are in agreements with the results of several authors [26–28].
Genetic divergence is one of the criteria of parent selection. Knowledge of genetic diversity among plant populations and its quantitative assessment usually helps a breeder in choosing desirable parents for breeding program as selection of parents on the basis of divergence analysis would be more effective. So, genetic diversity of blast and ufra resistant genotypes found in this study is essential to meet the diverse goals of plant breeding such as producing cultivars with increased yield [29], desirable quality and disease resistant [30].
For blast, UPGMA dendrogram generated nine genetic clusters. To improve the blast tolerance along with other genetic variability of the two important irrigated rice varieties (BR29 and BR36), they required to be crossed with genetically distant cluster of blast resistant genotypes. Particularly, blast susceptible genotypes, BR29 and BR36 could be crossed with NJ70507 to enhance blast tolerance and to create genetic variability among these genotypes. Considering the pair-wise genetic distance, BR36 and BR29 were the most similar genotypes (0.0588) followed by BR28 and BR29 (0.1176) and BR36 and BR28 (0.1250). The highest genetic similarities among three genotypes, BR36, BR28 and BR29 might be because all these are grown in irrigated rice ecosystem with similar grain type. The UPGMA clustering system generated five genetic clusters with similarity coefficient of 0.42 in ufra resistant genotypes. In order to develop ufra resistant varieties and broaden the genetic base of rice varieties, new breeding program should be initiated preferably using the parents, BR11 and Aokazi, BR3 and Aokazi, Rayda and BR3 and Rayda and BR11. To obtain greater hererosis, the most diverged and desired genotypes should be crossed as reported by Bansal et al. [31], Mokate et al. [32], Kumari and Rangasamy [33], Nevo et al. [30], Ali et al. [34], Suh-Jung et al. [35] and Chakravarthi and Naravaneni [36]. Our findings based on genetic distances also corroborated the results of principal coordinate analysis. Although the genetic distances between the parents Shinanokogane and Aokazi, Matsuhonami and Rayda, Aokazi and Bajail, Reihou and Rayda, Aokazi and Matsuhonami, Reihou and Koshinishini, Kinonishiki and Aokazi and Shinanokogane and Rayda were higher but these parents were low yielder and local race types. So, the hybridisation program would not be suggested among them.
5 Conclusion
To better understand the genetic diversity, a total of 26 blast and ufra disease resistant genotypes including susceptible checks were characterized using nine SSR and three VNTR markers. A total of 78 alleles and 29 loci were detected from 26 genotypes. PIC values ranged from 0.280 to 0.726 and 0.5953 to 0.8296 for blast and ufra resistant genotypes, respectively. UPGMA dendrograms showed nine genetic clusters with similarity coefficient of 0.66 for blast resistant genotypes, while five genetic clusters with similarity coefficient of 0.42 for ufra resistant genotypes. To create the variability as well as to develop disease resistant varieties against two major diseases of rice, hybridisation should be made using the parents, BR29 and NJ70507, BR36 and NJ70507 for blast while BR11 and Aokazi, BR3 and Aokazi, Rayda and BR3 and Rayda and BR11 for ufra.
Disclosure of interest
The authors declare that they have no conflicts of interest concerning this article.
Acknowledgements
The authors greatly acknowledge the authorities of Bangladesh Rice Research Institute (BRRI) and University Putra Malaysia (UPM) for providing research facilities and financial support.