

1 Introduction
The vulnerable effect of climate change has created many natural hazards, which is a great constraint in crop production worldwide. Submergence is one of the most important natural calamities in the world, causing a great crop loss every year. Flooding patterns are highly variable and difficult to quantify in terms of the extent of submergence stress. Short-term inundation is the most damaging type flooding (up to 2 weeks), also referred to as flash floods. About 20 million ha of rice growing areas in Asia (not including China) as well as significant areas of lowland rice production in Africa are affected by these flash floods [1,2]. An economic loss up to 11.5 billion US dollars has been estimated in Asia Pacific regions caused by flash floods [3]. Flash floods are highly unpredictable which may occur more than one time in a season and can affect at any growth stage of crops. Ten to 100% yield losses had been reported due to flash floods, which depend on water depth, duration of submergence, temperature, turbidity of water, soil fertility, light intensity and age of the crop [4–9]. Modern high-yielding rice varieties have lack the mechanism of submergence tolerance for which they cannot thrive or withstand the devastating effect of flash floods, as a result declining in the yield caused. Landraces like FR13A have been found submergence tolerant [10,11], but are very poor in yield performance, thus are not acceptable for commercial cultivation.
Submergence tolerance is the ability of crop plants to resist the detrimental effect of flooding or submergence. In rice plant, the survival ability of 10–14 days of complete submergence and the renewal of its growth when water is subsided can be defined as submergence tolerance [12]. The recent identification and tagging of SUB1 gene, which was mapped on rice chromosome 9 [13] is an enormous success in the development of submergence tolerance in rice. The locus SUB1 is responsible for about 70% of variation due to submergence. SUB1 was further fine mapped [14] and confirmed for major determinant of submergence tolerance [15–17]. SUB1 is also found to be an Ethylene Responsive Factor (ERF) [18] that limits the production of ethylene and induce tolerance to submergence [19,20]. Using MABC, a small genomic region containing SUB1A has been introgressed into modern high-yielding varieties like Swarna, Samba Mahsuri, IR64, Thadokkam 1 (TDK1), CR1009 BR11 and many others [21–25]. The introgression of the SUB1 gene has been found effective for improving the yield for many rice varieties in many submergence areas [26–29]. The present study was conducted to evaluate the performance of some rice genotypes in submerged conditions, including SUB1 introgression advance lines along with tolerant check and susceptible high-yielding varieties. However, SSR marker-based analysis for the identification of a specific desirable gene is very much effective in molecular breeding programs. In this study, SSR marker-based molecular characterization was done with specific markers and the result was evaluated with the morphological performance and along with the genetic variability studies of the genotypes.
2 Materials and methods
Two experiments were conducted from January to December 2015 in the experimental field and laboratory of Biotechnology Division, Bangladesh Institute of Nuclear Agriculture (BINA), Mymensingh-2202. Geographically, the experimental area is located at a latitude of 24°75’ N and a longitude of 90°5’ E at an elevation of 18 m above sea level. The air temperature varies from 23 to 30 °C, relative humidity from 80 to 87, and rainfall from 203 to 206 mm (source: Weather yard, Department of irrigation and water management, BAU, Mymensingh). The physiochemical differences of soils of different pots were in similar ranges. The soil pH ranges from 6 to 7, organic carbon is 1.52%, organic matter is 4.15%, total nitrogen is 0.1%, available potassium (K) is 0.076 me%, available phosphorus (P) 2.346 ppm, available sulphur (S) 11.433 ppm (source: Soil Science Division, Bangladesh Institute of Nuclear Agriculture, BAU campus, Mymensingh) (Table 1).
Experimental treatments and genotypes.
| Treatments | Genotypes | Types | Gene introgressed |
| T0 = Control | BRRI dhan-28 Binadhan-7 |
High yielding variety and submergence susceptible Early maturing and submergence susceptible |
|
| T1 = Submergence for 7 days at the vegetative stage | Binadhan-11 | High yielding and submergence tolerant | Sub1 |
| T2 = Submergence for 14 days in the vegetative stage | Binadhan-12 | High yielding and submergence tolerant | Sub1 |
| T3 = Submergence for 7 days in the reproductive stage | |||
| RC192 | Advanced line (partially submergence tolerant) | Saltol + Sub1 | |
| RC 193 | Advanced line (submergence tolerant) | Saltol + Sub1 | |
| RC 225 | Advanced line (partially submergence tolerant) | Sub1 | |
| RC227 | Advanced line (partially submergence tolerant) | Sub1 | |
| RC 249 | Advanced line (submergence tolerant) | Saltol + Sub1 | |
| RC 251 | Advanced line (submergence tolerant) | Saltol + Sub1 |
2.1 Experimental materials and preparation for experimental trials
Ten rice genotypes were evaluated for both morphological and molecular studies. The field experiment was conducted in perforated small circular plastic pots (16 cm in length and 12 cm in diameter). The seeds were sown in seedbed on 28 January and then 30-day-old seedlings were transplanted into the perforated pots. At first, three seedlings were transplanted in each pot and later thinned into one. Net clothes were used for preparation of bags, which were well fitted in pots. Inside the pot, a net bag was placed. Then the pots were filled with soil containing N-, P-, and M-containing fertilizers. The soil was fertilized with 50 mg N, 25 mg P, and 25 mg K per kilogram (kg) of soil. Trays (130 cm × 75 cm × 25 cm) were filled with normal tap water and pots were placed into the trays. These trays served as water bath. Four trays were set for this study; each one contained 50 pots.
2.2 Experiment I: responses of rice genotypes at different levels of submergence at the vegetative and reproductive stages
Four treatments with different durations of submergence were used for rice genotypes to observe variable responses and the performance of yield and yield-contributing characters. The genotypes were submerged in the vegetative stage for 7 and 14 days, and only for 7 days in the reproductive stage. A set of genotypes was maintained in natural growth conditions without undergoing the submergence treatment termed as control. Artificial submerged condition was created in a large tank of 100 cm with water. Tanks were filled with normal tap water. When plants rose to the vegetative (8–10 tiller) and reproductive stages, the water from the trays was removed and the pots were placed into large tanks. Fifty plants were evaluated for submergence for seven days in the vegetative stage, 50 plants were evaluated for submergence for 14 days in the vegetative stage and 50 plants were evaluated for submergence at the reproductive stage for seven days. For each treatment, five replications were made.
2.3 Characteristics of flood water
The floodwater conditions in the tank were monitored every morning and evening. The temperature of water was measured by a thermometer and the pH was measured with a pH meter. Dissolved oxygen was measured every morning and evening with a dissolved oxygen meter (DO 5509, Lutron Enterprise, Taiwan).
2.4 Scoring of genotypes with SES method
The Standard Evaluation System (SES) developed by the International Rice Research Institute (IRRI) [30] (Table 2) was used for scoring the rice genotypes.
Standard Evaluation System (SES) of visual stress injury at vegetative stage.
| Score | Observation | Tolerance Level |
| 1 | Normal growth, no leaf symptoms | Highly tolerant |
| 3 | Nearly normal growth, but leaf tips or few leaves whitish and rolled | Tolerant |
| 5 | Growth severely retarded; most leaves rolled; only a few are elongating | Moderately tolerant |
| 7 | Complete cessation of growth; most leaves dry; some plants dying | Susceptible |
| 9 | Almost all plants dead or dying. | Highly susceptible |
2.5 Assessment of yield and yield-contributing characters
To know the performance of the rice genotypes at different levels of submergence and growth stages, data were recorded for days to flowering, plant height, tiller number plant−1, effective tiller plant−1, panicle length, dry matter, harvest index, yield plant−1, chlorophyll content and so on. The days to flowering were recorded as days from sowing to flowering when 50% of the plants of each tray flowered. The plant height was measured in centimetres from main culms from the ground level to the tip of its panicle. The total number of tillers (effective and non-effective) were counted for each sample plant. Panicle length was recorded as the distance from the last node of the rachis to tip of the main panicle, which was randomly selected for each plant; the average was taken.
The dry weight (g) of each sample was taken. The samples were oven dried at 50 °C for three days. From every sample plant, 100 clean and sun-dried seeds were counted, and the average was taken and adjusted at 14% seed moisture content. The harvest index was recorded for each sample by dividing the economic yield by the biological yield. The total grain weight (g) of each sample plant was taken after cleaning and sun-drying the samples; the average was taken and adjusted at 14% seed moisture content. The chlorophyll content was measured using chlorophyll meter (SPAD-502 Plus, Konica Minolta, Europe). It is a non-destructive method by which chlorophyll can be measured from the healthy leaves of existing plants. Three leaves of each plant were selected and the average value was taken. The chlorophyll content was measured both before and after submergence.
2.6 Data analysis
The morphological data was analysed by the pieces of software MSTATC and MINITAB 17.
2.7 Experiment II: SSR marker based molecular analysis for identifying submergence tolerant rice genotypes
Ten rice genotypes were analysed with three Single Sequence Repeat (SSR) markers (Table 3); among them two were submergence gene specific markers and one was a diversity marker.
Sequences of 3 SSR markers.
| Primer name | Primer sequence | Annealing temperature (Tm) | Expected PCR product size (bp) | Characteristics |
| SUB1 | F: GAAGAATGGGAGGCCGCCTTGCACGAGTTC R: GTCGTAGGCGGCGAGGAGGCTGTCCATC |
57 | 265 | Gene specific |
| SC3 | F: GCTAGTGCAGGGTTGACACA R: CTCTGGCCGTTTCATGGTAT |
55 | 217 | Gene specific |
| RM24 | F: GAAGTGTGATCACTGTAACC R: TACAGTGGACGGCGAAGTCG |
55 | 192 | Diversity marker |
2.8 Isolation of genomic DNA
Genomic DNA was isolated following the modified CTAB method [31]. Plants were grown in small trays (33 cm × 29 cm × 12 cm) for extracting DNA from leaves. Twenty-one-day-old leaves were collected from growing rice plants and used for DNA extraction.
2.9 SSR marker analysis
PCR was performed for DNA amplification. For each sample, Taq buffer (B) 1.00 μl, MgCl2 0.60 μl, dNTPs 1.00 μl, Taq polymerase 0.12 μl, primer forward 1.00 μl, primer reverse 1.00 μl, ddH2O 3.28 μl were used. Two μl sample DNA was used for each reaction. Amplification with PCR was performed using the following conditions: denaturation at 94 °C for 5 min; 35 cycles of 1 min denaturation at 94 °C, 1 min annealing at 55 °C (for SC3 and RM24) and 57 °C (for SUB1), 2 min extension at 72 °C and a final extension at 72 °C for 7 min. The SSR amplification products were separated in a vertical denaturing 8% polyacrylamide gel. DNA fragments were revealed using ethidium bromide staining. The gels were stained for 20–25 min and were documented with a gel documentation system.
2.10 Statistical analysis of SSR data
The size of the amplified fragments was determined by comparing the migration distance of amplified fragments relative to the molecular weight of the known-size marker commonly known as ladder, 100 base pair (bp) and 20 bp ladder using Alpha-Ease FC 5.0 software (Alpha Innotech, USA). The number of allele per locus, major allele frequency, gene diversity, PIC value and Nei's [32] genetic distance and UPGMA dendrogram were calculated and constructed using Power Marker version 3.25 [33]. All the genotypes were scored for the presence and absence of the SSR bands throughout all 10 genotypes, and the data were exported to binary data for presence (1) and absence (0) or as missing observation for further analysis with NTSYS-pc version 2.2. NTSYS-pc was used to construct UPGMA dendrogram showing the distance based interrelationship among the rice genotypes.
3 Result
Genotypes exhibited a variation in performance in different submerged conditions. The scoring of genotypes showed that most of them were tolerant in 7-day submerged conditions in the vegetative stage, whereas the tolerance level decreased in response to submergence at 14 days; only tolerant checks and SUB1 gene introgressed lines showed tolerance at 14 days in vegetative-stage and 7 days in reproductive-stage submerged conditions (Table 4).
Performance of rice genotypes under different submerged conditions both at the vegetative and reproductive stages.
| Genotypes | Submergence at vegetative stage for 7 days | Submergence at vegetative stage for 14 days | Submergence at reproductive stage for 7 days | |||
| SES Score | Tolerance level | SES Score | Tolerance level | SES Score | Tolerance level | |
| BRRI dhan28 | 3 | Tolerant | 5 | Moderately Tolerant | 7 | Susceptible |
| Binadhan-11 | 3 | Tolerant | 3 | Tolerant | 3 | Tolerant |
| Binadhan-12 | 3 | Tolerant | 3 | Tolerant | 3 | Tolerant |
| Binadhan-7 | 7 | Susceptible | 7 | Susceptible | 7 | Susceptible |
| RC 192 | 3 | Tolerant | 5 | Moderately Tolerant | 3 | Tolerant |
| RC 193 | 3 | Tolerant | 5 | Moderately Tolerant | 5 | Moderately Tolerant |
| RC 225 | 5 | Moderately Tolerant | 5 | Moderately Tolerant | 5 | Moderately Tolerant |
| RC 227 | 3 | Tolerant | 7 | Susceptible | 5 | Moderately Tolerant |
| RC 249 | 3 | Tolerant | 5 | Moderately Tolerant | 3 | Tolerant |
| RC 251 | 3 | Tolerant | 3 | Tolerant | 3 | Tolerant |
3.1 Responses of rice genotypes at different levels of submergence
A decline in the performance of rice genotypes was observed in submerged conditions. Most of the genotypes, either tolerant check or SUB1introgressed advanced lines or susceptible varieties, showed similar performance in control conditions. Days to flowering increased due to giving submergence treatment to the genotypes at a 7-day vegetative stage, whereas days to flowering decreased at 14 days vegetative and 7 days reproductive stages; the mean ranged from 36 to 120 days (Table 5). Genotypes showed a minimum mean number of days to flowering at 7 days in submerged conditions in the reproductive stage and a maximum mean number in control conditions. The yield-contributing characters also exhibited the declining pattern after submerged treatment. In control conditions, no significant difference was observed among the genotypes. However, the tolerant check and the SUB1 gene introgressed lines showed considerably better performance in submerged conditions compared to the other genotypes. A significant genotype × environment interaction was evidenced in this study as the environment had a great effect on genotypes. The plant height of experimental rice genotypes ranged from 29 to 118 cm; in control conditions the results did not show remarkable differences among the genotypes, whereas in submerged conditions the plant height was reduced among the genotypes remarkably. The plant height decreased mostly at 14 days in the vegetative stage and at 7 days in the reproductive stage, with reduced average heights of 64 and 40 cm, respectively. Binadhan-11, Binadhan-12, RC 192, RC 193, RC 227, RC 249 and RC 251 showed better growth performance among the genotypes in submerged conditions. A decrease in the number of tillers was also observed in this study due to submergence (Table 5).
Yield contributing characters of rice genotypes under control and submerged conditions.
| Genotypes | Days to flowering (days) | Plant height (cm) | ||||||
| Control | Submerged | Control | Submerged | |||||
| 7d | 14d | 7d Rep | 7d | 14d | 7d Rep | |||
| BBRI dhan28 | 100.0 def | 115.0ab | 72.00 ijk | 80.00hi | 106.4 abcde | 98.00bcdefg | 36.20 no | 79.40 ghij |
| Binadhan-11 | 95.00ef | 110.0 bcd | 69.00 jk | 76.00 hij | 102.2 abcde | 101.4abcdef | 45.60 mno | 75.20 hijk |
| Binadhan-12 | 97.00 ef | 112.0 abc | 70.20 ijk | 58.20 lm | 90.6 defghi | 94.40 cdefgh | 41.00 mno | 48.60 mno |
| Binadhan-7 | 90.00 fg | 105.0 bcde | 0.0000 p | 36.00 o | 90.6 defghi | 88.20efghi | 0.0000 p | 33.60 no |
| RC 192 | 105.0 bcde | 120.0 a | 50.00 mn | 63.00 kl | 110.4 abc | 97.40bcdefg | 34.00 no | 67.60 jkl |
| RC 193 | 105.0bcde | 92.00 fg | 47.20 n | 84.00 gh | 109.4 abcd | 76.20 hijk | 29.60 o | 80.40ghij |
| RC 225 | 105.0bcde | 69.00 jk | 46.80 n | 42.00 no | 118.8a | 71.40 ijk | 31.20 o | 46.00 mno |
| RC 227 | 100.0 def | 92.00fg | 0.0000 p | 80.00 hi | 89.20 efghi | 80.40ghij | 0.0000 p | 83.00 fghij |
| RC 249 | 100.0 def | 115.0ab | 72.00 ijk | 80.00hi | 118.8 a | 115.0ab | 52.60lmn | 89.60 efghi |
| RC 251 | 110.0abcd | 75.00 hij | 102.4 cde | 44.00no | 105.4abcde | 59.20 klm | 52.20lmn | 38.60 no |
| Mean | 91.7 | 100.5 | 67.55 | 64.32 | 104.54 | 88.16 | 40.3 | 64.56 |
| LSD0.05 | 8.85 | 15.01 | ||||||
| SE (±) | 3.17 | 5.72 | ||||||
| Level of significance | ** | ** | ||||||
| Genotypes | Tiller number plant−1 (Nos.) | Effective tiller plant−1 (Nos.) | ||||||
| Control | Submerged | Control | Submerged | |||||
| 7d | 14d | 7d Rep | 7d | 14d | 7d Rep | |||
| BBRI dhan28 | 16.20 b | 12.60 d | 6.600 hijk | 8.400 ghi | 14.40 ab | 11.80 de | 5.000 mn | 7.800 jkl |
| Binadhan-11 | 10.60 ef | 8.400 ghi | 3.800 nop | 6.400 ijkl | 8.800 hijk | 8.600ijk | 3.200 op | 5.400 mn |
| Binadhan-12 | 15.00 bc | 13.00 d | 5.000 klmn | 8.600 fgh | 13.80 bc | 12.80 cd | 3.400 op | 5.600 m |
| Binadhan-7 | 12.20 de | 16.20 b | 0.0000 q | 6.200 klm | 11.20 ef | 14.80 ab | 0.0000 r | 5.200 mn |
| RC 192 | 13.40 cd | 10.60 ef | 3.600 nop | 6.600 hijk | 10.00 fgh | 10.20 fg | 2.200pq | 5.000 mn |
| RC 193 | 18.20 a | 9.000 fg | 2.000 p | 5.200 klmn | 15.60 a | 8.400ijkl | 1.200 qr | 4.000 no |
| RC 225 | 10.20 fg | 6.800 hijk | 2.800 op | 4.400 lmno | 7.800 jkl | 7.600 jkl | 1.000 qr | 4.200 mno |
| RC 227 | 13.60 cd | 9.000 fg | 0.0000 q | 9.800 fg | 12.60 cd | 7.600 jkl | 0.0000 r | 9.000 ghij |
| RC 249 | 16.00 b | 10.60 ef | 5.600 klmn | 8.200 ghij | 13.80 bc | 9.400 ghi | 5.200 mn | 7.400 kl |
| RC 251 | 15.60 b | 8.600 fgh | 6.200 jklm | 4.200 mno | 13.80 bc | 7.000 l | 5.400 mn | 3.400 op |
| Mean | 14.08 | 10.4 | 4.45 | 6.8 | 12.18 | 9.8 | 3.32 | 5.7 |
| LSD0.05 | 1.74 | 1.24 | ||||||
| SE (±) | 0.625 | 0.445 | ||||||
| Level of significance | ** | ** |
The numbers of tillers plant−1 were reduced at about 4, 10 and 8 for 7 and 14 days in the vegetative stage and 7 days in the reproductive stage under submerged conditions, respectively. Also, the tolerant check and SUB1 introgressed line performed better compared to the susceptible check. Effective tillers plant−1 were also declined after the submergence treatment and ranged from 1 to 14. Binadhan-11, Binadhan-12, RC 249 and RC 251 showed comparatively better performance in both control and submerged conditions (Table 5). The panicle length was reduced to about 2 cm, 11 cm and 7 cm for 7 and 14 days in the vegetative stage and 7 days in the reproductive stage respectively under submerged conditions (Table 6). In control conditions, the tolerant check, SUB1 introgressed lines and susceptible genotypes exhibited no distinct reduction of the panicle length. The reduction was more drastic at 14 days in the vegetative stage under submerged conditions. Above ground dry weight also reduced due to submergence treatment and the mean value ranged from 2.04 g to 65.69 g (Table 6). The plants showed a maximum reduction in their dry weight at 14 days in the vegetative stage under submerged conditions.
Yield-contributing characters of rice genotypes under control and submerged conditions. The values give the mean of plants.
| Genotypes | Panicle length (cm) | Dry weight (g) | ||||||
| Control | Submerged | Control | Submerged | |||||
| 7d | 14d | 7d Rep | 7d | 14d | 7d Rep | |||
| BBRI dhan28 | 25.00 a | 14.00 hi | 7.600 op | 16.60 fg | 46.55 c | 22.74 ghi | 3.830 qrs | 9.520 op |
| Binadhan-11 | 21.60 bcd | 24.40 a | 12.00 ijk | 18.20 efg | 24.65 ghi | 23.69 ghi | 5.860 pqr | 12.98 mno |
| Binadhan-12 | 21.20 bcd | 19.60 de | 10.60 klm | 11.40 jkl | 29.77 f | 22.06 hij | 5.280 pqr | 12.86 mno |
| Binadhan-7 | 21.80 bcd | 20.00 de | 0.0000 q | 8.800 mno | 27.09fg | 22.32 hij | 0.0000 s | 7.720pq |
| RC 192 | 21.80 bcd | 20.80 cd | 7.200 op | 13.20 ij | 40.87 d | 26.63 fgh | 2.040 rs | 20.36 ijk |
| RC 193 | 24.80 a | 16.80 fg | 7.200 op | 18.60 ef | 65.69 a | 20.98ijk | 2.710 rs | 16.87klmn |
| RC 225 | 21.60 bcd | 13.00 ij | 6.400 p | 8.200 nop | 17.24 klm | 17.93 jkl | 2.920 rs | 8.500 op |
| RC 227 | 21.00 cd | 17.00 fg | 0.0000 q | 16.00 gh | 29.72 ef | 15.83 lmn | 0.0000 s | 14.56 lmn |
| RC 249 | 23.40 ab | 23.0 abc | 10.00 klmn | 17.00 fg | 51.65 b | 26.34 fgh | 5.800 pqr | 14.75 lmn |
| RC 251 | 21.20 bcd | 13.80 i | 14.20 hi | 9.400 lmno | 33.78 e | 12.43 no | 6.450 pqr | 9.190 op |
| Mean | 20.22 | 18.24 | 9.32 | 13.74 | 36.69 | 21.09 | 4.36 | 12.73 |
| LSD0.05 | 1.99 | 4.00 | ||||||
| SE (±) | 0.712 | 1.43 | ||||||
| Level of significance | ** | ** | ||||||
| Genotypes | 100 seed weight (g) | Yield plant−1(g) | ||||||
| Control | Submerged | Control | Submerged | |||||
| 7d | 14d | 7d Rep | 7d | 14d | 7d Rep | |||
| BBRI dhan28 | 2.95 c | 2.330 e | 1.300 lm | 1.830 hi | 47.35 a | 16.82 def | 1.80 qr | 14.26 fghi |
| Binadhan-11 | 2.7 d | 3.130 bc | 1.850 hi | 1.860 hi | 18.73 de | 16.51 efg | 3.23opqr | 10.11 jklm |
| Binadhan-12 | 1.61 jk | 2.210 ef | 1.010 no | 0.7500 pq | 28.54 c | 15.05 efgh | 3.27 pqr | 6.370 mnop |
| Binadhan-7 | 2.930 cd | 2.710 d | 0.0000 s | 0.8800 op | 25.68 c | 15.69 efgh | 0.0000r | 5.210 nopq |
| RC 192 | 2.700 d | 2.710 d | 0.6000 qr | 0.8000 opq | 20.76 d | 18.28 def | 0.84 r | 2.920 pqr |
| RC 193 | 2.890 cd | 2.090 fg | 0.4900 r | 1.450 kl | 48.30 a | 17.85 def | 0.73 r | 7.220 lmno |
| RC 225 | 3.45 a | 2.210 ef | 0.4700 r | 1.200 mn | 17.02 def | 12.76 ghij | 0.99 r | 8.210 klmn |
| RC 227 | 3.33 ab | 2.420 e | 0.0000 s | 2.020 fgh | 17.98 def | 10.36 ijkl | 0.00 r | 11.90 hijk |
| RC 249 | 3.012 c | 2.960 c | 1.260 lm | 1.920 ghi | 45.52 a | 15.15 efgh | 3.17 pqr | 12.03 hijk |
| RC 251 | 2.97 c | 1.700 ij | 1.140 mn | 0.8700 op | 40.92 b | 12.12 hijk | 3.84opqr | 4.120 opqr |
| Mean | 2.85 | 2.44 | 1.01 | 1.35 | 31.08 | 15.04 | 1.83 | 7.82 |
| LSD0.05 | 0.209 | 3.46 | ||||||
| SE (±) | 0.075 | 1.24 | ||||||
| Level of significance | ** | ** |
Binadhan-11, Binadhan-12, RC 249 and RC 251 showed better performance in submerged condition.
The weights of 100 seeds were also taken for each of the treated genotypes and the result showed a little variation among the treatments. However, the seed weight decreased due to submergence at 14 days in the vegetative stage and 7 days in the reproductive stage; the reduction was about 1 g (Table 6). The yield plant−1 was also reduced drastically under submerged conditions. The variation in yield in control condition among the genotypes was genetically inherited. All the genotypes showed a reduction in yield in submerged conditions. The reduction was 15 g, 31 g and 23 g at 7 and 14 days in the vegetative stage and 7 days in the reproductive stage, under submerged conditions, respectively (Table 6). The reduction was more in susceptible genotypes compared to the tolerant check SUB1 introgressed lines. In 14 days of submergence in the vegetative stage, genotypes gave minimum yield, but Binadhan-11, Binadhan-12, RC 249 and RC 251 showed better yield performance than other genotypes (Figs. 1 and 2).
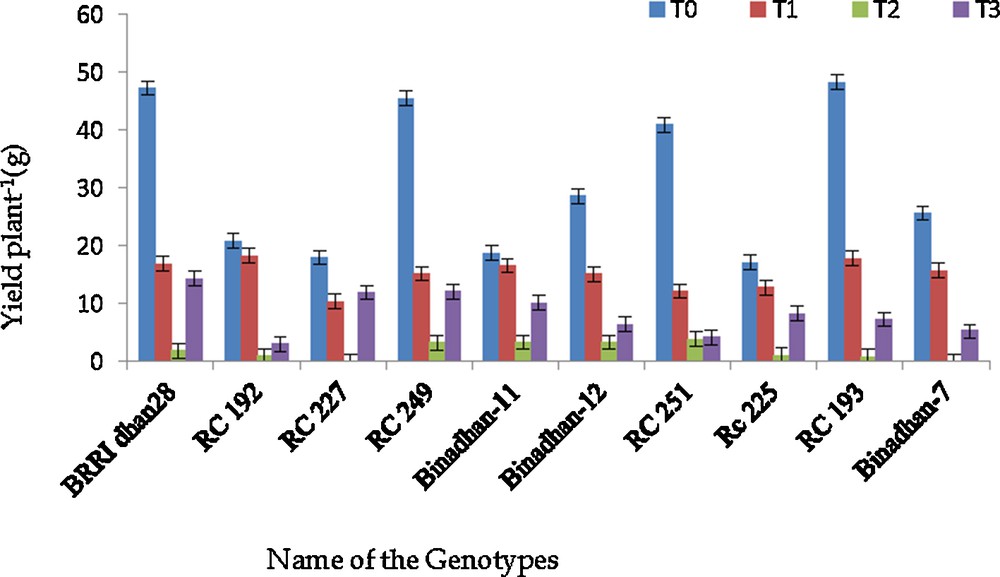
Yield plant−1 of ten rice genotypes at control and submerged condition, T0 = control, T1 = submergence for 7 days in the vegetative stage, T2 = submergence for 14 days in the vegetative stage and T3 = submergence for 7 days. at reproductive stage.
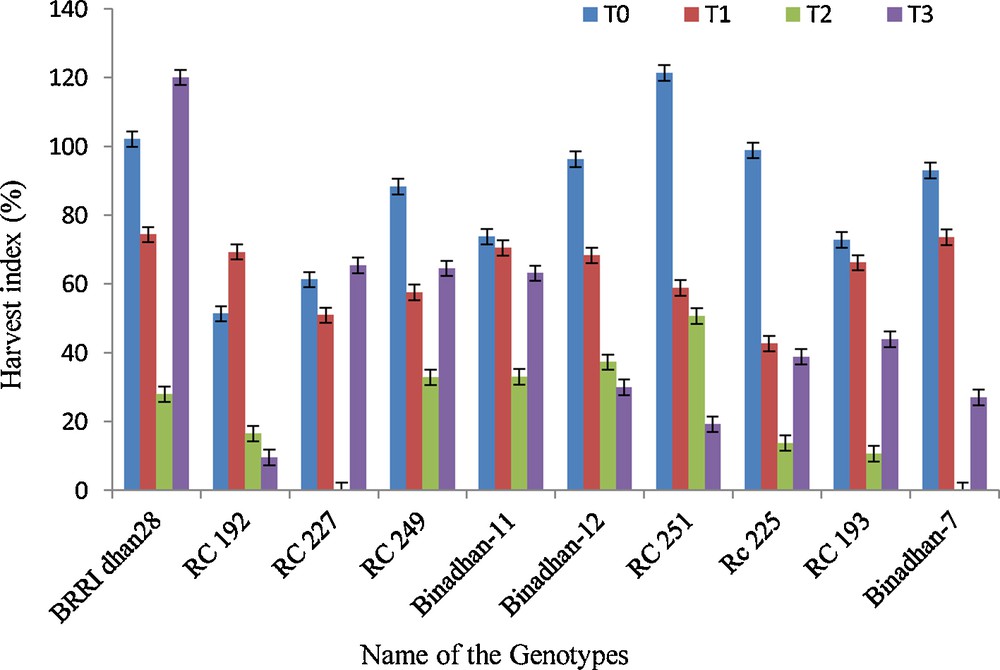
Harvest index of ten rice genotypes in control and submerged conditions, T0 = control, T1 = submergence for 7 days in the vegetative stage, T2 = submergence for 14 days in the vegetative stage, and T3 = submergence for 7 days in the reproductive stage.
The harvest index was calculated from grain yield and dry weight in the present study. However, the harvest index was similar for maximum genotypes in control condition, whereas it declined in submerged conditions. The decrease was maximum at 14 days in the vegetative stage under submerged conditions.
The chlorophyll content was measured both for control and submerged conditions. There were no visible differences in control conditions among the genotypes. The chlorophyll content was reduced a little at 7 days in submerged condition in the vegetative stage, though in some cases it increased. The chlorophyll content was reduced by 19 and 15 SPAD (Soil-Plant Analyses Development) units, respectively, at 14 days in the vegetative stage and 7 days in the reproductive stage, under submerged conditions (Table 7).
Chlorophyll content of ten rice genotypes in control and submerged conditions.
| Genotypes | Chlorophyll content (SPAD unit) | |||
| Control | Submerged | |||
| 7d | 14d | 7d Rep | ||
| BBRI dhan28 | 41.66 | 45.64 | 27.26 | 36.38 |
| Binadhan-11 | 43.32 | 46.36 | 27.86 | 37.80 |
| Binadhan-12 | 40.72 | 42.52 | 25.46 | 24.20 |
| Binadhan-7 | 44.54 | 44.96 | 0.000 | 17.21 |
| RC 192 | 43.22 | 43.40 | 15.86 | 25.28 |
| RC 193 | 45.16 | 35.30 | 18.12 | 35.52 |
| RC 225 | 42.08 | 26.54 | 17.20 | 16.58 |
| RC 227 | 47.34 | 39.86 | 0.000 | 37.46 |
| RC 249 | 44.28 | 41.02 | 26.84 | 37.40 |
| RC 251 | 43.84 | 26.88 | 36.30 | 19.08 |
| Mean | 43.62 | 39.22 | 24.36 | 28.69 |
| LSD0.05 | 3.30 | |||
| SE (±) | 1.18 | |||
| Level of significance | ** |
3.2 Genetic variability, heritability, and genetic advance measurement
A wide range of variations was observed among the rice genotypes for the studied traits. The phenotypic coefficient of variation (PCV) was higher than the corresponding genotypic coefficient of variation (GCV) for all traits (Table 8), which also indicates that all are interrelated to some extent. The values showed that the yields plant−1 (54.92 and 57.86) have the highest GCV and PCV. The dry weight showed GCV and PCV (52.01 and 54.81) close to the yield plant−1. Effective tiller plant−1 (34.83 and 37.22) showed GCV and PCV close to the tiller number plant−1 (32.74 and 36.45), plant height (31.02 and 35.74) and hundred seed weight (33.06 and 34.25). The chlorophyll content (23.55 and 25.03), the number of days to flowering (29.05 and 30.38), the panicle length (28.82 and 30.62) also showed very close GCV and PCV (Table 8). These results indicate that high values of the genotypic coefficient of variation and of the phenotypic coefficient of variation have the possibility to improve the yield through the selection of that trait.
Estimation of genetic parameters for the morphological characters related to yield.
| Characters | Phenotypic variance (δ2p) | Genotypic variance (δ2g) | Grand mean | PCV (%) | GCV (%) | Heritability (%) | GA | GA (%) |
| Days to flowering (days) | 585.00 | 534.85 | 79.62 | 30.38 | 29.05 | 91.43 | 45.55 | 57.21 |
| Plant height (cm) | 665.66 | 501.56 | 72.20 | 35.74 | 31.02 | 75.35 | 40.05 | 55.47 |
| Tiller number plant−1 (Nos.) | 10.14 | 8.18 | 8.74 | 36.45 | 32.74 | 80.68 | 5.29 | 60.58 |
| Effective tiller plant−1 (Nos.) | 7.98 | 6.99 | 7.59 | 37.22 | 34.83 | 87.58 | 5.10 | 67.14 |
| Panicle length (cm) | 22.39 | 19.85 | 15.46 | 30.61 | 28.82 | 88.64 | 8.64 | 55.89 |
| Dry weight (g) | 102.88 | 92.63 | 18.50 | 54.81 | 52.01 | 90.04 | 18.81 | 101.67 |
| 100 seed weight (g) | 0.41 | 0.38 | 1.87 | 34.25 | 33.06 | 93.16 | 1.23 | 65.73 |
| Chlorophyll content (SPAD unit) | 67.23 | 59.53 | 32.76 | 25.03 | 23.55 | 88.54 | 14.95 | 45.65 |
| Yield plant−1 (g) | 66.01 | 59.46 | 14.04 | 57.86 | 54.92 | 90.08 | 15.08 | 107.37 |
The estimates of heritability act as a predictive instrument in expressing the reliability of the phenotypic value. The high heritability is very effective for the selection of a particular trait. Among the traits, the highest heritability was observed for 100 seed weights (93.16) followed by days to flowering (91.43), yield plant−1 (90.08), dry weight (90.04), panicle length (88.64), chlorophyll content (88.54), effective tiller (87.58), tiller−1 (80. 68) and plant height (75.35) (Table 8). The genetic advance is a useful indicator of the progress that can be expected as a result of exercising selection on the pertinent population. Good genetic advance along with high heritability was found for days to flowering (45.55) and plant height (40.05) (Table 8).
3.3 SSR marker based molecular characterization
Using three SSR marker-based primers were used across 10 genotypes and 19 alleles were identified among the studied genotypes. The loci SC3 had the highest number of alleles (8), whereas the loci SUB1 had the lowest number of alleles (5). The average value of the allele was 6.333 (Table 9). The highest genetic diversity was found for SC3 (0.840) and the lowest for SUB1 (0.720); see Table 9. In molecular analysis, microsatellite loci are also multi allelic and the alleles are co-dominant, suggesting their relative superiority in detecting DNA polymorphism. On an average, 33.3% of the 10 genotypes shared a common major allele ranging from 30% (SC3 and RM 24) to 40% (SUB1) at each locus (Table 9). The polymorphic information contents the PIC value, which reflects the allelic diversity and the frequency among the varieties. The PIC value of each marker can be evaluated based on of its alleles, and the PIC values varied significantly for all the studied SSR loci. In the present study, the level of polymorphism among the 10 genotypes was evaluated by calculating the PIC values for each one of the three SSR loci. The PIC values ranged from 0.676 (SUB1) to 0.823 (SC3), with an average of 0.757 per locus (Table 9).
Size and frequency of alleles and diversity index at three SSR loci across 10 rice germplasms.
| Locus | Major allele | Genotype No. | No. of alleles | Rare alleles | Null allele | PIC | Gene Diversity | |
| Size (bp) | Frequency | |||||||
| SUB1 | 265 | 0.400 | 5.000 | 5.000 | 0.0 | 0.0 | 0.676 | 0.720 |
| SC3 | 225 | 0.300 | 8.000 | 8.000 | 0.0 | 0.0 | 0.823 | 0.840 |
| RM24 | 171 | 0.300 | 6.000 | 6.000 | 0.0 | 0.0 | 0.772 | 0.800 |
| Total | 661.0 | 1.00 | 19.00 | 19.00 | 0.0 | 0.0 | 2.271 | 2.360 |
| Mean | 220.33 | 0.333 | 6.333 | 6.333 | 0.0 | 0.0 | 0.757 | 0.787 |
3.4 Genomic banding pattern of 10 rice genotypes using 3 SSR markers
Genomic banding patterns of 10 rice genotypes using three SSR markers are shown in Figs. 3 to 5. The primer RM24, which is a diversity primer, showed polymorphism among the genotypes used in this experiment. Along with two submergence specific primers, SUB1 and SC3 were also evaluated in this study for the comparison of the submergence tolerance of 10 rice genotypes. The genotypes, which showed genomic bands with the same position or near with the submergence tolerant variety Binadhan-11 and Binadhan-12, were supposed to be tolerant to submergence.

Banding pattern of 10 rice genotypes for SSR marker SUB1.
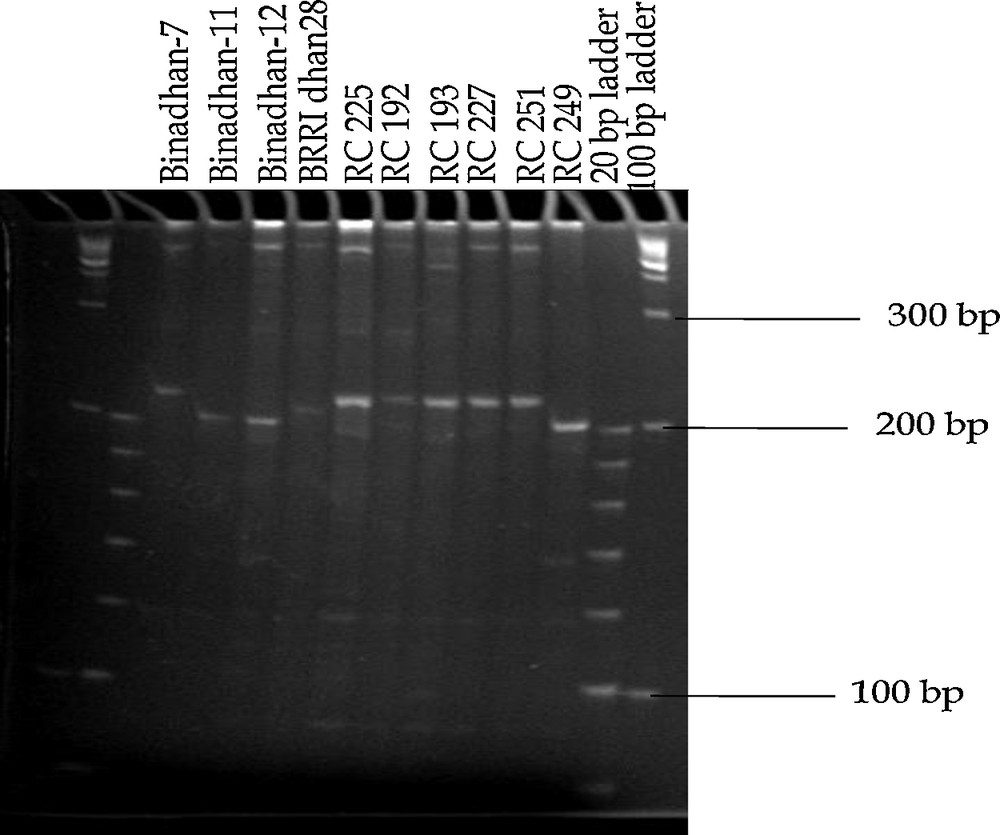
Banding pattern of 10 rice genotypes for SSR marker SC3.

Banding pattern of 10 rice genotypes for SSR marker RM24.
3.5 Cluster analysis
The Unweighted Pair Group Method with Arithmetic means (UPGMA) method was used for cluster analysis to differentiate the studied genotypes into groups based on similarity coefficients. Three clusters were made for the 10 rice genotypes based on their different levels of submergence. However, cluster 1 was divided into two sub-clusters. The first sub-cluster is comprised of BRRI dhan28, RC 225 and Binadhan-12, whereas sub-cluster 2 consists of RC 227 and RC 249. The second cluster was also divided into two sub-clusters: the first one consists of RC 193, RC 251, RC 192 and the second is comprised of Binadhan-11. The third cluster is made up with only one rice genotype, Binadhan-7. The genotypes that showed comparatively the same banding pattern were grouped into the same cluster (Fig. 6).
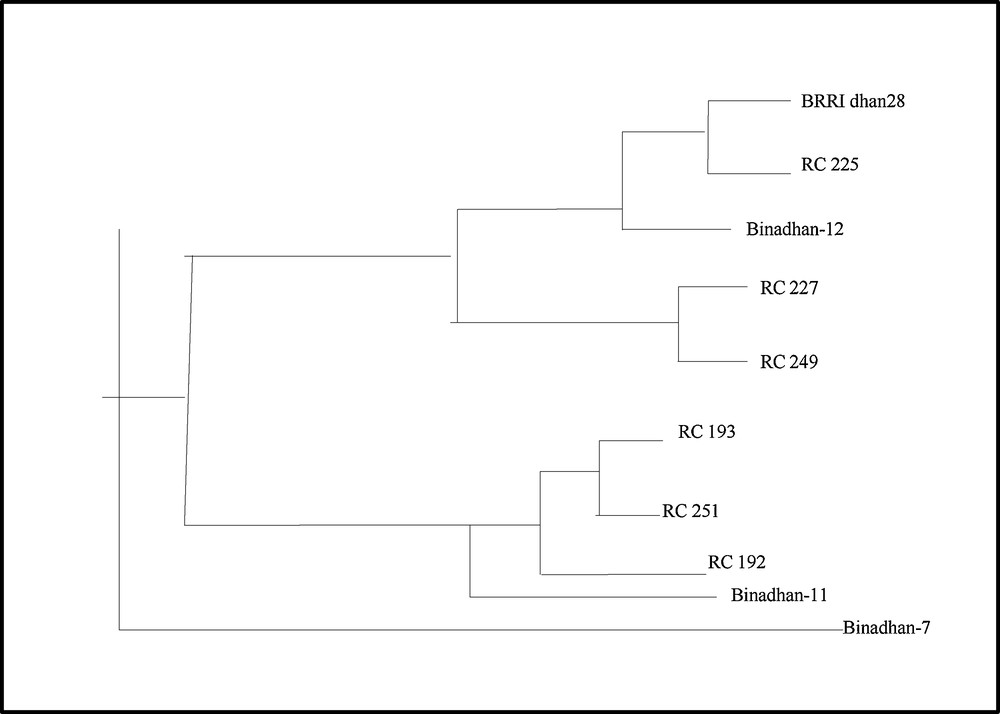
UPGMA dendrogram based on Nei's [32] genetic distance summarizing the data on differentiation among 10 rice genotypes according to SSR analyses.
4 Discussion
Developing submergence-tolerant rice varieties has been a goal of plant breeders for many years. The identification of the SUB1 gene [13] and its introgression into popular rice varieties [22–25] is one of the best achievements of plant breeders, as the local tolerant varieties are poor in agronomic characters, but the introgression of tolerant gene can overcome these difficulties. However, the performances of some submergence tolerant check, susceptible varieties and SUB1 gene introgressed advanced lines have been evaluated in this study.
The scoring of ten rice genotypes under different submerged condition clearly showed that the tolerant check and advanced lines performed better under various submerged conditions. Binadhan-11, Binadhan-12, RC192, RC 249, and RC 251 showed tolerance even at 14 days in the vegetative stage and at 7days in the reproductive stage in submerged conditions, whereas susceptible BRRI dhan28 and Binadhan-7 could not withstand submergence at 14 days of vegetative-stage conditions and 7 days of reproductive-stage condition. This result suggested that the introgression of the SUB1 gene has the advantage of the survival of rice genotypes under different submerged conditions. The SUB1 gene has an ethylene responsive factor (ERF) that is induced at the transcript level; this occurred only during submergence [18,19], and eventually this phenomenon helps the SUB1 introgressed plants survive under submergence stressed conditions.
A delay in days to flowering occurred for all the genotypes after submergence treatment at all levels, but the mean value of genotypes was lower than in the control conditions. This may be because the submergence treatment causes the death of plants. Thus, the total number of plants is reduced in submerged condition, which also reduces the mean. In this study, the plant height was always reduced in submerged conditions compared to the control. The reduction was much more in 14 days of submerged conditions. Due to submergence, most of the plants died and tolerant plant regenerate within a short time, and during that time, the height of the plant could not be attained as much as in the control. It is also observed that after submergence, the SUB1 gene introgression advanced lines and tolerant checks showed lower plant height than the susceptible checks. The reason might be that SUB1 confers submergence tolerance via the conservation of carbohydrates and subsequently reduced underwater elongation [19]. However, not only the SUB1 gene but also the inherent short stature nature of genotypes was also responsible for that reduced elongation under submerged conditions [27]. The reduction in tiller number per plant was also observed in this study under submergence and the reduction was higher in submerged conditions compared to the control plant. Tolerant and SUB1 gene introgressed lines showed less reduction than the susceptible genotypes. After submergence, most of the plants have died, only tolerant or SUB1 gene introgressed advanced lines regenerated, but the numbers of regenerating tillers are small compared to those in control conditions. After 14 days of submergence in the vegetative stage BRRI dhan-28, Binadhan-12, RC 249 and RC 251 showed a good number of tillers compared to other treated genotypes. Under complete submergence, plants received diffused light of low intensity, which is probably the primary cause of a reduction in tillering ability during flooding, particularly in sensitive lines [34]. Although the SUB1 introgressed lines produced tiller in submerged conditions but the effective tiller plant−1 was very poor. This had also impact on yield of the submerged plant. BRRI dhan-28, Binadhan-11, Binadhan-12, RC 249 and RC 251 showed better performance in effective tiller number under submerged conditions. Although BRRI dhan-28, being a susceptible variety, produces good effective tiller, the quality was not satisfactory. At 7 days of submergence of the reproductive stage condition, one of the main causes of reduction in effective tiller plant−1 was that the pollen grain washed away with submerged water due to submergence at the flowering stage. The reduction in dry weight in submerged conditions was mainly due to a lesser tiller number and other growth parameters that reduce the weight of the plant. The reduction in 100 seed weight after submergence was because submergence reduced the weight of the grain. A higher yield is the ultimate goal of any breeding program. Submergence stress reduced the yield of all genotypes. The yield reduction was high at 14 days of submerged conditions. However, the tolerant check and SUB1 introgressed lines showed less reduction under submerged treatment. In the vegetative stage, 14 days of submerged conditions maximum genotypes had died but Binadhan-11, Binadhan-12, RC 249, RC 251 have overcome the submergence injury, and gave little yield. The reduction in yield contributing components like tiller number, effective tiller, panicle length in submerged condition finally reduced the yield of the submergence-affected plant. Reduction in yield leads to a reduction in the harvest index of the submerged plant.
A reduction in the chlorophyll content was observed in submerged conditions for all genotypes, but no significant difference was found in control and submerged conditions. During submergence, the plant gets diffused sunlight and also the environment of submerged water causes the death of many leaves, which may reduce the chlorophyll content of plants. The SUB1A gene induces the metabolic pathway, which reduced chlorophyll degradation, thus allowing continued underwater photosynthesis [19,35]. This may be the reason for the better performance of tolerant and SUB1 introgression advance lines for the chlorophyll content. BRRI dhan-28, Binadhan-11, Binadhan-12, RC 249 and RC 251 showed less reduction in chlorophyll content in this study.
The estimation of the phenotypic and genotypic coefficients of variation is useful for comparing the relative amounts of phenotypic and genotypic variation and for the estimation of the scope of improvement of traits. In this study, the genotypic coefficient of variation (GCV) and the phenotypic coefficient of variation (PCV) were measured and the latter was found higher for all traits than the former. These results indicate that there is an environmental effect on all characters. The estimation of heritability has great influence on the breeding work because it helps to assume the trait, which has more importance in breeding. In this study, high heritability was found for all traits which indicates traits were less influenced by the environment and can be improved for further breeding purpose. High heritability with high genetic advance is an indication that the characters should be used for further breeding purpose (Table 8).
The selected rice genotypes were analysed in this study with a highly repeatable PCR based fingerprinting assay called Simple Sequence Repeats (SSRs). Three SSR markers, namely RM 24, SC3 and SUB1, were used in this experiment for the analysis of genotypic variation. One of the purposes of this study was to identify submergence-tolerant rice genotypes; the specific molecular marker makes the identification easy and reliable. Thus, the diversity marker RM 24 was used to identify diversity among genotypes, and submergence specific markers SC3 and SUB1 were used to know whether there is any relatedness with genotypes with the submergence-tolerant check Binadhan-11 or Binadhan-12. Major alleles can be defined as the alleles with the highest frequency. Here, in the case of SUB1, the allele ranges from 263–548 bp, and the maximum allele was found in 265 bp size. In SC3, the maximum alleles were found in 225 bp and for RM 24 maximum alleles were found in 171 bp size (Table 10). The marker SUB1 showed the lowest gene diversity and SC3 showed the highest gene diversity. It was also observed that markers detecting a lower number of alleles showed less gene diversity than makers detecting higher numbers of allele. The polymorphism information content (PIC) value is the reflection of allele diversity and frequency among varieties. In the present study, the PIC values ranged from 0.676 (SUB1) to 0.823 (SC3).
Molecular analyses results found in all rice germplasms for 3 SSR markers.
| Marker | Sample size | No. of observation | Allele size range (bp) | Diff. (bp) | Heterozygosity |
| SUB1 | 10.0 | 10.0 | 263–548 | 285 | 0.00 |
| SC3 | 10.0 | 10.0 | 210–232 | 22 | 0.00 |
| RM24 | 10.0 | 10.0 | 156–171 | 15 | 0.00 |
| Mean | 10.0 | 10.0 | — | 107.33 | 0.00 |
A banding pattern was observed to identify the similarity or dissimilarity among the genotypes. Marker SC3 was a submergence-specific marker and maximum genotypes showed a genomic band at 225 bp level in the molecular fingerprinting. The expected length of SC3 was 217, and from Fig. 4, it is observed that Binadhan-11 and Binadhan-12 showed a band in that location and most of the advanced line showed a band around that location. Thus, there are similarities among advanced lines and tolerant check. So far, SC3 is one of the closest simple sequence repeat (SSR) markers downstream of SUB1A [21]. The banding pattern of the SUB1 primer showed that the maximum genotypes showed a band at 265 bp. Binadhan-11, which is a tolerant check and advanced lines RC 193, RC 249 and RC 251 were showed the genomic band at the same region around 265 bp. Thus, there are similarities existing among them. These lines can be used for more trials for confirmation of submergence. The genotypes were divided into three clusters. Cluster I is divided into two sub-clusters. The first sub-cluster consisted of BRRI dhan-28, RC 225 and Binadhan-12 and sub-cluster 2 was comprised of RC 227 and RC 249. The second cluster was also divided into two sub-clusters. The first sub-cluster was consisted of RC 193, RC 251, RC 192 and the second contain only Binadhan-11. The third cluster was consisted of only one rice genotype, Binadhan-7. The genotypes, which were in same cluster, are thought to be genetically similar. The banding pattern also showed similarities among the submergence-tolerant checks Binadhan-11, Binadhan-12 with RC 192, RC 193, RC 225, RC 227, RC 249 and RC 251. Morphological clustering has indicated that the advanced lines RC 249 and RC 192, RC 193 and RC 251 had similarity with the tolerant checks Binadhan-11 and Binadhan-12 respectively. Molecular clustering revealed that RC 192, RC 193, RC 249, and RC 251 were similar to check varieties Binadhan-11 and Binadhan-12; these results indicate that they may be submergence tolerant. RC 225 and RC 227 also possess the SUB1 gene and all these advanced lines showed good performance in morphological studies in yield attributes.
It is concluded that the introgression of the SUB1 gene has an advantage with respect to yield in submerged conditions. Susceptible varieties cannot withdraw submergence stress, whereas Binadhan-11, Binadhan-12, RC 249, and RC 251 showed tolerance to different submergence treatments, and RC 192, RC 193 and RC 225 showed moderate tolerance. Clustering at the molecular level showed similarities among the rice genotypes concerning their submergence tolerance. A genetic variability, heritability and genetic advance study showed that days to flowering, plant height, filled grain and harvest index could be modified for further breeding purposes to get a better genetic gain. Submergence specific markers SC3 and SUB1 are exhibited in BINAdhan-11 and Binadhan-12 along with advanced lines RC 192, RC 193, RC 225, RC 249, and RC 251. Clustering showed that, RC 193, RC 225 and RC 249 had similarities with Binadhan-11 and Binadhan-12. Thus, the SUB1 introgressed advanced lines RC 192, RC 193, RC 225, RC 249, and RC 251 need more thorough studies and could be a better option to the farmers for their survival in submerged conditions.
Acknowledgements
The study was supported partly by the Ministry of Science and Information and Communication Technology, Bangladesh. We also thank the Department of Genetics and Plant Breeding, Bangladesh Agricultural University and Plant Breeding and Biotechnology division of Bangladesh Institute of Nuclear Agriculture for providing experimental materials and laboratory facilities.