

1 Introduction
In muscular tissues, the huge number of myosin II heads or crossbridges (CBs) involved in contractile processes provides the necessary ground for applying statistical mechanics. This field of physical sciences represents a powerful tool for establishing links between the microscopic and macroscopic thermodynamic properties of physical and biological systems [2]. Statistical mechanics makes it possible to determine: (i) the statistical entropy of a given system which represents a measure of the degree of disorder; (ii) entropy production rate, quantifying irreversible chemical processes [3]; (iii) other macroscopic thermodynamic properties. For statistical mechanics to be applied in living muscles, a phenomenological description of the behavior of CB molecular motors is needed, and this is provided by A. Huxley's equations [1]. These equations establish a relationship between CB kinetics and the mechanics of the whole muscle. Moreover, they make it possible to determine the probability of several steps of the CB actomyosin cycle [4]. This represents the cornerstone of the process of using statistical mechanics as a tool for mathematical treatment of A. Huxley's phenomenological formalism.
Living organisms are open systems and consequently are not in thermodynamic equilibrium. They are maintained in a non-equilibrium state by a flow of energy and matter. They may operate either near or far from thermodynamic equilibrium [3]. Numerous cellular systems have been shown to behave in a near-equilibrium state and in linear stationary regime [5]. Other living systems operate far from equilibrium [6]. Slow (Soleus) and fast (EDL) skeletal muscles [7] and diaphragm muscle [8] contracting under tetanic conditions have recently been reported to work in a stationary linear regime where thermodynamic force linearly varies with thermodynamic flow [3]. However, skeletal muscles under twitch conditions, heart muscle and tracheal smooth muscle have not been investigated in terms of thermodynamic force and flow. The aim of the present study was to apply statistical mechanics to both striated and smooth muscles, i.e., in diaphragm (in twitch and tetanus), heart and tracheal smooth muscle (TSM). Thermodynamic properties such as statistical entropy, internal energy, chemical affinity, thermodynamic force, thermodynamic flow and entropy production rate were determined and characterized each type of muscle studied. We showed that these muscles behaved in a near equilibrium manner and in a stationary linear regime.
2 Materials and methods
2.1 Animals
All procedures conformed to the Guide for Care and Use of Laboratory Animals and were approved by the local committee of our institution. Animals were 3-month-old male rats and were housed under controlled temperature (20–22 °C) and lighting (12-h light-dark cycle), with free access to food and water.
2.2 Experimental setup
Mechanical experiments were conducted on diaphragm and heart muscles, and TSM from Wistar rats. Animals were sacrificed after anaesthesia with intraperitoneal injection of sodium pentobarbital (60 mg/kg). Each muscle strip was rapidly mounted in a chamber containing a Krebs-Henseleit solution (in mM): 118 NaCl, 4.7 KCl, 1.2 MgSO4.7 H2O, 1.1 KH2PO4, 24 NaHCO3, 2.5 CaCl2.6H2O and 4.5 glucose and bubbled with 95% O2–5% CO2 and maintained at pH 7.4 and 26 °C (diaphragm strips; n = 12 in twitch [tw] and n = 10 in tetanus [tet]) (two diaphragm strips in tet were unstable and were discarded), 29 °C (cardiac papillary muscles; n = 20) and 37 °C (TSM; n = 10). For each muscle type, the chosen temperature induced stability and the best mechanical performance. Muscles were electrically stimulated by means of two platinum electrodes delivering either twitch or tetanic stimulation. In cardiac muscle: twitch stimulation (electrical stimulus: 5 ms duration; stimulation frequency: 10/min). In diaphragm: twitch stimulation (electrical stimulus: 1 ms duration; stimulation frequency: 10/min), and tetanic stimulation (electrical stimulus: 1 ms duration; stimulation frequency: 50 Hz; train duration: 250 ms; train frequency: 6/min). In TSM: tetanic stimulation (electrical stimulus: 5 ms duration; stimulation frequency: 50 Hz; train duration: 12 s; train frequency: every 3 min). The electromagnetic lever system has been described earlier [9].
2.3 Muscle and crossbridge mechanics
Maximum unloaded shortening velocity (Vmax, in Lo.s−1) was measured by means of the zero-load technique. Maximum isometric force (Fo) was measured from the isometric contraction at Lo, the initial length corresponding to the apex of the active tension-initial length relationship. Maximum isometric tension (Po in mN.mm−2) (Fig. 1) was obtained by normalizing Fo per muscle cross-sectional area. Muscle mechanical parameters and those determined from Hill's equation [10] have previously been described [11]. Vmax was determined by means of the zero-load clamp technique with a damping which induced only one oscillation just after the clamp on the phase-plane velocity-length relationship. Seven to ten isotonic load levels (P) were performed. The tension versus time curves and length versus time curves were represented at various load levels for each muscle type in Fig. 1. The tension-velocity (P-V) relationship was fitted according to Hill's equation (P + a) (V + b) = (Po + a) b, where –“a” and –“b” are the asymptotes of the hyperbola as determined by multilinear regression. For each muscle, the P-V relationship was accurately fitted by a hyperbola. Values of the r coefficient of correlation were 0.98 ± 0.01 in diaphragm (tet), 0.90 ± 0.07 in diaphragm (tw), 0.86 ± 0.08 in heart and 0.98 ± 0.01 in TSM (means ± standard deviations (SD). These values did not differ between heart and diaphragm (tw) and between diaphragm (tet) and TSM and were higher in diaphragm (tet) and TSM than in diaphragm (tw) and heart (P < 0.05). The G curvature of Hill's equation was equal to Po/a = Vmax/b, [10,12].

Heart (A); Diaphragm (tet) (B); TSM (C); Diaphragm (tw) (D). In each panel, tension versus time curves (upper traces) and length versus time curves (lower traces) were represented at various load levels.
A. Huxley’ s equations [1] were used to calculate the constants of CB attachment (f1 in s−1) and detachment (g1 and g2 in s−1), maximum turnover rate of myosin ATPase under isometric conditions (kcat in s−1), elementary force per single CB (π in pN), number of active CBs per cross-sectional area (N), maximum efficiency, mean CB velocity, frictional drag force (FDF), and time stroke (ts) [9] (Fig. 2D). A. Huxley’ s equations can be applied to striated muscles in steady state isotonic tetanus. They can also be used in smooth muscles in tetanic conditions as proposed by A. Huxley in his princeps study [1,9]. Calculations of f1, g1, and g2 were based on the following equations [8]:
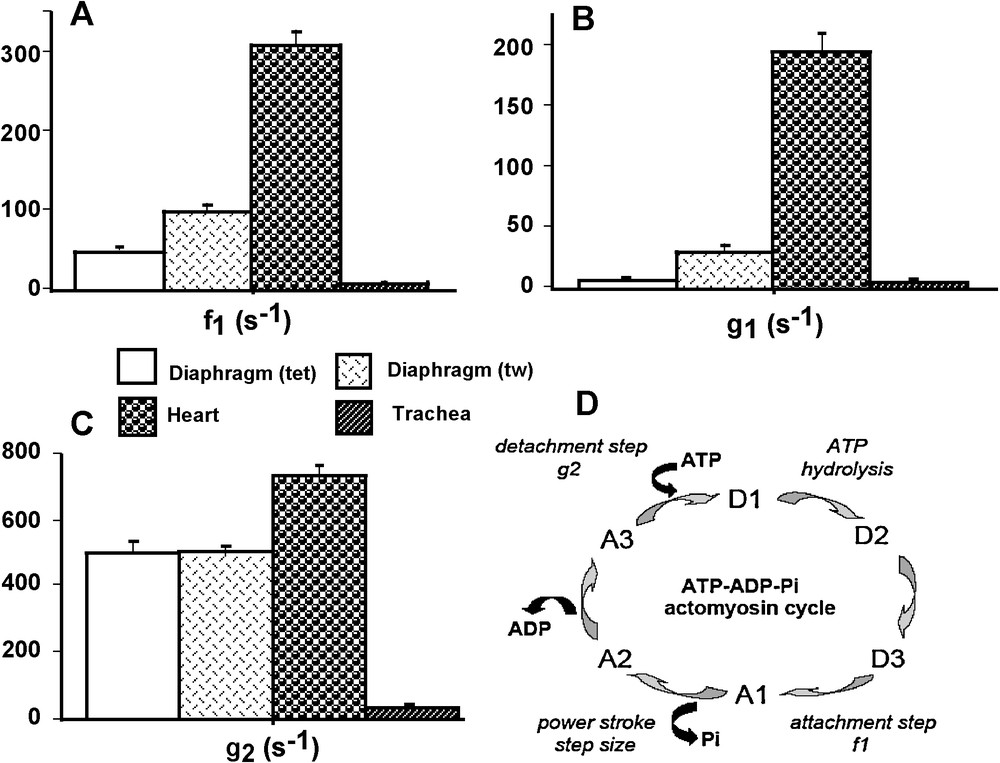
CB kinetic properties and CB cycle. Attachment constant f1 (A); detachment constants g1 and g2 (B and C, respectively); CB cycle (D): The ATP-ADP-Pi-actomyosin CB cycle. The CB cycle was subdivided into six different conformational states, with three detached states (D1, D2, and D3) and three attached states (A1, A2, and A3). Transition A3→D1 was the ATP binding step; CB detachment occurred when ATP bound to the actin (A)-myosin (M) complex (AM) and the rate constant for detachment was g2; AM + ATP → A + M-ATP. Transition D1→D2 was the ATP hydrolysis; M − ATP→M-ADP-Pi. Transition D2→D3 was M-ADP-Pi→M*-ADP-Pi. Transition D3→A1was the weakly bound attachment state: the myosin head (M*-ADP-Pi) weakly bound to A and the rate constant for attachment was f1; M*-ADP-Pi + A→AM-ADP-Pi. Transition A1→A2 was the power stroke or strongly bound state which is triggered by Pi release: AM-ADP-Pi→AM-ADP + Pi. Transition A2→A3 was the release of the hydrolysis product ADP: AM-ADP→AM + ADP.
2.4 Application of A. Huxley's equations to skeletal and cardiac muscles in twitch
For skeletal muscle and under tetanic electrical stimulation, Hill has shown [10] that the coefficient of shortening heat (“a”) and the rate coefficient of total energy liberation during shortening (“b”) were similar to the asymptotes (–a and –b) of the characteristic Hill hyperbola (P + a) (V + b) = (Po + a) b. The rate of total energy liberation has been found to be a linear function of the load, increasing as P diminishes. This represents the Fenn effect [16]. Importantly, the theoretical approach of A. Huxley [1] fitted with Hill's results and with the Fenn effect, and the slope of the rate of total energy liberation versus load linear relationship has been found equal to “–b” except at low load [11,12].
The concept of shortening heat has been shown to be applicable to both twitch and tetanus [17]. Thus, in skeletal muscle under twitch conditions, there is a linear negative relationship between the rate of total energy liberation and load level on a large range of load (from 40 to 100% of total load) [12,18]. Mommaerts has unified the concept of Fenn effect [19] which is observed in skeletal (twitch and tetanus) muscle as well as in cardiac muscle [20]. Importantly, as shown by Howard [21], the Fenn effect has been confirmed at the myosin molecular level due to the fact that, at high ATP concentration, the duration of the displacement transient is shorter than that of the force transient, which is precisely what is expected if high load slows down the acto-myosin hydrolysis cycle [22]. Thus, as the Fenn effect: (i) has been described in both twitch skeletal and cardiac muscles; (ii) represents a pivotal property of Huxley's formalism, we proposed to apply this formalism in our study.
2.5 Statistical mechanics
The grand canonical ensemble is a general ensemble for applying statistical mechanics to complex open systems that exchange energy and matter with their surroundings. The formalism used in the present study and which makes it possible to determine the main thermodynamic parameters of the muscle system S has been previously described [8], i.e., molar statistical entropy (S), molar internal energy (E), microcanonical (z), canonical (Z) and grand canonical (Ξ) partition functions, chemical affinity (A), thermodynamic force (A/T), thermodynamic flow (υ = kcat/L.mol), and entropy production rate (υ × A/T). Thermodynamic flow (υ in s−1.L−1.mol) is equal to kcat (in s−1) expressed in mol * L−1.
2.6 Statistical analysis
Data were expressed as means ± standard deviations (SD). After variance analysis, variables of the four groups were compared using the Fisher test. A P-value < 0.05 was considered statistically significant. Linear and multilinear regressions were based on the least squares method.
3 Results
3.1 Muscle mechanics
Vmax reached the highest value in heart (P < 0.001 versus the other 3 groups) and the lowest value in TSM (P < 0.001 versus the other 3 groups) (Fig. 3B). Vmax in diaphragm did not differ between twitch and tetanus. Po had the highest value in diaphragm (tet) (P < 0.001 versus the other 3 groups) and had the lowest value in TSM (P < 0.001 versus the other 3 groups) (Fig. 3A). Both the asymptotes –a and –b of the P-V hyperbolic relationship were significantly higher in heart than in the other 3 groups (P < 0.001 for each, respectively) (Table 1). The G curvature of the hyperbola was significantly higher in diaphragm (tet) than in the other 3 groups (P < 0.001) (Table 1). G was higher in TSM than in heart (P < 0.01).
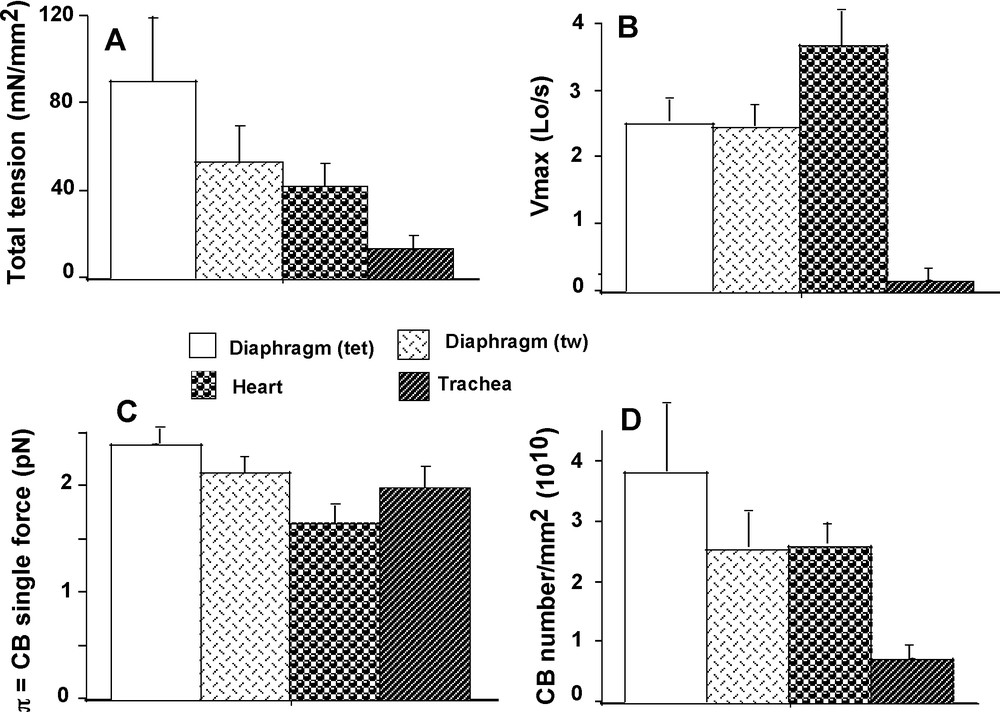
Total isometric tension (A); Maximum unloaded shortening velocity (Vmax) (B); CB single force (C); CB number/mm2 (D).
Mechanical variables.
| Diaphragm (tet) (n = 10) |
Diaphragm (tw) (n = 12) |
Heart (n = 20) |
TSM (n = 12) |
|
| a (mN/mm2) | 11.9 ± 1.7 | 15.1 ± 1.9 | 32.8 ± 2.3 | 1.9 ± 0.8 |
| b (Lo/s) | 0.32 ± 0.04 | 0.64 ± 0.07 | 2.04 ± 0.13 | 0.06 ± 0.01 |
| G | 8.8 ± 0.8 | 4.4 ± 0.6 | 1.6 ± 0.1 | 2.9 ± 0.3 |
| z | 1.06 ± 0.01 | 1.15 ± 0.03 | 1.66 ± 0.04 | 1.46 ± 0.04 |
| lnZ * (109) | 2.12 ± 0.36 | 3.54 ± 0.68 | 13.31 ± 1.29 | 2.61 ± 0.33 |
| lnΞ * (109) | 1.29 ± 0.13 | 0.87 ± 0.08 | 9.32 ± 0.56 | 1.81 ± 0.1 |
3.2 CB kinetics and mechanics
Attachment (f1) and detachment (g1) constants were dramatically higher in heart than in the other 3 groups (P < 0.001 for each) (Fig. 2A and B). The lowest values of f1 and g1 were observed in diaphragm (tet) and TSM, and in both cases there was no difference between the 2 groups. Detachment constant g2 had the highest value in heart (P < 0.001 versus the other 3 groups) and the lowest value in TSM (P < 0.001 versus the other 3 groups) (Fig. 2C). Detachment constant g2, being proportional to Vmax, varied as Vmax. CB single force (π) (Fig. 3C) and Effmax (Fig. 4D) reached the highest values in diaphragm (tet) (P < 0.001 versus the other 3 groups, respectively) and the lowest values in heart (P < 0.001 versus the other 3 groups, respectively). Values of π and Effmax in diaphragm (tw) and TSM were intermediate between those of diaphragm (tet) and heart, but were significantly higher in diaphragm (tw) than in TSM. For π and Effmax, all inter-group comparisons gave P values < 0.001, except the comparison between diaphragm (tw) and TSM where P = 0.07. Total number of CB (N) was maximum in diaphragm (tet) and minimum in TSM (for both, P < 0.001 versus the other 3 groups) (Fig. 3D). Frictional drag force (FDF) reached the highest value in heart and the lowest value in diaphragm (tet) (Fig. 4C). FDF values for diaphragm (tw) and TSM were intermediate between those of heart and diaphragm (tet) but remained significantly lower in diaphragm (tw) than in TSM. For FDF, all inter-group comparisons gave P values < 0.001, except for the comparison between diaphragm (tw) and TSM, where P = 0.22. Mean CB velocity during the stroke step (vo) varied in an opposite manner to that of time stroke ts (Fig. 4A and B). The lowest vo value was observed in TSM (P < 0.001 versus the other 3 groups, respectively). The highest value of ts was observed in TSM (P < 0.001 versus the other 3 groups, respectively). Probabilities of the 6 steps of the CB cycle are presented in Table 2. PD3 had the highest probability in all groups, while PA3 was the lowest. Values of –(Pr * lnPr), (r = 1 to 6) are shown in Table 2. As molar statistical entropy (S) is equal to –R * Σr (Pr * lnPr), it can be seen that steps D2 and D3 made an important contribution to S, particularly in heart and TSM.
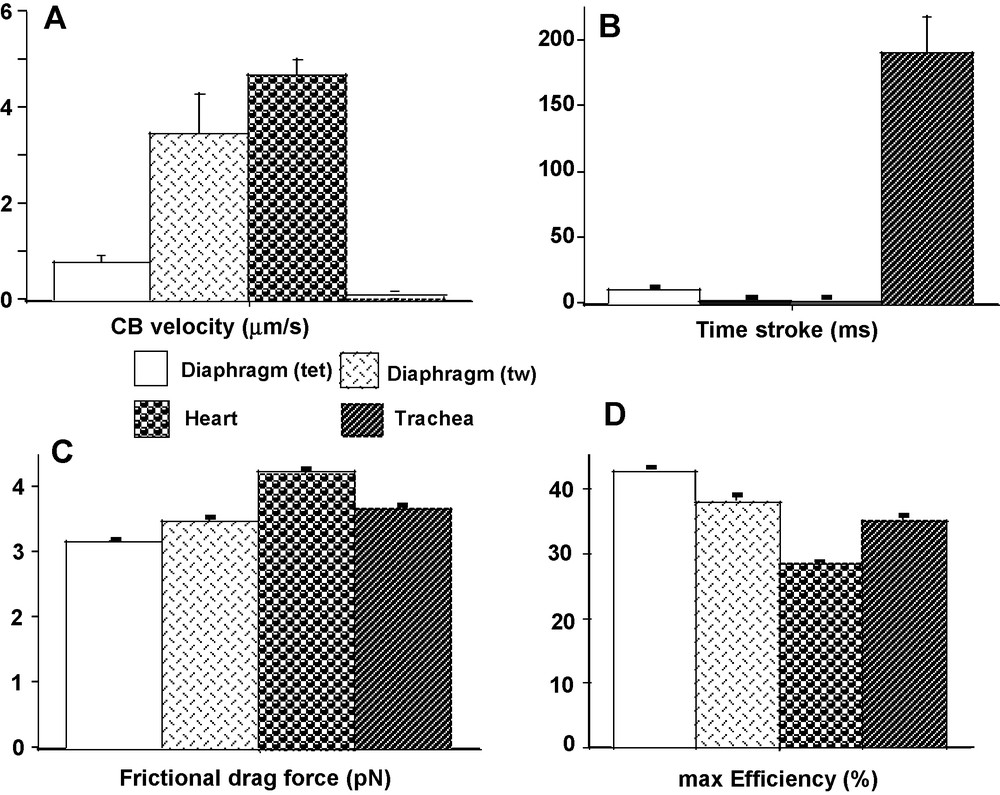
CB characteristics. CB velocity during power stroke step (A); time stroke (B); frictional drag force (C); max. Efficiency (D).
Probabilities of the steps of the CB cycle.
| Diaphragm (tet) (n = 10) |
Diaphragm (tw) (n = 12) |
Heart (n = 20) |
TSM (n = 12) |
|
| PD1 | 0.0020 ± 0.0004 | 0.008 ± 0.002 | 0.028 ± 0.001 | 0.013 ± 0.002 |
| PD2 | 0.018 ± 0.003 | 0.073 ± 0.015 | 0.248 ± 0.011 | 0.121 ± 0.016 |
| PD3 | 0.948 ± 0.005 | 0.872 ± 0.020 | 0.610 ± 0.014 | 0.688 ± 0.017 |
| PA1 | 0.019 ± 0.002 | 0.036 ± 0.003 | 0.067 ± 0.001 | 0.046 ± 0.003 |
| PA2 | 0.013 ± 0.001 | 0.011 ± 0.001 | 0.047 ± 0.003 | 0.132 ± 0.006 |
| PA3 | 3 × 10⁻⁶ ± 2 × 10⁻⁸ | 3 × 10⁻⁶ ± 7 × 10⁻⁸ | 3 × 10⁻⁶ ± 3 × 10⁻⁸ | 5 × 10⁻⁶ ± 1 × 10⁻⁷ |
| –PD1 * lnPD1 | 0.012 ± 0.002 | 0.037 ± 0.006 | 0.099 ± 0.003 | 0.057 ± 0.006 |
| –PD2 * lnPD2 | 0.069 ± 0.010 | 0.175 ± 0.022 | 0.341 ± 0.004 | 0.246 ± 0.018 |
| –PD3 * lnPD3 | 0.050 ± 0.005 | 0.117 ± 0.016 | 0.298 ± 0.007 | 0.255 ± 0.010 |
| –PA1 * lnPA1 | 0.075 ± 0.005 | 0.118 ± 0.008 | 0.180 ± 0.002 | 0.140 ± 0.006 |
| –PA2 * lnPA2 | 0.056 ± 0.002 | 0.051 ± 0.001 | 0.142 ± 0.007 | 0.266 ± 0.006 |
| –PA3 * lnPA3 | 46 ×6 10–5±26 ×6 10–7 | 4 × 10⁻⁵ ± 8 × 10⁻⁷ | 4 × 10⁻⁵ ± 8 × 10⁻⁷ | 6 × 10⁻⁵ ± 8 × 10⁻⁶ |
3.3 Relationships between muscle and CB parameters
There was a complex relationship between Po and N (Fig. 5A), partly because mean values of total tension and crossbridge number (N) did not differ between heart and diaphragm (tw) (P = 0.007) (Fig. 3A and D), although that of π was different (P < 0.001) (Fig. 3C). The heart group appeared to be separate from the 3 other goups approximately arranged in a linear manner. Conversely, there was no relationship between Po and π (Fig. 5C). Fig. 5B shows a non linear inverse relationship between maximum efficiency and the microcanonical partition function (z). There was a curvilinear and inverse relationship between G curvature and FDF (Fig. 5D). Normalized rate of total energy EHux/(Po*Vmax), normalized mechanical power (P*V) / (Po*Vmax), and efficiency as a function of P/Po are presented in Fig. 6. For EHux/(Po*Vmax) and (P*V)/(Po*Vmax), maximum values were observed in cardiac muscle and minimum values in diaphragm (tet) (Fig. 6A and B). For efficiency, opposite results were registered (Fig. 6C).
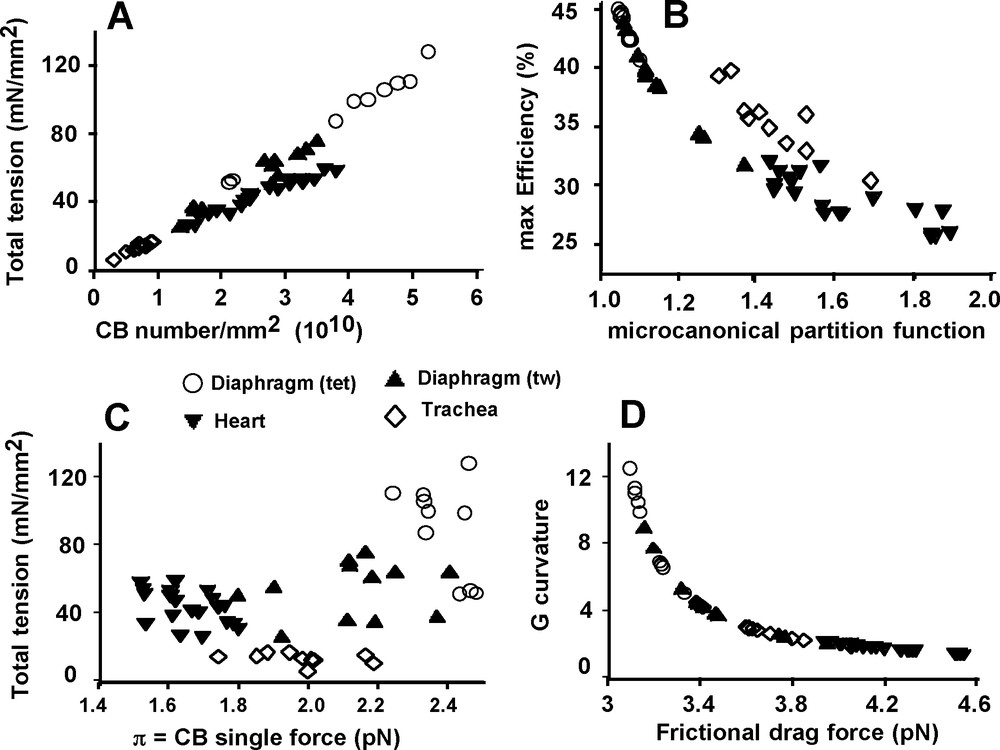
Mechanical relationships. Total tension as a function of CB number/mm2 (A). max Efficiency as a function of the microcanonical partition function (B). Total tension as a function of CB single force (C). G curvature as a function of frictional drag force (D).

Relationship between EHux/(Po.Vmax) and P/Po (A); Relationship between PV/(Po .Vmax) and P/Po (B); Relationship between Efficiency (%) and P/Po (C).
3.4 Statistical mechanics parameters
Statistical entropy (S) reached the highest values in heart (P < 0.001 versus the other 3 groups) and the lowest value in diaphragm (tet) (P < 0.001 versus the other 3 groups) (Fig. 7A). This was explained by the high values of (PD2 * lnPD2) and (PD3 * lnPD3) in the heart and their low values in diaphragm (tet) (Table 2). In both diaphragm (tw) and diaphragm (tet), S was significantly lower than in heart and TSM. However, S was statistically higher in diaphragm (tw) than in diaphragm (tet) (P < 0.001). Internal energy (E) behaved in a fairly similar manner to S, except that E did not differ between heart and TSM (P = 0.060) (Fig. 7B). Comparisons for the energy (E – TS) (Fig. 7C) were similar to S. Grand potential reached the highest negative value in heart (P < 0.001 versus the other 3 groups) and the lowest value in diaphragm (tet) (P < 0.001 versus heart and TSM) (Fig. 7D). Grand potential did not differ between diaphragm (tw) and (tet). Grand potential was moderately, yet significantly less negative in TSM than in heart.
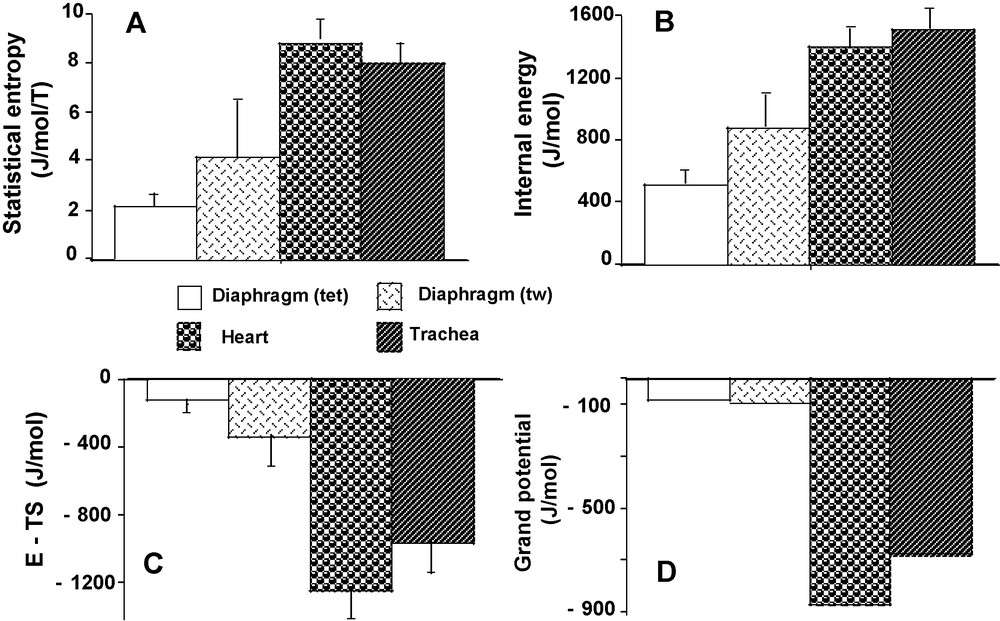
Thermodynamic parameters. Statistical entropy (A). Internal energy (B). E – TS (C). Grand potential (D).
Affinity (A) was significantly lower in diaphragm (tet) than in the other 3 groups (P < 0.03 versus the 3 other groups) (Fig. 8C). However, A did not significantly differ between heart, trachea and diaphragm (tw). Thermodynamic force (A/T) behaved similarly to A (Fig. 8A). Thermodynamic flow (υ) was markedly higher in heart than in the other 3 groups (P < 0.001 versus the other 3 groups) (Fig. 8B). Similarly, the rate of entropy production (A/T × υ) reached the highest value of all the groups in heart (P < 0.001 versus the other 3 groups) (Fig. 8D).
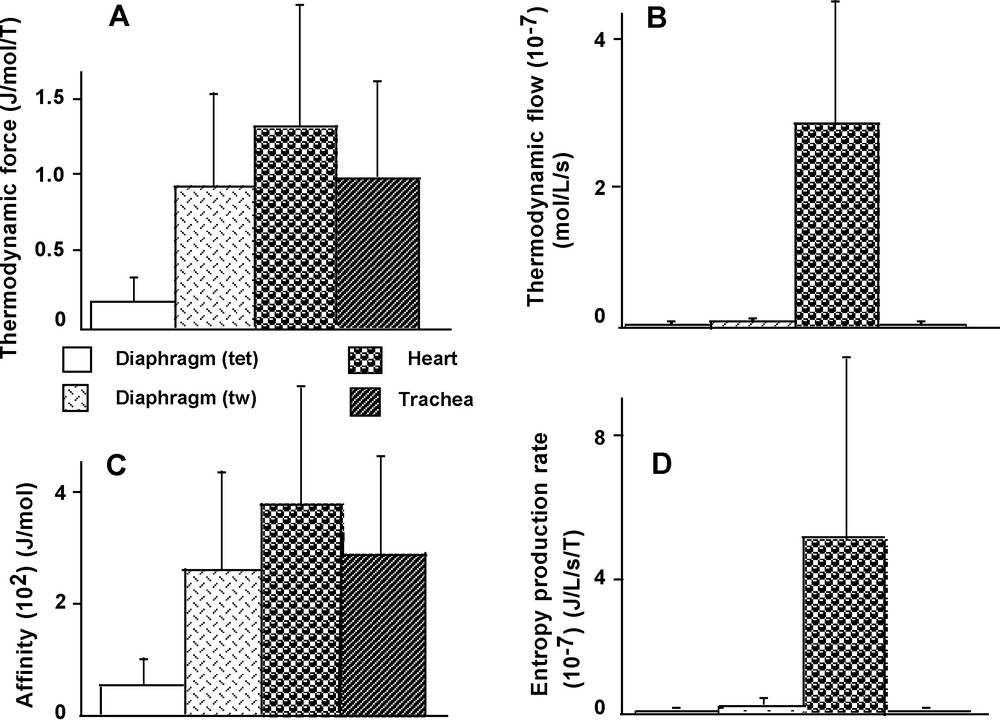
Thermodynamic parameters. Thermodynamic force (A). Thermodynamic flow (B). Affinity (C). Rate of entropy production (D).
Fig. 9A and B show the linear relationships between thermodynamic force (A/T) and thermodynamic flow (υ). Thus diaphragm (tet) and (tw), heart and TSM behaved in accordance with the linear stationary regime for which entropy production rate is minimal according to Prigogine's theorem [23]. Fig. 9C shows that, for a given level of affinity, statistical entropy was higher in heart and TSM than in diaphragm (tet and tw). Fig. 9D shows that the high entropy production rate observed in heart was accompanied by low CB single force, whereas the other 3 groups exhibited low entropy production rate over a large range of CB single force. Microcanonical, canonical, and grand canonical partition function are presented in Table 1. Statistical mechanics parameters observed in diaphragm in tetanus were close to those previously described in fast and slow skeletal muscles [7].

Relationships between thermodynamic parameters and CB properties. Linear relationships between thermodynamic force and thermodynamic flow. Thermodynamic force = .2 Thermodynamic flow; R = .86 (Heart) (A); Thermodynamic force = 2.2 Thermodynamic flow; R = .85 (Diaphragm tet); Thermodynamic force = 5.0 Thermodynamic flow; R = .89 (Diaphragm tw); Thermodynamic force = 16.1 Thermodynamic flow; R = .82 (Trachea) (B). Statistical entropy as a function of affinity (C). Rate of entropy production as a function of CB single force (D).
4 Discussion
The main purpose of this study was to compare the statistical mechanics of striated and smooth muscles. This approach was assessed in heart, TSM and skeletal diaphragm muscle under twitch and/or tetanic conditions. Until now, such thermodynamic studies have been restricted to skeletal muscles under tetanus [7,8]. The phenomenological formalism introduced by A. Huxley makes it possible to apply statistical mechanics to striated and smooth muscles [1]. Thus, due to the huge number of CBs involved in contractile processes, a combination of both statistical mechanics [24] and A. Huxley's equations [1] can be used to determine macroscopic thermodynamic properties of living muscles [2,25].
4.1 Differences in CB kinetics between muscles
Despite considerable differences in CB attachment and detachment constants between the 4 groups studied (Fig. 2A, B and C), CB single force (π) was of the same order of magnitude even though significant differences in π existed between groups (Fig. 3C). However, the large range of CB kinetics encountered in the 4 groups led to a specific thermodynamic profile characterizing each of them (Figs. 7 and 8). There was a factor ranging from 1 to 20 between the highest values of f1, g1, and g2 observed in heart and the lowest observed in TSM (Fig. 2A, B and C).
In the heart, the high values of the attachment (f1) and detachment (g1 and g2) constants were responsible for quick attachment and detachment, and short time stroke (Fig. 2A, B and C and Fig. 4B). Moreover, π and Effmax were proportional to f1/(f1 + g1), although kcat, and consequently the thermodynamic flow υ, were proportional to f1g1/(f1 + g1) [26]. CB kinetics implied that in the heart, (i) CB single force was moderately but significantly lower than in the other muscles studied (Fig. 3C); (ii) maximum turnover rate of myosin ATPase (kcat), thermodynamic flow and rate of entropy production were markedly higher than in the other muscles studied (Fig. 8B and D). This may be partly explained by differences in temperature used for each muscle type but was mainly explained by high values of constants f1 and g1. Although it has been shown that kcat increases with temperature [12], the highest temperature used in our study was applied on TSM (37 °C) and nevertheless this corresponded with the lowest value of kcat and thermodynamic flow (Fig. 8B). The absolute value of the asymptote –b in TSM is similar to those observed in canine trachealis [27] and in other smooth muscles [28,29], and was 35-fold lower in TSM than in the heart (Table 1). The low values of kcat and thermodynamic flow observed in TSM were due to low values of CB kinetics and not to temperature (Fig. 8B). Although Po/a (i.e. the curvature G) is less temperature dependent than asymptote –b, asymptote –b is highly temperature sensitive and has a temperature coefficient of about 2.05 per 10 °C [10]. By comparing with skeletal muscles, the low value of the constant b observed in smooth muscle reflects the low rate of energy expenditure [30]. Smooth muscle is capable of expending nearly as much energy as skeletal muscle, but at a slow rate. This property is reflected by a low rate of tension development and a slow velocity of shortening. Differences in statistical mechanics have been previously described in slow and fast skeletal muscles studied at same temperature and under similar stimulation conditions [7]. Thus, these differences can be partly explained by differences in the molecular structure of the myosin head. Moreover in the present study, differences in statistical mechanics were also observed in a given muscle type, i.e., diaphragm muscle, studied at same temperature but under different stimulation conditions. Thus, the stimulation mode (twitch versus tetanus) induced significant and reversible changes in statistical mechanics.
Structural, biochemical or mechanical factors may account for the large differences in CB kinetics and mechanical statistics observed between the three types of muscles studied: (i) differences in the three-dimensional structure of the myosin head either on the ATP binding pocket or on the actin-binding site [31–33]; (ii) differences in structure or function of the regulatory and essential myosin light chains, or differences in content or activity of the myosin light chain kinase (MLCK) [34]; (iii) functional differences in the calcium-calmodulin complex, etc. However, immediate changes in CB kinetics induced by switching from twitch to tetanus in diaphragm (Fig. 2A, B and C) could not be explained by alterations in the three-dimensional structure of the myosin head. It may be hypothesized that changing the mode of electrical stimulation frequency either modifies the chemical environment of the myosin head or modulates the function of amino-acid loops localized on the ATP binding pocket or the actin-binding site of the myosin head. This could change the global activation processes of the CB molecular motors, thus determining characteristic CB attachment and detachment constants [35].
4.2 Near-equilibrium thermodynamics
In the 4 groups studied, near-equilibrium thermodynamic behavior was validated because the chemical affinity (A) was << 2500 J.mol−1 (Fig. 8C) [3,23,36]. Numerous enzymatic systems in muscle cells [37,38], such as Gibbs-Donnan system in heart muscle [39], and Na+-K+ ATPase in all tissues [40] behave near equilibrium. Both normal and pathological skeletal muscles have been reported as behaving in a near-equilibrium state [7,8]. In the present study, the chemical affinity was significantly higher in heart, TSM, and diaphragm (tw) than in diaphragm (tet), but in all cases remained << 2500 J/mol (Fig. 8C) and consequently these muscles behaved near equilibrium.
4.3 Linear regime
Several biological processes behave in stationary non-equilibrium state with irreversible changes such as transport of matter and can be described by kinetic equations. Complex coupled phenomena obey phenomenological laws such as the mass action law between affinities and reaction rates, and Fick's law between a substance flow and its concentration gradient. A flow can be generated against its conjugate force through these kinds of coupling. In our study, thermodynamic force (A/T) varied linearly with thermodynamic flow (υ), so that the system was stationary (Fig. 9A and B) [41]. In such stationary linear regime, Prigogine's theorem can be applied [23]: in the linear regime, total entropy production rate in a system subject to flow of energy and matter reaches a minimum value at the non-equilibrium stationary state. Linear near-equilibrium thermodynamics [5] have been previously reported in numerous fields of living systems, including mitochondria and oxidative phosphorylation, facilitated and active transport [42–46], and time evolution of proteins [47]. Such a linear regime has also been reported in normal skeletal muscles [7] and pathological diaphragm muscles [8].
4.4 Statistical entropy
Statistical entropy (S) is related to the dispersal of energy and represents a measure of the degree of disorder in a given system [2,48]. Statistical entropy is equal to –R Σr (Pr * lnPr). S was markedly higher in heart and TSM than in diaphragm (tw and tet) (Fig. 7A), because the values of –(Pr * lnPr) were higher in heart and TSM than in diaphragm (tet) and (tw) (Table 2). In both heart and TSM, the high values of S contrasted on the one hand with the high values of Vmax and CB kinetics constants in heart and, on the other, with the low values of Vmax and CB kinetics constants in TSM (Fig. 3B and Fig. 2A, B and C). The absolute value of (E – TS) mimicked the profile of S (Fig. 7A and C). Conversely, the profile of CB single force (π) (Fig. 3C) appeared opposite to that of both S and the absolute value of (E – TS). S and the molecular partition function (z) evolved similarly (Fig. 7A and Table 1). The molecular partition function (z) reflects how the total number of molecular motors is distributed – partitioned – over the available states. The value of z gives a rough estimate of the number of molecular states that are significantly populated at T °K. Thus, it has been shown that S and z increase when both Effmax and CB single force π decrease [8].
4.5 Entropy production
Entropy production rate quantifies irreversibility [23]. The higher the rate of entropy production, the further the system moves away from equilibrium [3]. In terms of entropy production rate, the heart played a distinctive role (Fig. 8D) due to the fact that its value was dramatically higher than in diaphragm (tet and tw) and in TSM (Fig. 8D) and in normal skeletal muscle [7] and pathological diaphragm muscle [8]. In the heart, both the high thermodynamic force (A/T) and, to a greater extent, the high thermodynamic flow (υ) contributed to the generation of an important entropy production rate. In the present study, this highlighted the difference between statistical entropy, which is inversely related to CB single force (Fig. 3C and Fig. 7A) and muscle efficiency, and entropy production rate, which is linked to irreversible chemical processes in CB molecular motors (Fig. 8D). Although the heart and TSM exhibited comparable statistical entropy (Fig. 7A), their entropy production rate differed drastically, being high in heart and low in TSM (Fig. 8D). Differences in temperature could not account for this result because thermodynamic flow (υ) is very sensitive to temperature which was 37 °C in TSM and 29 °C in heart. The high value of entropy production rate observed in heart muscle indicated that this muscle generated more irreversible biochemical processes and behaved farther from equilibrium than TSM and diaphragm (tet and tw).
4.6 Limitations of the study
The variables used to characterize CB kinetics and statistical mechanics were calculated but not measured. Despite the contribution made by optical tweezers [22] and X-ray crystallography [14,15], uncertainties remained concerning the exact values of the constants “h” and “l” in A. Huxley's equations. These constants may differ according to either muscle type or animal species. Moreover, only one species was studied and for each muscle type, only one temperature was applied. The temperature was not 37 °C except for TSM, but for each muscle type, the applied temperature induced the best mechanical response and stability.
5 Conclusion
CB kinetics derived from A. Huxley's equations conferred a characteristic profile in terms of statistical mechanics on each muscle type. Statistical entropy, chemical affinity, and rate of entropy production differed in all studied muscles. Normal striated muscles (heart and diaphragm) and smooth muscle (TSM) behaved near equilibrium and in a stationary linear regime. Crossbridge kinetics and statistical mechanics, particularly the rate of entropy production partly depended on the molecular structure of the myosin molecular motor per se. Moreover, changes in stimulation conditions also modulated the thermodynamic variables in a reversible manner. This may be of pathophysiological importance in skeletal muscles in which the tetanic stimulation frequency may change in vivo, and in heart muscle which behave in twitch mode.
Disclosure of interest
The authors declare that they have no conflicts of interest concerning this article.
Acknowledgments
We thank Dr Christian Allard, “Président de la Commission médicale d’établissement de l’hôpital de Meaux”, France, Dr Michel Grivaux, “Directeur du centre de recherche clinique de l’hôpital de Meaux” and Mrs Cindy Mathis, for laboratory facilities.