

1 Introduction
Living organisms have very often quite biased preferences for some synonymous codons coding for the same amino acids. These differences and their variation have been extensively studied, however, no decisive governing rules have yet been discovered. Frequencies of codons for many species are in close correlation with their genome's GC contents, but the underlying forces governing this are not clear–it might be possible, that it is the GC content which is determining a genome's amino acids predilection for the specific codons being used and their bias [1]. On the other hand, it might be that reverse causative relationships are in operation: codons-specific amino acids usage is a driving factor for observed GC contents. Possible factors and forces driving synonymous codons usage postulated so far include, among many others: translational optimization [2–6], mRNA structural effects [7], protein composition [8], and protein structure [9], gene expression levels [2,10], the tRNA abundance differences between different genomes, and tRNA optimization [11–13], different mutation rates and patterns [14]. Also, some other possibilities were hypothesized, like local compositional bias [15], and even gene lengths might play a role too [16].
It is clear that many interesting biological mechanisms underlie the basic phenomenon of genetic code degeneracy. One of its aspects, however, has not been studied until recently [17]–the question dealing with the sequential order of occurrence of synonymous codons. Obviously, an order of elements in a linear set is a different property than the frequency of elements in the set. The amino acid composition of a protein carries much less information than the amino acid sequence of such a protein, which in turn is less information intensive than a corresponding nucleotide sequence coding the same protein. This question can be formulated more precisely if we consider a given frequency of synonymous codon usage characteristic for a gene. There is a very large number of different orders in which the synonymous codons can appear sequentially along the gene without changing either the amino acid sequence of the encoded protein, or the codon usage of the gene.
Influenza viruses are antigenically variable pathogens, capable of continuously evading immune response. Influenza epidemics in humans cause an estimated 500,000 deaths worldwide per year. The genome of influenza A viruses consists of eight RNA segments that code for 10 viral proteins. Based on the antigenic specificities of the hemagglutinin (HA), or neuraminidase (NA) proteins, the influenza A viruses have been divided, respectively, into 16 HA (H1-H16), and nine neuraminidase (N1-N9) subtypes. Accumulation of mutations in the antigenic sites of the HA and NA, altering viral antigenicity, is called the “antigenic drift”. In circulating influenza viruses this antigenic drift is a major process, accumulating mutations at the antibody binding sites of receptor proteins, and enabling the virus to evade recognition by hosts’ antibodies. The HA protein consists of two domains, HA-1 and HA-2: the HA-1 domain, the major antigenic protein of influenza A viruses, contains all of the antigenic sites of HA, and it is under constant immune-driven selection. The segmented nature of the influenza genome allows also for exchange of gene segments–a process of genetic reassortment, involving type A influenza viruses of different subtypes, and may result in the so-called “antigenic shift”, which occurs when progeny viruses that possess a novel HA, or a novel HA and NA, emerge [18,19].
Because of high health, social, and economics impacts of influenza's yearly seasonal epidemics very large collections of complete or partial sequential information databases were accumulated and maintained. Recently, [17], we have proposed an in silico method to tackle the problem of the sequential order of synonymous codons. We have called it ISSCOR (Intragenic, Stochastic Synonymous Codon Occurrence Replacement)–synonymous codons, which occur at different positions of an ORF are replaced randomly by a Monte Carlo routine with their equivalents–the method generates nucleotide sequences of non-original ORFs, which have identical codon usages, and would encode identical amino acid sequences. Previously, the ISSCOR descriptors were used to analyze the complete genome of Helicobacter pylori [17]. The availability of high quality sequential data for influenza created an opportunity to apply the same approach to study in some detail its usefulness to describe temporal and spatial variability of large volume sets for the same gene in differing environments–in an alignment-free manner. Therefore, we have applied the ISSCOR method to the analysis of three sets of orthologous gene sequences isolated from various strains of hemagglutinin of the influenza A virus subtypes: A/H3N2, A/H1N1 (of both the seasonal, and the novel 2009 variant type), and A/H5N1.
2 The method
2.1 The concept of intragenic, stochastic synonymous codon occurrence replacement
Previously [20,21], we have described alignment free approaches to the problem of comparison and analysis of complete genomes, and some techniques enabling to cope with the sparseness of the n-gram type of genomic information representations. The problem of sparse occurrence matrices is even more pronounced when dealing with the number of permutations of the possible synonymous codons. Calculating the set of n–grams for such occurrences will lead to vector representations, which are severely sparse, especially for higher n–grams lengths, and hence to very poor statistics. To alleviate this problem a hybrid approach, [17] was proposed: namely, when computing counts of codon-pair patterns–separated by codon sub–sequences of differing length–the actual composition of these spacer sub–sequences will be neglected. However, when such partial counts are used as a composite set, poor statistics is no longer a hindering obstacle, and the complete information about particular n–gram frequencies profile is preserved, albeit in a distributed and convoluted form.
For every protein coding gene, with its original nucleotide sequence j0, a set of equivalent nucleotide strings (j1, j2, j3,…, jN) is created by a Monte Carlo approach.
These artificial sequences have the following properties:
- • they are all of the same nucleotide lengths as the j0;
- • they have exactly the same amino acid sequence as the j0 (ie, the proteins translated from the j1, j2, j3,…, jN are identical to j0);
- • they have, in the vast majority of cases, a synonymous codon order different from the original sequence j0.
The last is an essential point, which merits a commentary. The probability that a given string ji generated stochastically has the same synonymous codon order as the original j0 decreases with the product of its length, with a probability limit tending rapidly to zero.
Therefore, the ISSCOR method allows comparing the original codon sequence with an ensemble of different synonymous sequences–yet all of them coding for the same sequence of amino acids.
3 Results and discussion
3.1 A/H3N2 Influenza Hemagglutinin
Two sets of the H3N2 influenza virus hemagglutinin (HA) sequences were collected from NCBI: the set A comprising 2217 full length HA gene sequences (1701 nucleotides each); and the set B of 1810 sequences of the HA-1 antigenic region of the H3N2 hemagglutinin gene (987 nucleotides each). Of these 1810 sequences, the first 251 were identical with those described by Smith et al. [22] and isolated in the period of 1968–2002, and the remaining 1559 were obtained by collecting sequences with accession numbers given by Russell et al. [23], spanning the period of 2002–2006. The compositions of the sets A and B were almost entirely different as only two virus isolates were the same in both. The ISSCOR descriptors ([17], the equation 3 there), were calculated for these two sets of sequences, using codon spacer values from λ = 0 to λ = 16, and creating two matrices (MA and MB) of 2217 and 1810 rows respectively, and 2448 columns each.
It was observed that the G + C content in H3N2 hemagglutinin sequences of the set A decreased linearly over the period of 40 years, by approx. 5.93%–which corresponds to the changes in the relative ratios of all four nucleotides, although by different amounts for each. The linear regression parameters of the equation:
Results of principal component analysis (PCA) for the matrix MA (vide infra), showing 2217 data points, are depicted on Fig. 1A. There is a clear timeline trend of the sequences from the years 1968–1970, which are located at the upper left corner, going down towards the minimum at about the years 2001–2002, and then up again to reach the years 2007–2008 at the end of the right arm of the curve. Therefore, to examine this trend more synthetically, the yearly clusters were considered separately for each year between 1968 and 2008. For each yearly cluster their centers, as well as the corresponding standard deviations, were calculated, and are shown on Fig. 1B. The horizontal and vertical bars are proportional in sizes to the respective standard deviations of PC-1 and PC-2 values. Noteworthy, there are three regions of rather increased variability: first, around the year 1968, then the years 2000–2003, and finally the year 2008, with some less diverse periods in between as well. It was found earlier [25], based on extensive analyses of influenza HA sequences of the H1 and H3 subtypes, that the evolution of H3N2 hemagglutinin included long intervals of mostly neutral sequence evolution without noticeable antigenic change showing an excess of synonymous over nonsynonymous substitutions, punctuated by shorter intervals of rapid evolution during which newly dominant lineages quickly displaced previously coexisting ones [26,27]. The stasis intervals showed rather uniform distribution of replacements over the whole HA sequence's length, not favoring epitope regions.

Influenza H3N2 subtype–the scatter-plots of the PC-1 vs. PC-2 principal component of the ISSCOR descriptors for: the 2217 full-length hemagglutinin sequences (panel A); for their yearly cluster centers (panel B); and for the HA-1 antigenic region of the 1810 hemagglutinin sequences (panel C). (Panel A) partial PCA results for the matrix MA (see main text) are shown: PC-1 values (34% of a total variance explained) are plotted on the abscissa, and the PC-2 values (further 17% of a total variance) are plotted on the ordinate axes respectively; (Panel B) the PCA results of sequences depicted on the panel A were binned separately for each year, from 1968 until 2008. For each yearly cluster their Euclidean centers, as well as the corresponding standard deviations, are plotted: PC-1 on the abscissa, and the PC-2 on the ordinate axes respectively. The horizontal and vertical bars at each point are proportional to their respective standard deviations; (Panel C) partial PCA results for the matrix MB are shown: PC-1 values are plotted on the abscissa, and PC-2 values are plotted on the ordinate axes respectively. The antigenic clusters, as described in Smith et al. [22], are marked as follows: Hong Kong 1968 (Hk68)–red circles, England 1972 (En72)–blue stars, Victoria 1975 (Vi75)–green squares, Texas 1977 (Tx77)–blue triangles, Bangkok 1979 (Bk79)–pink diamonds, Sichuan 1987 (Si87)–green circles, Beijing 1989 (Be89)–blue squares, Beijing 1992 (Be92)–red triangles, Wuhan 1995 (Wu95)–green stars, Sydney 1997 (Sy97)–pink circles, and Fujian 2002 (Fu02)–red solid diamonds.
The analogous PCA results for the matrix MB, showing 1810 data points, are depicted on Fig. 1C, marking also members of the antigenic clusters, described in Smith et al. [22]. As was the case for the set A, the yearly clusters of the set B were analyzed in the same manner, details are shown in Table 1 for all the years 1968–2006. Of special interest is the location of the A/Fujian/411/2002 sequence on this plot (the red diamond at about PC1 = 5 and PC2 = 0) as this is the oldest of the six strains constituting the Fu02 cluster, and yet all remaining sequences of this cluster (each isolated in 2003) have their PC2 values below it. Holmes et al. concluded that one clade of H3N2 viruses present at least since 2000 had provided the hemagglutinin gene for all the H3N2 viruses sampled after the 2002–2003 influenza season, and that a reassortment event was the likely progenitor of the antigenicaly variant influenza strains that caused the A/Fujian/411/2002 epidemic of the 2003–2004 season [28]. It is possible that a significant factor of such adaptation involved optimizing the functional compatibility of reassorting segments. Such a phenomenon might be a possible explanation why the lineage leading to the FU02 antigenic type did not dominate the viral population until a few years after its initial appearance, coincidental with an HA reassortment event [22,29]. It should be pointed out that the yearly clusters described here, and the antigenic clusters of Smith et al. do differ, as the latter are defined according to vaccination seasonal changes implemented in the past, thus they always contain sequences from more than a single year.
Characteristics of yearly clusters for the 1810 hemagglutinin's antigenic region HA-1 sequences of the influenza virus serotype H3N2.
| year | HA1 sequences in yearly cluster | cluster's center PC1 | yearly cluster's STD1 | cluster's center PC2 | yearly cluster's STD2 | distance to closest sequence | PC1 closest | PC2 closest | accession closest |
| 1968 | 4 | –22.25 | 0.33 | 12.81 | 0.43 | 0.29 | –22.02 | 12.99 | AY661038 |
| 1969 | 3 | –22.03 | 0.32 | 13.07 | 0.2 | 0.06 | –22.07 | 13.03 | AY660993 |
| 1970 | 2 | –22.19 | 0.4 | 12.91 | 0.13 | 0.29 | –22.47 | 12.82 | AY660995 |
| 1971 | 3 | –22.07 | 0.1 | 12.75 | 0.36 | 0.16 | –21.98 | 12.61 | AY660998 |
| 1972 | 5 | –21.61 | 0.34 | 12.12 | 0.18 | 0.14 | –21.64 | 11.99 | AF201875 |
| 1973 | 4 | –21.67 | 0.35 | 12.36 | 0.39 | 0.22 | –21.46 | 12.42 | AY661002 |
| 1974 | 5 | –21.88 | 0.36 | 12.33 | 0.49 | 0.28 | –22.14 | 12.45 | AY661017 |
| 1975 | 2 | –21.18 | 0.81 | 11.71 | 1.44 | 1.17 | –21.75 | 12.73 | AY661028 |
| 1976 | 6 | –22.62 | 0.3 | 12.81 | 0.68 | 0.35 | –22.47 | 13.13 | AY661006 |
| 1977 | 5 | –22.32 | 0.3 | 12.75 | 0.95 | 0.38 | –22.38 | 13.13 | AY661012 |
| 1980 | 2 | –21.05 | 0.36 | 11.28 | 1.39 | 1.02 | –21.3 | 12.27 | AY661046 |
| 1981 | 1 | –20.73 | 0 | 9.8 | 0 | 0 | –20.73 | 9.8 | AY661014 |
| 1982 | 4 | –20.41 | 0.81 | 9.57 | 0.32 | 0.36 | –20.05 | 9.52 | AY661015 |
| 1983 | 1 | –20.23 | 0 | 9.76 | 0 | 0 | –20.23 | 9.76 | AY661016 |
| 1984 | 1 | –20.8 | 0 | 8.47 | 0 | 0 | –20.8 | 8.47 | AF008867 |
| 1985 | 4 | –20.7 | 0.22 | 8.03 | 0.22 | 0.16 | –20.56 | 7.96 | AY661051 |
| 1986 | 2 | –20.5 | 0.41 | 8.17 | 0.12 | 0.3 | –20.78 | 8.09 | AF008903 |
| 1987 | 3 | –20.72 | 0.51 | 7.47 | 0.24 | 0.25 | –20.8 | 7.71 | AF008888 |
| 1988 | 4 | –20.32 | 0.63 | 6.72 | 0.89 | 0.33 | –20.64 | 6.79 | AY661056 |
| 1989 | 1 | –21.42 | 0 | 4.92 | 0 | 0 | –21.42 | 4.92 | D43786 |
| 1990 | 5 | –20.67 | 0.56 | 5.18 | 1.21 | 1.01 | –21.14 | 6.07 | AY661069 |
| 1991 | 17 | –20.61 | 0.26 | 4.62 | 0.71 | 0.03 | –20.58 | 4.62 | AY661106 |
| 1992 | 45 | –20.52 | 0.43 | 4.11 | 1.05 | 0.38 | –20.55 | 4.49 | AY661123 |
| 1993 | 43 | –19.14 | 0.66 | 1.08 | 0.89 | 0.17 | –18.97 | 1.12 | AY661169 |
| 1994 | 10 | –18.14 | 0.56 | 0.41 | 0.5 | 0.17 | –18.2 | 0.57 | AF008772 |
| 1995 | 16 | –16.37 | 1.48 | –1.48 | 1.11 | 0.57 | –16.93 | –1.51 | AY661187 |
| 1996 | 10 | –15.07 | 1.95 | -1.99 | 2.09 | 1.12 | –14.37 | -2.88 | AY661193 |
| 1997 | 9 | –12.88 | 1.42 | –4.3 | 1.05 | 0.52 | –13.35 | -4.07 | AY661203 |
| 1998 | 19 | –18.7 | 4.16 | 3.46 | 4.7 | 2.12 | –20.66 | 4.28 | AF008684 |
| 1999 | 3 | –7.61 | 1.5 | –6.76 | 0.62 | 0.75 | –6.87 | –6.64 | DQ487340 |
| 2000 | 1 | –7.82 | 0 | –6.82 | 0 | 0 | –7.82 | –6.82 | AY661021 |
| 2001 | 4 | –7.82 | 0.47 | –8.46 | 1.1 | 0.47 | –8.08 | –8.07 | AY661023 |
| 2002 | 183 | –4.97 | 4.58 | –7.63 | 2.49 | 0.95 | –4.89 | –6.69 | EU502483 |
| 2003 | 326 | 1.39 | 3.52 | –4.72 | 2.04 | 0.16 | 1.44 | –4.87 | EU502188 |
| 2004 | 294 | 4.03 | 0.85 | –1.19 | 1.45 | 0.15 | 4.11 | –1.3 | EU501439 |
| 2005 | 365 | 4.78 | 1.54 | 1.58 | 2.74 | 0.26 | 4.62 | 1.37 | EU501739 |
| 2006 | 398 | 5.51 | 0.69 | 4.44 | 1.78 | 0.04 | 5.54 | 4.43 | EU501904 |
3.2 Antigenic mapping of A/H3N2
Antibodies against hemagglutinin provide protective immunity to influenza virus infection, and the HA is therefore the primary component of influenza vaccines, and as the antigenic structure of HA changes significantly over time, the vaccine has to be updated to ensure adequate efficacy against emerging viral variants. The WHO network of influenza centers routinely characterizes the antigenic properties of influenza viruses using inhibition assays, which combined with sequential data of variability in the antigenic HA-1 domain of the HA, are necessary to select strains for use in the seasonal vaccines [30], [31], [32]. Smith et al. [22] used antigenic data from 35 years of influenza surveillance between 1968 and 2003, with the resulting antigenic dataset consisting of a table of 79 post-infection ferret antisera by 273 viral isolates, and 4215 individual HA inhibition (HI) measurements, and then constructed an antigenic 2D map, to determine the antigenic evolution of influenza A/H3N2 virus, using projection [33] from the obtained high-dimensional antigenic data hyperspace.
The accuracy of the predictions has shown that their map might serve as a possible target of an attempt to describe antigenic relationships on a basis of the ISSCOR descriptors. Partial least squares regression (PLS-regression) is a technique used to find relationships between two data sets (X and Y), utilizing a latent variable (LV) approach to modeling the covariance possibly present in these two spaces. Rather than finding hyperplanes of maximum variance between the response and independent variables, as is the case in the PCA-regression, it finds a linear model by projecting the predicted variables together with the observables to a newly constructed space. In this way trying to uncover the multidimensional direction in the X space, that explains the maximum multidimensional variance direction in the Y space [34].
Therefore, the PLS-regression of the antigenic cluster centers’ ISSCOR descriptors, on the 2D map of the Smith's antigenic clusters, was performed, and the results are shown on Fig. 2A. The model utilizing six LVs was found to be optimal (RMS = 0.12), considering that the regression model obtained with only five LVs was not sufficient to achieve prediction errors small enough. Table 2 lists fifty of the most contributing ISSCOR variables used by each of the six LVs. At the bottom of each column there are values of explained variance for the ISSCOR descriptors [X-matrix], and the antigenic map's cluster centers [Y-matrix]. It is noteworthy that only two major LV would already suffice to explain 95% of variance in Y space but at the same time all six LV are necessary to explain the respective variance in X–the 5th and the 6th LV are both contributing almost equally strong.
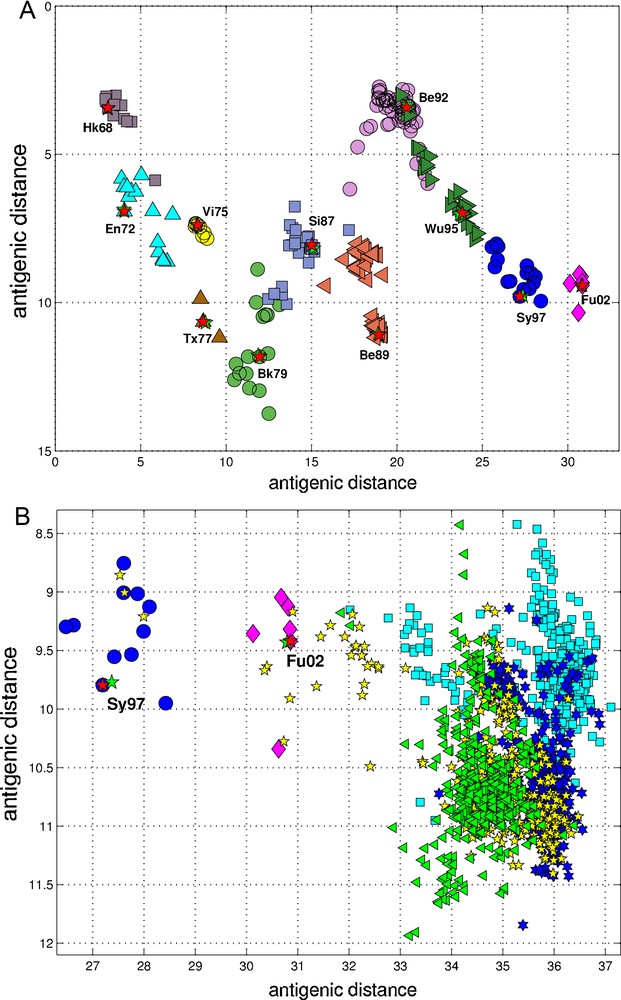
Partial least squares (PLS) regression of ISSCOR deviate descriptors for the HA-1 region of H3N2 gene cluster centers, on the 2D map of antigenic clusters. (Panel A) the antigenic clusters for the 251 H3N2 strains–derived from the original antigenic data [22]–are marked by the corresponding cluster's name: Hong Kong 68–gray squares, England 72–cyan triangles, Victoria 75–yellow circles, Texas 77–brown triangles, Bangkok 79–green circles, Sichuan 87–blue-gray squares, Beijing 89–maroon triangles, Beijing 82–violet circles, Wuhan 95–deep-green triangles, Sydney 97–blue circles, Fujian 2002–magenta diamonds. The positions of each respective cluster centers are shown as the red stars, whereas the corresponding positions of each center as modeled by the LV-6 PLS regression as the green stars; (Panel B) the same PLS model, as was used for the results shown on the panel A was utilized to project positions of all HA-1 region sequences of the set B (see main text) isolated during the next few years: 2003 (cyan squares), 2004 (blue hexagons), 2005 (yellow pentagons), and 2006 (green triangles). Fragments of the Sydney 1997 (Sy97) cluster (blue circles), and the whole Fujinan 2002 (Fu02) cluster (magenta diamonds) are also shown–the red pentagons mark antigenic Sy97 and Fu02 clusters’ centers, whereas green pentagons depict their respective positions as projected by the PLS model. The units of both axes are the same as on the Smith et al. antigenic map ([22], their Fig. 1 on page 372).
Loadings of the partial least squares (PLS) regression of ISSCOR descriptors for HA-1 region of H3N2 gene's cluster centers on the 2D map of antigenic clusters (from [22]).
| No. | LV1 | LV2 | LV3 | LV4 | LV5 | LV6 |
| 1 | xxA-xxC_8 | xxT-xGx_1 | xxT-Axx_1 | xxT-xxT_13 | xGx-Gxx_16 | Txx-xGx_11 |
| 2 | xGx-xCx_9 | Gxx-xAx_3 | Axx-Axx_3 | xGx-xxT_12 | Cxx-Axx_16 | Axx-xTx_12 |
| 3 | xxA-xxC_16 | Gxx-xxG_2 | xxC-xxG_8 | xxG-xGx_11 | Txx-xGx_11 | Cxx-Axx_11 |
| 4 | Cxx-xGx_3 | xxC-Gxx_10 | Axx-Txx_6 | Txx-xAx_5 | xxA-xxG_16 | xxT-xAx_11 |
| 5 | Cxx-xxA_11 | xTx-xxG_11 | xAx-Txx_13 | Txx-xxG_15 | xxG-Cxx_0 | Gxx-Txx_16 |
| 6 | xCx-xxG_0 | xTx-Cxx_10 | xCx-Txx_8 | xAx-xxG_10 | xxC-xTx_11 | xxG-xGx_13 |
| 7 | xxG-xGx_7 | xxT-Axx_1 | xGx-xAx_5 | xTx-xxT_6 | xxC-xxG_12 | Gxx-Cxx_4 |
| 8 | xAx-xxC_8 | Cxx-xAx_12 | xxA-xxC_16 | xxA-xxG_0 | Axx-xxG_1 | xxT-Gxx_3 |
| 9 | xAx-Gxx_7 | Gxx-xxA_16 | xxA-xCx_8 | xGx-xxC_3 | xCx-xGx_8 | Gxx-xxG_7 |
| 10 | xTx-Gxx_1 | Txx-xTx_8 | Axx-xxT_10 | xGx-xTx_15 | xGx-xxC_3 | xAx-xxT_4 |
| 11 | xCx-xxC_4 | Txx-Txx_3 | xxG-xxG_4 | xxA-xxG_13 | Gxx-xxG_4 | xGx-xTx_0 |
| 12 | Cxx-xTx_12 | Txx-Cxx_5 | xCx-xxG_8 | Cxx-xCx_16 | xxC-xGx_8 | xxC-xCx_3 |
| 13 | xAx-xxT_4 | xGx-xxA_6 | xTx-xxG_5 | Gxx-xxT_12 | xGx-Axx_10 | Txx-xCx_1 |
| 14 | xCx-xxA_7 | xxC-xTx_10 | xxA-Gxx_12 | xTx-xGx_4 | xxA-xCx_5 | xxC-xGx_0 |
| 15 | xAx-Txx_15 | Gxx-Gxx_10 | Txx-xxT_11 | xTx-xxA_14 | xxG-Gxx_1 | xxA-Cxx_10 |
| 16 | Gxx-xxG_7 | xxG-xCx_3 | xxA-xCx_3 | Cxx-xTx_3 | xCx-Txx_7 | xxG-Txx_1 |
| 17 | xGx-xxA_3 | xGx-xTx_13 | Cxx-xGx_5 | Cxx-xGx_13 | Txx-xCx_14 | xAx-Gxx_16 |
| 18 | xGx-xTx_6 | xGx-xxA_10 | Txx-Gxx_14 | xxT-Txx_1 | xxG-xxG_3 | Cxx-xAx_12 |
| 19 | xxC-xxT_15 | xGx-Axx_10 | xGx-Gxx_3 | xCx-xxG_9 | xTx-xCx_3 | xCx-Txx_7 |
| 20 | Cxx-xxT_11 | xxT-xxT_9 | xCx-xxG_2 | xAx-Txx_12 | xGx-xxG_12 | Gxx-xxA_12 |
| 21 | xCx-Gxx_5 | xTx-xCx_7 | xxG-xxC_10 | xTx-Axx_11 | Cxx-xCx_11 | Gxx-xxT_4 |
| 22 | Cxx-xGx_5 | Cxx-xxA_6 | xxT-Cxx_7 | xAx-xAx_4 | xxC-Txx_9 | Cxx-Cxx_5 |
| 23 | xxC-xGx_11 | xAx-xCx_9 | xxA-xxG_12 | xxG-xxG_3 | Gxx-xxC_9 | Gxx-xxT_10 |
| 24 | xGx-xxT_6 | xCx-xTx_2 | Cxx-Txx_11 | xxG-xTx_8 | xxC-Txx_8 | xxA-xxC_12 |
| 25 | xxA-xTx_13 | Cxx-xTx_1 | Gxx-xGx_10 | Axx-Gxx_8 | xTx-Gxx_10 | xCx-xxA_8 |
| 26 | xCx-xxT_3 | xGx-xxC_13 | Txx-Cxx_5 | xAx-xTx_9 | xxA-xxA_4 | xCx-xTx_7 |
| 27 | Axx-xxC_5 | Axx-Txx_14 | xAx-xxT_0 | xxT-Axx_5 | xxA-xxA_9 | xTx-Gxx_3 |
| 28 | xxC-xxG_2 | xxG-xGx_0 | xxC-xTx_13 | xxT-xxC_8 | xxA-xxC_8 | xxG-xxA_1 |
| 29 | xCx-xCx_11 | xGx-xGx_10 | Cxx-Cxx_4 | Axx-Cxx_10 | xxA-xCx_15 | xAx-xCx_10 |
| 30 | Gxx-xxG_9 | Txx-xxT_10 | Cxx-Txx_3 | Gxx-xTx_2 | xxG-xGx_11 | xAx-xCx_16 |
| 31 | xxC-Axx_9 | Txx-xxG_2 | Txx-xxG_9 | xxG-xCx_10 | Gxx-xTx_12 | Cxx-Gxx_11 |
| 32 | Txx-Cxx_5 | xGx-Gxx_5 | Axx-Gxx_11 | Axx-Gxx_10 | xCx-Axx_16 | xxA-xxC_16 |
| 33 | xxC-Axx_16 | xxG-xGx_12 | xCx-xxT_3 | xxT-xAx_0 | xxA-xTx_4 | Cxx-xxC_16 |
| 34 | Axx-xCx_8 | Gxx-Axx_11 | xCx-xAx_11 | xxG-xCx_11 | xAx-xAx_2 | xTx-xCx_2 |
| 35 | xxC-xCx_8 | xxC-xGx_8 | Axx-xxA_12 | Gxx-xTx_12 | xCx-xxC_6 | xxG-Txx_12 |
| 36 | xCx-xGx_10 | xxA-xCx_7 | Axx-Axx_2 | xTx-xxG_6 | xGx-Axx_12 | xxA-xxC_9 |
| 37 | xxA-xxG_16 | xxT-xAx_15 | xCx-xxA_16 | xxG-xTx_1 | xAx-Txx_12 | xTx-xxC_4 |
| 38 | xxG-Cxx_1 | Txx-Gxx_5 | xCx-xCx_3 | xxA-xCx_15 | xxA-xxC_12 | xCx-xTx_3 |
| 39 | Gxx-Axx_11 | xxC-xxC_13 | xxG-xxG_11 | Axx-xxG_11 | xxC-xTx_12 | Txx-Gxx_14 |
| 40 | Gxx-xxG_15 | Txx-xGx_4 | xxA-xxT_13 | Axx-xTx_9 | Txx-Txx_10 | xxA-xxC_15 |
| 41 | xGx-xCx_6 | xCx-xxG_6 | xxA-xGx_15 | xxG-xGx_10 | xCx-xxG_13 | xxG-xCx_11 |
| 42 | xAx-xxC_13 | Cxx-Txx_16 | xTx-Cxx_10 | xTx-xxC_0 | xGx-xxG_15 | xTx-xCx_9 |
| 43 | Cxx-xAx_7 | xxG-xGx_16 | Gxx-Gxx_3 | Gxx-xAx_14 | xxT-Axx_10 | xxG-xxA_12 |
| 44 | Cxx-xxT_5 | xTx-xxC_12 | Cxx-Txx_4 | xxC-xxG_10 | xGx-xTx_15 | xxA-xCx_5 |
| 45 | xTx-Axx_15 | Gxx-Cxx_6 | xxT-xCx_10 | xCx-xxC_12 | xCx-xxC_8 | Axx-xxG_1 |
| 46 | xCx-xxC_10 | xxT-xTx_7 | xxT-Txx_0 | Txx-xxA_12 | xCx-xxC_11 | xxA-xCx_0 |
| 47 | xxC-xxG_13 | xxG-xTx_1 | xAx-xTx_0 | xTx-xxC_1 | xxT-Cxx_11 | xCx-Cxx_16 |
| 48 | xTx-xAx_3 | xxC-xxG_15 | xxT-Txx_11 | xxC-xGx_13 | xGx-xxG_4 | Axx-xxG_8 |
| 49 | xxT-xxC_10 | Cxx-xCx_11 | xCx-Txx_11 | Gxx-Cxx_12 | xxC-xxC_12 | xxT-xxC_5 |
| 50 | Gxx-xxG_12 | xTx-xTx_6 | xxC-Cxx_11 | xxC-xxT_16 | Cxx-xGx_13 | xxG-Gxx_12 |
| X% of variance explained | 52.3 | 9.4 | 15.1 | 7.0 | 3.8 | 3.7 |
| Y% of variance explained | 88.7 | 6.3 | 2.2 | 1.4 | 0.9 | 0.2 |
The same PLS model was then used to project positions of H3N2 hemagglutinin strains isolated during each of the respective years (Fig. 2B). Of interest is a rather wide spread of the year's 2005 sequences, some of which are apparently reversing the general trend observed earlier (Fig. 2A), and continued subsequently by the majority of strains isolated in the other 2003–2006 yearly seasonal clusters. Russell et al. ([23], their supplementary materials) had identified and discussed several types of biases possibly influencing the composition of the set B of the HA-1 sequences, however, none of the biases they describe could convincingly explain the behavior of the yearly 2005 cluster observed here (in fact, dispersion in the year 2005 appears to be quite small–cf. Fig. 1B). On the other hand, there were also reports of surprising heterogeneity; strains isolated during 1998–1999 in Germany were characterized by a rather high variance: 75% of viruses examined during that period had completely different genome compositions [35], and similarly high local variability was found in human H3N2 influenza A viruses collected between 1999 and 2004 in New York State [28]. Such intermixing of antigenically distinct strains between different clusters was already present in the Smith's 2D map ([22]), where five strains (Hong Kong/3/95, AF008755; Hong Kong/32/95, AY661185; Hong Kong/38/95, AF008759; Victoria/75/95, AY661188; and Netherlands/91/96, AY661194) assigned to the Bejing 1992 (Be92) cluster were located instead within the Wuhan 1995 (Wu95) one, and vice versa–four strains assigned to the Wu95 (Madrid/G252/93, AY661151; Netherlands/372/93, AF008834; Netherlands/399/93, AY661167; England/7/94, Z46405) were found to belong to the Be92. The same nine sequences are also intermingled in our results from both the PCA (Fig. 1C), and the PLS regressions (Fig. 2A)–with the four strains from Wu95 mixing with the main Be92 cluster as in [22]; and the five strains from Be92 forming additional, small, intermediate cluster, located between the both parental clusters–together with additional eight strains assigned originally to Wu95 (Finland/339/95, AY661184; Netherlands/271/95, AY661191; Finland/338/95, AF368436; Finland/381/95, AY661196; Hong Kong/49/95, AY661187; Lyon/2279/95, AY661192; Geneva/AI9509/95, AY661182; and. Brazil/8/96, AF008733). Similar intermingling was also observed between the Bangkok 1979 (Bk79) and the Singapore 1987 (Si87) clusters (Fig. 2A), and a single strain from the Hong Kong 1968 cluster (Hk68) shifted to the England 1972 group (En72).
Significant vaccine-epidemic mismatches did occur in the past: during 1997–1998 season the Sydney-type viruses replaced the dominant Wuhan-type strains [30], and in 2003–2004, Fujian-like viruses replaced in turn Sydney strains [31]. The evolution of influenza HA has been the subject of intensive research for several decades [22], [36–44]. Many characteristics of HA's sequence evolution can be captured by standard Markov chain substitution models, which assign equal fitness to all accessible amino acids at a site. Kryazhimskiy et al. [45] have shown, however, that such models strongly underestimate the number of homoplasic amino acid substitutions during the course of HA's evolution. They found that such events preferentially occur at positively selected epitopic sites, which suggests that the evolution of the influenza's HA is strongly affected by the long-term site-specific preferences for individual amino acids. Modeling antigenic shift in influenza can help to predict the efficiency of vaccines. The virus is known to exhibit sporadic but sudden jumps in an antigenic distance, generating new antigenic clusters that mismatch vaccines in use, which makes prediction of antigenic properties of such novel strains a major challenge [26,27,43]. This is exacerbated by a scarcity of detailed antigenic data, which is a major problem, despite the very valuable effort of Ndifon et al. ([40], supplementary materials there) who initiated a public repository of such HI data. The current PLS model, which offers quite accurate correlation with the corresponding 2D antigenic map, was calibrated on only the eleven HA clusters’ centers. Should the antigenic data be made available for e.g. each of the all 251 sequences, and/or for more recent strains, improved calibration ought to yield much better and significantly more accurate description of antigenic relationships between A/H3N2 co-circulating viral variants.
3.3 A/H1N1 influenza hemagglutinin
The influenza A/H1N1 serotype was first found in the Spanish flu pandemic victims of 1918–1920, The origins of the 1918 strain are not clear, although it has been suggested that this virus had an avian origin [46,47]. The H1N1 subtype was subsequently a prevailing cause of seasonal influenza A outbreaks (together with subtypes B, and C) all along until 1957, when it was replaced by the A/H2N2 subtype (Asian flu), and later on in 1968 by the A/H3N2 (Hong Kong flu)–although inactivated A/H1N1 was included in antiviral vaccines even during periods when it was no longer a dominant influenza strain [48,49]. In March 2009 reemergence of the A/H1N1 was reported, first in Mexico and US, but the novel variant pandemic rapidly started to be a major source of infection, replacing A/H3N2 through the world. The lack of similarity between the novel variant virus and its nearest relatives indicated that its gene segments have been circulating undetected for an extended period [50]. Its low genetic diversity suggests that the introduction into humans was a single event, or multiple events of similar viruses.
Two sets comprising orthologous genes of the H1N1 influenza's virus hemagglutinin (HA) were collected from NCBI in January 2010; all sequences were unique and in cases when two (or several) sequences were found to be identical, only the earliest one was included in their respective sets:
- • the set C, comprising full length HA gene sequences of 1698 nucleotides (1698NN): 846 sequences of seasonal human A influenza H1N1 (H1N1s_C), 17 sequences of the novel, swine-like variant (H1N1v_C), and 20 sequences of H1N1 isolated from pigs (H1N1sw_C);
- • the set D, comprising full length HA gene sequences of 1701 nucleotides (1701NN): 173 sequences of seasonal human A influenza H1N1 (subset H1N1s_D), 727 sequences of the novel, swine-like variant (subset H1N1v_D), and 174 sequences of H1N1 isolated from pigs (subset H1N1sw_D).
The ISSCOR descriptors ([17], the equation 3), were calculated for these two sets of sequences, using Codon spacer values from λ = 0 to λ = 16, creating two matrices (MC and MD) of 1074, and 883 rows, respectively, and 2448 columns each. The PCA results, scatter plots of PC-1 vs. PC-2 are shown on Fig. 3A (for the set C) and Fig. 3B (for the set D).

Influenza H1N1 subtype–the scatter-plots of the PC-1 vs. PC-2 principal component of the ISSCOR descriptors for full-length hemagglutinin genes: of the matrix MC (panel A); and the matrix MD (panel B). (Panel A) partial PCA results for the matrix MC (see main text) are shown: PC-1 values are plotted on the abscissa, and the PC-2 values are plotted on the ordinate axes respectively. The set C comprised of: 846 sequences of the seasonal human A influenza H1N1 (subset H1N1s_C, red points), 17 sequences of the novel, swine-like variant (subset H1N1v_C, green points), and the 20 sequences of the H1N1 isolated from pigs (subset H1N1sw_C, blue points). Clusters of composition of purely or predominantly H1N1s_C are outlined in pale red; analogous clusters H1N1sw_C are outlined in pale blue; and cluster H1N1v_C in pale green. Beside each cluster their periods of strains’ isolation dates are marked, and all the sequences of swine origin, which are placed within H1N1s_C clusters, are marked as blue squares, together with their accession numbers in blue. (panel B) partial PCA results for the matrix MD are shown. The set D comprised of: 173 sequences of the seasonal human A influenza H1N1 (subset H1N1s_D, red points), 727 sequences of the novel, swine-like variant (subset H1N1v_D, green points), and the 174 sequences of the H1N1 isolated from pigs (subset H1N1sw_D, blue points). The color-coding scheme used is identical as on panel A, additionally all the sequences of human origin which are placed within H1N1sw_D clusters are marked as red stars, together with their accession numbers in red. The two additional H2N2 sequences are marked as magenta triangles.
In the context of analyzing A/H1N1 hemagglutinin sequences one of the most interesting questions is the possible origin of the novel serotype. Antigenically the H1N1 v viruses were homogeneous and similar to North American swine H1N1 viruses, but distinct from seasonal human H1N1. An early cluster analysis of the origins of the new influenza H1N1 virus of Rabadan et al. [52] indicated, that while the gene segments PB1, PB2, PA, HA, NP and NS are related to swine H1N2, and swine H3N2 influenza viruses isolated in North America, the segments NA and M are related to swine influenza viruses isolated in Eurasia. These findings corroborated slightly earlier results of Garten et al. [50] based on maximum likelihood phylogenetic analyses. Of the 1698 NN sequences isolated from swine hosts, which nevertheless all belong notably to the H1N1 human-isolated gene clusters: the D00837 (A/swine/Cambridge/39) was found earlier ([53], their Fig. 2), ([54], their Fig 3) to be located on the human evolutionary lineage. The same was true for the FJ638306 (A/swine/NC/00573/2005), and FJ638298 (A/swine/IL/00685/2005) ([50], their Fig. S2D HA). It is therefore safe to assume that also the FJ611898 (A/swine/Minnesota/07002083/2007) belongs to the same category of A/H1N1 human virus carried over to a swine (Fig. 3AFig. 3). All three sequences: FJ638306, FJ638298, and FJ611898 were found to form jointly one small clade on the neighbor joining tree, corroborating our findings from the ISSCOR analysis.
On the other hand, comparison between the two sets C and D reveals some notable differences. Of the 1701NN sequences isolated from swine hosts there are two: the EU004452 (A/swine/Henan/01/06), and EU004444 (A/swine/Tianjin/01/04) [50,51] both belonging to the large human seasonal H1N1 flu cluster at the top-left in the Fig. 3B. There are also several examples of reverse case–the 1701NN sequences isolated from humans, but grouped together in predominantly swine clusters. This can be observed for the S62154 (A/Alma Ata/1417/84) belonging to the 1930–1945 cluster of swine sequences–Gibbs et al. [54,55] have found S62154 among recombinant hemagglutinin genes, with the A/swine/Iowa/15/30 (EU139823) as its closest neighbor, and suggested them as all being direct descendents of 1918 Spanish flu viruses. Noteworthy, the EU139823 sequence is also closest to the S62154 on our plot. All of the 727 sequences of the novel, swine-like virus variant (subset H1N1v_D) clustered together in one large, compact set (green dots at the top-left in Fig. 3B). The next cluster to the right comprises of 16 swine sequences, and one human sequence (FJ986620, A/Ohio/01/2007), all of them isolated in the US between 2003 and 2007. During the search for possible predecessors of the recent pandemic of swine-origin novel A/H1N1 variant, the FJ986620 was found [56] to be one of a few sporadic cases of infection of humans with a triple-reassortant swine influenza virus prior to March 2009.
Another such human infection by swine reassortant virus DQ889689 (A/Iowa/CEID23/2005) [52,57], found in Iowa study, is among five human A/H1N1 sequences co-clustered in a large 1985–2009 assembly near the bottom of the Fig. 3B; four other human H1N1 isolates located in this cluster are: CY024925 (A/Ohio/3559/1988) [52], L24362 (A/MD/12/1991) [52], U53162 (A/WI/4754/1994) [58], and U53163 (A/WI/4755/1994) [58]. Another three human sequences are located in the next large cluster grouping genes found in the years between 1961 and 1986: CY026139 (A/Wisconsin/301/1976), CY021957 (A/New Jersey/1976) and CY044365 (A/New Jersey/8/1976) [59]. Additionally, Aras et al. [59] have described that two closest relatives to the novel H1N1 human virus were found either in the US (AF455680, A/swine/Indiana/P12439/2000), or in Eurasia (GQ229269, A/swine/Hong Kong/415/2004) [60], both of which are of the A/H1N2 subtype, their sequences were therefore included in the current analysis as well–on Fig. 3B they are marked within the same 2003–2007 group (magenta triangles) as already described for the FJ986620 sequence, and indeed one of them (AF455680) is least distant from the compact cluster of the A/H1N1 2009 pandemic sequences. G.J.D. Smith et al. [60] have estimated for the novel variant H1N1 hemagglutinin gene that the time of most recent common ancestors (TMRCA) of outbreak samples was around 28 August 2008 (between 1st April 2008, and 2nd January 2009). However, their estimate of duration of unsampled diversity was as long as about 10 years (8.41 to 11.02 yrs.).
3.4 A/H5N1 influenza hemagglutinin
The set E comprising of 613 orthologous genes of the H5N1 avian flu virus’ hemagglutinin (HA), of 1707 nucleotides each–isolated from avian hosts during the 1996–2009 period–was acquired from NCBI in January 2010. All sequences were unique–in cases when two (or several) sequences were identical, only the earliest one was included. The ISSCOR descriptors ([17] equation 3) were calculated for this set of sequences, using codon spacer values from λ = 0 to λ = 16, to create the matrix ME of 613 rows and 2448 columns.
The PCA scatter plot of PC1 vs. PC2 for the matrix ME, showing all 613 data points, is depicted on Fig. 4. For nine countries, with the most numerous populations of isolates, their plots are presented as separate panels, there are also separate panels showing remaining strains obtained from Africa, Asia and Europe. Already the analogous results for the A/H1N1 have shown some territorial clustering in several regions (Figs. 3A and B), however, in case of H5N1 here the groupings are remarkably well defined and in many instances also rather well separated between themselves. This is especially evident for strains isolated in several Far Eastern, and South-East Asian countries: China, Vietnam, Hong Kong, Indonesia, and Thailand (Fig. 4). On the other hand, isolates from Europe co-cluster together independently of their country of origin, which is also true for African and Middle-East countries–all of which form the large gathering at around PC1 = -3, and PC2 = 0 position. In roughly the same location there are also points for several Asian countries (all of which are different from the already mentioned five): Afghanistan, Pakistan, Bangladesh, India, Mongolia, Kazakhstan, and Japan. There are also two exceptions from Asia (well separated blue triangles in the panel “Asia” on Fig. 4)–one sequence from Japan (A/duck/Yokohama/aq10/2003, AB212280), and one from Myanmar (A/chicken/Pyigyitagon/204/2006, AB474081), both of them collocated together within the bottom cluster from China. The former H5N1 strain was isolated from duck meat processed for human consumption, imported to Japan from Shandong Province, China in 2003. That virus was antigenicaly different from other H5 viruses, including the Hong Kong H5N1 viruses isolated from humans in 1997 and 2003 [61]. The latter strain was isolated during the 1st outbreak of bird flu in Myanmar in March 2006, and it was subsequently found to belong to the clade-7 (the WHO H5N1 evolution nomenclature) of the highly pathogenic avian influenza (HPAI) [62]. There is also one, rather unexpected case of the isolate from a Belgian crested eagle (A/crested_eagle/Belgium/01/2004, DQ182483; the green square, shown here for clarity at the edge of the top cluster in the panel “Vietnam”, Fig. 4). On a closer examination this highly pathogenic H5N1 strain turned out to have been isolated from smuggled eagles, confiscated at the national airport, after an attempt to illegally enter them into Belgium from Thailand by a traveler [63].
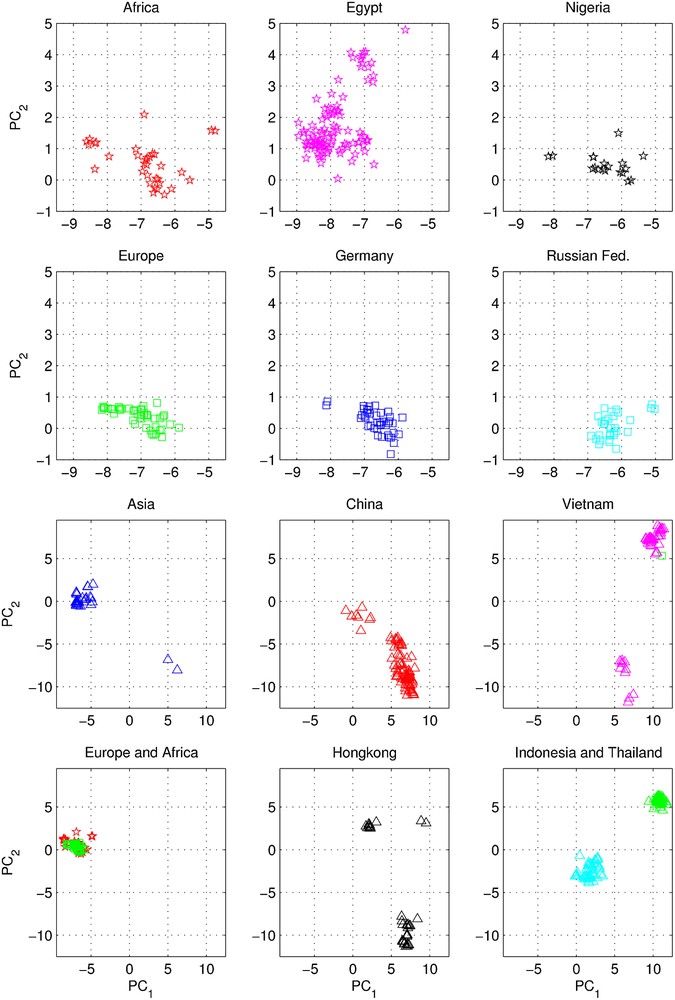
Influenza H5N1 subtype–the PC-1 vs. PC-2 scatter-plots of principal component analysis of the ISSCOR descriptors for full-length hemagglutinin genes of the matrix ME. Partial PCA results for the matrix ME (see main text) are shown: PC-1 values are plotted on the abscissa, and the PC-2 values are plotted on the ordinate axes respectively. For clarity genes isolated in the respective countries or continents are plotted in separate panels–their color codes and symbols are self-explanatory except for Indonesia (cyan triangles) and Thailand (green triangles) in the bottom-right panel. The units of on all panels are identical, however, the top six are plotted at a larger scale to aid resolution (the scatters for both Africa and Europe are also shown again in the bottom-left panel, at the scale identical with the remaining five bottom panels for comparison of different scales of dispersion in various regions). The panel “Africa” comprises H5N1 isolates from all African and Middle East countries except from Egypt and Nigeria (which form two largest sequence clusters of isolates from this continent). The same is true for Europe (the two exceptions are from Germany, and from Russian Federation–again two largest clusters of sequences); as well as Asia (cf. the main text for additional explanations concerning three exceptions for the Asian panels).
Phylogeography of H5N1 viruses was actively researched recently in the regions of Southeast Asia and Far East which were repeatedly subjected to outbreaks of bird flu in poultry, especially in Vietnam [64,65], Thailand [66], and China [67–70], with conclusions rather similar to ours, concerning the yearly origins and seasonal spread of the A/H3N2 viruses [23]. Wallace et al. studied the geographic diffusion of H5N1 following the migration paths of the virus, by a way of a genetic phylogeography of H5N1's HA and NA sequences, and shown that the Chinese province of Guangdong was the source of multiple H5N1 strains spreading at both regional and international scales. In contrast, Indochina appeared to be a regional sink, at the same time demonstrating bidirectional dispersal among localities within the region [71]. They have shown further [72] that the virus migration was filtered out at some international borders, like between China and Vietnam or Thailand, but not at e.g. the one between China and Japan. Their results were recently reanalyzed by Hovmoeller et al. [73] who alleged that using a single tree, and a single optimization path, misestimates the frequency of transmission events, and moreover that the use of a single tree can fail to detect possible transmission events.
For each of the 44 countrywide clusters, their Euclidean centers were found–on the basis of the respective ISSCOR-deviate PC values (Figs. S1 and S2, in the supplementary material, show positions of each center, as well as standard deviations of each cluster in both PC1 and PC2 dimensions, cf. the figure legends for explanations)–and then the sequences closest to each center were established. The outlier sequence from Japan (A/duck/Yokohama/aq10/2003, AB212280, vide infra) was also included in the resulting set. In order to compare the results of this study to a standard phylogenetic technique, we have also calculated the corresponding Neighbour Joining trees. Comparison between both representations had shown a high level of similarities, and the relationships among different clades on the NJ tree corresponded reasonably well to those found through the ISSCOR-PCA method.
4 Conclusions
Numerous studies have shown that the evolution of the influenza virus’ hemagglutinin included long intervals of stasis, without noticeable antigenic change, and showing an excess of synonymous over nonsynonymous substitutions. Stasis periods are occasionally interspersed by shorter intervals of rapid evolution during which emerging lineages displace old variants [25–27,45]. Moreover, such stasis phases demonstrate rather uniform distribution of replacements over the whole gene sequence's length, without favoring epitope regions. The finding that stasis is the prevailing modality of influenza evolution suggests that antigenic changes leading to a higher fitness typically result from epistatic interactions between propitious mutations in key places of antigenic surface proteins. The strains that become dominant emerge in this way from low frequency strains, due to the last replacement that completes the set of substitutions required to produce a significant antigenic change. Zhou et al. [74] performed a comparative analysis of synonymous codon usage patterns in influenza viruses of A and B subtypes. They observed that the synonymous codon usage in genes encoded by different influenza A viruses is genus conservative, and that compositional constraints could explain most of the variation of synonymous codon usage among different virus genes while gene function is also correlated to synonymous codon usages to a certain extent. However, translational selection and gene length have no effect on the variations of synonymous codon usage in these virus genes [38,75,76]. As the basic tenets of the ISSCOR method were anchored on the idea of utilizing statistics of Monte Carlo deviations from expected replacements of synonymous codons, it was of much interest to check to what extent this technique might be suitable to describe behavior of influenza hemagglutinin evolutionary behavior.
If we look at the A/H3N2 timeline and yearly cluster dispersion plot (Fig. 1B), then two things are striking. First, in some periods (standard deviation bars) their dispersion is notably higher–especially during years 1968, 1977, 1999–2002, 2003, and 2008, but also to a smaller extent in 1983, 1996–1997, and 2007; and second, a big jump of a timeline between 2002 and 2203. Some of these effects might be due to a bias in sampling the strain isolates [23], but certainly not all (also, there are some points bridging the gap, so it is not as big, however they just add to a large dispersion of the year's 2002 data points–Fig. 1A). The big gap of the 2002–2003 divide is coincidental with a significant shift in antigenicity connected to an emergence of Fujian2002 like viruses [28,29,31] (cf. also Fig. 1C and Fig. 2A). About as striking as the ISSCOR-PCA of H3N2 behavior in a time domain, are the results of A/H5N1 gene's spatial spread and differences between various country clusters (Fig. 4A, Figs. S1 and S2). Analogous plots for A/H1N1 are not as conspicuous (Fig. 3)–this is in a good agreement with observations [25] that in contrast to H3N2, no clear intervals of evolution under positive selection were detected for the H1N1 hemagglutinin. However, the plots for H1N1 allow one to observe characteristics of the seasonal H1 genes as being markedly different from those of the swine-like flu variant, newly emerged in the year 2009. Based on these examples we consider application of the ISSCOR method for analysis of large sets of orthologous genes as a worthwhile addition to a toolbox of genomics–it allows a rapid diagnostics of trends, and possibly can even aid an early warning of newly emerging epidemiological threats.
Acknowledgements
We would like to thank Marguerite Picard whose generous help made this manuscript possible; Anita Krisko, and François Taddei for numerous discussions; Piotr Płoński for a technical assistance in processing gene sequences; and Pat Churchland for looking over the English. This work was partially supported by the EU project SSPE-CT-2006-44405, and also partially supported from the 352/6.PR-UE/2007/7, the 40-10-02/-501-78-44406, and the 40-10-02/501-64-BST-1550 grants.
Appendix B Supplementary material
Cluster centers and clusters’ dispersion for PC-1 vs. PC-2 countrywide scatter plots of Fig. 4. The Euclidean centers of each cluster from the Fig. 4 together with clusters’ standard deviations are plotted together. The centers are marked the same as on Fig. 4, and their error bars are proportional to one standard deviation (separately for PC-1 and PC-2). The scales of both axes are identical as on six bottom panels of Fig. 4 (compare also with Fig. S2, where the leftmost part is shown enlarged). Cluster centers and clusters’ dispersion for PC-1 vs. PC-2 scatter plots of Africa, Egypt, Nigeria, Europe, Germany, Russia, and Asia genes from Fig. 4. The Euclidean centers of seven cluster from the Fig. 4 together with clusters’ standard deviations are shown enlarged for clarity. The centers are marked the same as on Fig. 4, and their error bars are proportional to one standard deviation (separately for PC-1 and PC-2). Compare with Fig. 4 and Fig. S1.
