

1 Introduction
The wild cardoon (Cynara cardunculus L. var. sylvestris [Lamk] Fiori) is a robust perennial plant, non-domesticated, characterized by its rosette of large thorny leaves branched and a blue-purple flowering stems; it belongs to the Asteraceae family, tribe of Cynarae and it is native to the Mediterranean Basin, where it colonizes dry and quiet lands. Molecular studies [1,2] and cytogenetic and isozyme investigations [3] indicated that this specie is the ancestor of both the globe artichoke (C. cardunculus var. scolymus L.) and the leafy or cultivated cardoon (C. cardunculus var. altilis [DC]).
The wild cardoon is allogame and propagated by seeds (achenes). The majority of seeds will be thrown up near the plant and germinated after the first autumn rains, although the germination can occur throughout the year during the good conditions, the growth extends from September (emergence) to July (mature achenes), and the flowers are usually produced by plants of two years [4].
The wild cardoon has an important regional importance in Tunisia, as it is used in the traditional cooking especially in the north and centre of Tunisia for the preparation of “couscous” and other dishes. The edible parts of the plant are the fleshy stems, which are collected in late autumn–winter.
The cultivated cardoon (C. cardunculus var. altilis DC) is known by its fleshy stems and petioles; it possesses a regional importance in Italy, Spain and South of France [5] and it is propagated by seeds. Its cultivation is much less widespread than that of the globe artichoke; it remains of regional importance in the north of Africa and in Tunisia, where it is used in traditional dishes like the Tunisian or Algerian “couscous”. The edible parts of the plant are the fleshy stems, which are typically collected in late autumn–early winter.
The artichoke (Cynara scolymus L.) is largely cultivated all around the world. In Tunisia, it is cultivated in the northern irrigated areas; this species valorizes efficiently heavy soils and sodium chloride water charged, occurring frequently in the low valley of Medjerda, where this culture is frequently cultivated. The edible parts of this plant in Tunisia are the heads, which are used in many traditional dishes. ‘Violet d’Hyères’ and ‘Blanc Oranais’ are the two most important cultivars in Tunisia [6].
C. cardunculus L. is a polyvalent plant with a wide range of potential applications used in the Mediterranean region for food, as a vegetable and as a substitute for rennet for milk coagulation. More recent applications are: the use of biomass for energy purposes as a solid biofuel or for the production of pulp or biodiesel [7]. This plant is used in several dishes, as soups and salads [8], their seeds could be used to extract food quality oil [9], and their flowers are widely employed in the making of cheeses [10,11]. The wild and cultivated forms of C. cardunculus are a source of biopharmaceuticals products [12,13]. The roots contains inulin which is known as an enhancer of the human intestinal flora, while the leaves are a source of antioxidant compounds that possess antibacterial activity [14].
The use of DNA markers is a technique well-suited to assess the genetic diversity within populations. The advantages of these markers are: the most of them do not show plasticity, they are unlikely to be similar because of convergent evolution, and can generate information in many different places [15]. There are two types of markers most widely used: fragment length polymorphism (AFLP) [16] and microsatellites (single sequence repeats [SSR]) [17]. Due to their codominant inheritance, these markers detects multiple alleles at a given locus, while AFLPs are dominant markers, and detect multiple loci distributed on the whole genome. Microsatellites or SSR are motifs from one to six bases repeated “n” times in the genome [18]; the index “n” may differ from one individual to another. They are found on the whole genome. They are highly polymorphic; the variation's number of repetitions was due to a phenomenon of slippage during DNA replication. We highlighted the microsatellites using PCR; their development is time-consuming for plant species for which there is little DNA sequence information in the public databases [19]. The SSR are codominant markers easy to manipulate [20], but their preparation is quite heavy because it is necessary to “enrich screen genomic library with a probe of the microsatellites, sequence the positive clones, synthesize oligonucleotides primers and testing the primer pairs in a sample of individuals” [21]. The microsatellites SSR can be developed also by analysing sequences present in the database, mostly from EST (Expressed Sequence Tag), the study of [22] exploited recently acquired EST sequence data to develop an extensive set of microsatellites markers. Thus, EST-based microsatellites provided a large set of de novo genetic markers, which show significant amounts of polymorphism both between and within C. cardunculus var. sylvestris, C. cardunculus var. altilis and C. cardunculus var. scolymus [22]. They are well-suited as assays for phylogenetic analysis and the construction of genetic maps in this species [22]. Some SSR dosage was developed recently for C. cardunculus [2,23,24]. Microsatellites quickly become the preferred markers in population genetics analysis due to their advantages especially for species conservation. The nucleotide sequence of a microsatellite consists of tandem repeat of trimers, dimers, or even monomers. It is numerous and well distributed over the genome. These sequences are characterized by an important polymorphism due to variation of the repetitions number according to the alleles [25].
Due to their high informativity and their better distribution in the genome, the microsatellites are ideal markers for the genes’ detection and the genetic diversity study of plant species.
The objective of this work is to study the genetic diversity in six wild cardoon populations and a cultivated one from semi-arid and wet regions of Tunisia using microsatellite markers.
2 Materials and methods
2.1 Plant material
The plant material used in this study are small leaves of six wild cardoon populations collected from five semi-arid regions (Tiurif, Bahra, Zriba, Bouficha and Enfidha) and one wet region (Wad mliz) and one cultivated cardoon population collected from a wet region (Beja), all these regions are located in the north of Tunisia. From each site, we have collected 14 samples. We have chosen only these seven populations of C. cardunculus because this specie is more widespread in the northern part of Tunisia. Fig. 1 shows the geographical location of the studied populations in the bioclimatic map of Tunisia.
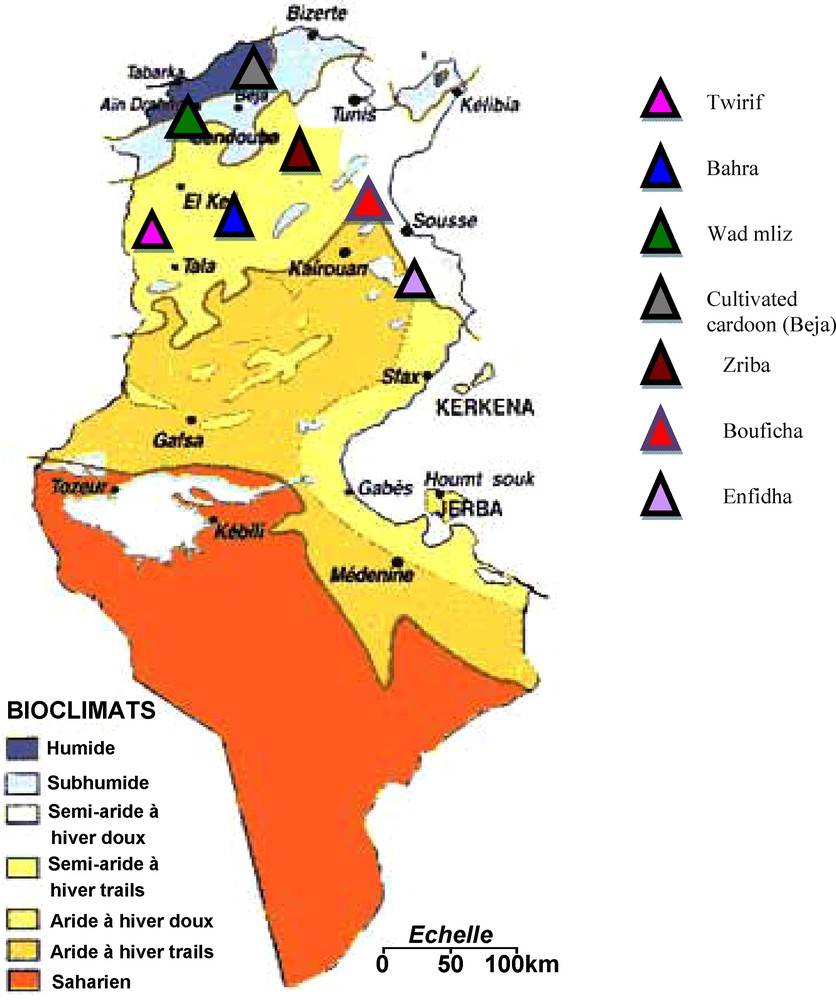
The geographical location of the studied populations of Cynara cardunculus.
2.2 DNA extraction
The basic plant material for this work consists of 0.3 g of small leaf tissue of each population of C. cardunculus L. ground in liquid nitrogen, placed in 15 mL tubes and frozen at –80 °C. The protocol used for DNA extraction is that of [1].
2.3 Amplification of microsatellites using PCR
The amplification conditions are as follow: an initial denaturation at 94 °C for 3 min followed by 33 successive cycles, each cycle consists of a succession of three phases: a denaturation phase at 94 °C for 30 s, an hybridization phase at the optimum temperature determined from 52 to 56 °C for 30 s according to the type of primer and an elongation phase at 72 °C for 45 s.
Finally, a last extension step at 72 °C for 10 min is programmed and a cooling phase at 4 °C. These cycling conditions are used as such [26]. Thus, the based optimization is made according to other parameters, which are: the concentration and the volume. The reaction volume used for each sample of 10 μL contained: 1.5 mM of MgCl2, 0.2 mM of dNTP, 70 mM of forward primer, 200 mM of reverse primer and 0.4 U of Taq 50 ng/μL DNA. All PCR reactions are performed in a thermal cycler 9700 (Applied Biosystems) and the detection of PCR products are carried out on an automated fragment analyzer CEQ 8800 (Beckman Coulter).
2.4 Amplified microsatellites loci
As part of this work, 23 microsatellites loci are used to characterize the genetic variability of C. cardunculus L. in Tunisia. These markers are chosen considering microsatellites selected in another research project [22]. The microsatellites markers used are: CyEM 138, CyEM 232, CyEM 118, CyEM 218, CyEM 291, CyEM 182, CyEM 253, CyEM 2, CyEM 42, CyEM 188, CyEM 112, CyEM 231, CyEM 109, CyEM 136, CyEM 144, CyEM 193, CyEM 210, CyEM 64, CyEM 174 and CyEM 111 [22], CELMS 14, CELMS 33 and CELMS 61 [27]. These microsatellites are amplified by PCR and its products are detected using an automated fragment analyzer CEQ 8800 (Beckman Coulter) that distinguishes the alleles of each studied locus.
2.5 Statistical analysis
The genetic diversity between the studied populations of C. cardunculus L. is analysed at two levels: intra- and interpopulation variability. The aim of this approach is to characterize, using a set of parameters, the variability between these populations and their genetic proximity. In this study, we used the Hardy–Weinberg method to test if a population is in equilibrium or no. It is based on the disparity of the observed genotypes number to the theoretical genotypes number. The analysis is performed using the software Popgene version 1.32 [28], and the dendrogram is constructed by the UPGMA approach [29] using the same software. In order to better understand the diversity between the seven studied populations, we used the software Genetix version 4.05.2 to build the AFC 3D (factor analysis of correspondence).
In order to describe the intrapopulation genetic diversity, we have calculated six parameters estimated for each locus which are: the average number of alleles locus (A), the rate of polymorphism (P), the average observed heterozygosity (HO), the average expected heterozygosity (HE), the average expected unbiased heterozygosity (Hnb) and the fixation index (FIS).
The average number of alleles per locus (A) reflects the richness of alleles in a population, it is calculated as follows: , where “a” is the number of alleles at a locus and “l” the number.
The rate of polymorphism (P) is the percentage of polymorphic loci in the studied sample. In the present study, a locus is considered polymorphic if the most common allele has a frequency less or equal to 0.95, the rate of HO represents the proportion of the observed heterozygotes at a given locus, only for codominant markers [28], while the rate of HE is the expected proportion of heterozygotes; two estimates are given: the first is the heterozygosity of Nei [30] and the second is the unbiased heterozygosity estimated using the algorithm of Levene [31].
The fixation index measures the difference between the individuals found in the state of observed heterozygosity and those found in the state of expected heterozygosity, it is also called the deviation from panmixia and is calculated as described in the following formula: F = 1 − HO/HE.
In fact, a population of diploid individuals is balanced in Hardy–Weinberg if the association of two individuals to form gametes is random with respect to gametes genotypes. Therefore, the fixation index is the deviation from the Hardy–Weinberg structure; it ranges from −1 to +1 and allows knowing the heterozygote's deficiency in a population. F is positive when the population has a deficiency of heterozygote in relation with panmictic equilibrium test and F is negative otherwise.
In addition to the intrapopulation genetic diversity, we have also studied the interpopulation genetic diversity; for this reason, we used in this study three parameters: genetic distance, F statistics of Wright and gene flow.
The genetic distance between two samples is defined as the proportion of genetic elements, which they do not share. D = 1 only if the two samples do not have a genetic elements in common.
As part of this study, the genetic distances between the pairs of populations are calculated using the classical approach based on allele frequencies in each population by retaining the distance of Nei [29], the F statistics of Wright are estimates of FIT, FIS and FST for multiple groups or populations [32]; they measure the deviation of heterozygosity relative to Hardy–Weinberg equilibrium at different levels: the FIS is the inbreeding coefficient; it measures the potential reduction of individuals’ heterozygosity inside their subpopulation, FST is called fixation index and corresponds to the reduction in subpopulations’ heterozygosity due to the differences in allele frequencies averages, while FIT is the reduction of heterozygosity between the individuals and the general theory population; in addition, the gene flow is the estimation of FST [33]; the estimation is made for groups or multiple populations.
3 Results and discussion
3.1 Intrapopulation genetic diversity
In general, the distribution of alleles, which ranged from 1 for CyEM 111 and CyEM 182 to 15 for CyEM 42, is quite similar in most cases; the most common alleles are always the same. This is the case of the allele A (which varied from 102 bp for CyEM 182 to 369 bp for CyEM 218); this allele appears often and is the most abundant in the different loci in all studied populations.
The calculated allele frequencies for each locus and each population ranged from 0.0263 for various alleles in some populations to 1 for the allele C (187 bp) of CyEM 111 and the allele L (235 bp) of CyEM 182 for cultivated cardoon. The exclusive presence of the allele frequency “1” at the allele C (187 pb) of CyEM 111 and the allele L (235 pb) of CyEM 182 is noted only for the population of cultivated cardoon and not in the other wild cardoon populations. This result shows that the cultivated cardoon is very different genetically from the wild one.
Indeed, the allelic richness of a population is defined as the allele's number present at a given locus, and depends much on the sample size, considering that the chances of discovering a new allele increases when a new individual is observed.
In this work, the average number of alleles per locus ranged from 2.73 for the cultivated cardoon to 6.93 for Wad mliz; the cultivated form of C. cardunculus present the lower number of alleles per locus than the six wild cardoon populations, this result can be explained by the fact that the wild cardoon presents more genetic variability than the cultivated one.
In addition, we have found that all loci are polymorphic to 100% at the sill of 95% in the seven studied populations. This result indicates the effectiveness of microsatellites loci used for the analysis of populations genetic diversity of C. cardunculus L.
In fact, the rate of observed and expected heterozygosity is calculated for each locus and each population under Hardy–Weinberg equilibrium. In order to estimate the importance of genetic polymorphism, we have compared these two rates of heterozygosity.
Due to the multi locus of the total population, the unbiased expected heterozygosity (0.79) is higher than the observed heterozygosity (0.57). This result reflects a positive difference between the studied populations and suggests a heterozygosity deficit in the studied populations due to the low sampling realized (14 samples for each population) (Table 1). However, HO = 0.57 was less important than other values found in other studies of island wild cardoon populations from Italy [4] which indicate that the HO values are: 0.653, 0.740, 0.795, 0.650, 0.769, 0.666 and 0.720 for Bronte, Palazzolo, Roccella, Piano Tavola, Oristano, Nuoro and Sassari, respectively.
Mean number of alleles and heterozygosity per locus in total population of Cynara cardunculus L.
| Locus | n | NA | HO | Hnb | HE |
| CyEM 138 | 96 | 23 | 0.7292 | 0.9253 | 0.9302 |
| CyEM 232 | 96 | 8 | 0.6354 | 0.8375 | 0.8418 |
| CyEM 118 | 96 | 6 | 0.5312 | 0.6648 | 0.6683 |
| CyEM 218 | 96 | 11 | 0.6875 | 0.8762 | 0.8808 |
| CyEM 291 | 96 | 8 | 0.5312 | 0.8008 | 0.8050 |
| CyEM 182 | 96 | 11 | 0.3750 | 0.8531 | 0.8576 |
| CyEM 253 | 96 | 15 | 0.7604 | 0.9030 | 0.9078 |
| CELMS 33 | 96 | 12 | 0.5729 | 0.7110 | 0.7148 |
| CyEM 2 | 96 | 6 | 0.4375 | 0.5627 | 0.5656 |
| CyEM 42 | 96 | 21 | 0.6771 | 0.9160 | 0.9208 |
| CyEM 188 | 96 | 7 | 0.4896 | 0.8123 | 0.8165 |
| CyEM 112 | 96 | 11 | 0.5208 | 0.8217 | 0.8260 |
| CyEM 231 | 96 | 7 | 0.6667 | 0.7788 | 0.7828 |
| CyEM 109 | 96 | 6 | 0.5208 | 0.7585 | 0.7624 |
| CyEM 136 | 96 | 12 | 0.5625 | 0.8177 | 0.8219 |
| CELMS 14 | 96 | 13 | 0.7500 | 0.8656 | 0.8701 |
| CyEM 144 | 96 | 6 | 0.4479 | 0.5836 | 0.5866 |
| CyEM 193 | 96 | 10 | 0.5208 | 0.6577 | 0.6612 |
| CyEM 210 | 96 | 10 | 0.5521 | 0.7683 | 0.7723 |
| CyEM 64 | 96 | 12 | 0.6979 | 0.8823 | 0.8869 |
| CyEM 174 | 96 | 7 | 0.3958 | 0.6766 | 0.6801 |
| CELMS 61 | 96 | 13 | 0.5729 | 0.8891 | 0.8937 |
| CyEM 111 | 96 | 8 | 0.5521 | 0.8264 | 0.8307 |
| Mean | 10.5652 | 0.5734 | 0.7908 | 0.7950 |
We notice that some loci are in significant gap according to the Hardy–Weinberg equilibrium; Table 2 shows the equilibrium test results calculated by the software Popgene. All loci are in disequilibrium in the studied populations of C. cardunculus with the exception of the locus CyEM 118 and CyEM 231 that verify the Hardy–Weinberg equilibrium in all individuals of the studied populations.
Hardy–Weinberg equilibrium test.
| Locus | Populations | Total | ||||||
| Bouficha | Bahra | Wad mliz | Twirif | Zriba | Enfidha | Cultivated cardoon | ||
| CyEM 138 | – | – | – | – | ** |
**
*** |
– |
**
*** |
| CyEM 232 |
**
*** |
**
*** |
– | – | – | – | – |
**
*** |
| CyEM 118 | – | – | – | – | – | – | – | – |
| CyEM 218 | – | – | – |
**
*** |
** | – | – |
**
*** |
| CyEM 291 | – |
**
*** |
– | – | – | ** | – |
**
*** |
| CyEM 182 |
**
*** |
**
*** |
– | – |
**
*** |
**
*** |
– |
**
*** |
| CyEM 253 |
**
*** |
– | – | – |
**
*** |
– |
**
*** |
**
*** |
| CELMS 33 |
**
*** |
– | – | – | – | – | – |
**
*** |
| CyEM 2 | – | – | – | – | ** | – | ** | ** |
| CyEM 42 | – | – | – |
**
*** |
**
*** |
– | – |
**
*** |
| CyEM 188 | ** | – |
**
*** |
– | – | – |
**
*** |
**
*** |
| CyEM 112 | – |
**
*** |
**
*** |
– |
**
*** |
– | – |
**
*** |
| CyEM 231 | – | – | – | – | – | – | – | – |
| CyEM 109 |
**
*** |
– | – |
**
*** |
– | – |
**
*** |
**
*** |
| CyEM 136 |
**
*** |
– | ** | – |
**
*** |
– | – |
**
*** |
| CELMS14 | – | – | – | – |
**
*** |
– | – |
**
*** |
| CyEM 144 | – | – | – | – | ** | – |
**
*** |
**
*** |
| CyEM 193 |
**
*** |
**
*** |
** | – |
**
*** |
– | – |
**
*** |
| CyEM 210 |
**
*** |
** | – | – | – | – | – |
**
*** |
| CyEM 64 | – | – | – |
**
*** |
**
*** |
– | – |
**
*** |
| CyEM 174 |
**
*** |
– | – | – | – | – | – |
**
*** |
| CELMS 61 | ** | ** | – | – |
**
*** |
**
*** |
– |
**
*** |
| CyEM 111 |
**
*** |
– | – | – | – | ** | – |
**
*** |
** : P < 0.05 (significant).
*** : P < 0.01 (highly significant).
In addition, we have also calculated the FIS (Table 3) of the studied populations which is the measure of the difference between the individuals found in the observed heterozygosity (HO) and those found in the HE. Five populations have a positive FIS more or less high; these are: Twirif, Bahra, Bouficha, Enfidha and Zriba. These positive indices reflect also a deficiency in heterozygosity which CyEM 111, CyEM 193, CyEM 232, CyEM 144, CyEM 109, CyEM 210, CyEM 182, CyEM 112, CyEM 218, CyEM 291, CyEM 188 and CyEM 136 are partially responsible because they are often higher than 0.35; the other two populations presenting a negative fixation index are the cultivated cardoon and Wad mliz. This result shows that these two populations were not significantly deviated from the Hardy–Weinberg equilibrium.
Values of the fixation index (FIS) of the studied populations.
| Populations | FIS |
| Twirif | 0.085 |
| Bahra | 0.096 |
| Wad mliz | −0.012 |
| Zriba | 0.177 |
| Bouficha | 0.147 |
| Enfidha | 0.155 |
| Cultivated cardoon | −0.066 |
In the total populations, the loci shows an important excess of homozygotes (FIS = 0.33) for CyEM 210, CyEM 2, CyEM 109, CyEM 218, CyEM 64, CyEM 138, CyEM 182 and CyEM 174 and (FIS = 0.70) for CyEM 182. The excess of observed homozygosity or heterozygosity compared with the expected homozygosity or heterozygosity according to Hardy–Weinberg hypothesis is tested for each locus and each population.
Thus, it appears that some populations relating to some loci show significant excess of homozygotes according to the Hardy–Weinberg equilibrium. Other populations have an excess in heterozygosity significantly different from the proportions of Hardy–Weinberg equilibrium and some populations have shown the panmictic equilibrium at some loci. The mean values of FIS: 0.085, 0.096, 0.147, 0.155 and 0.177 for Twirif, Bahra, Bouficha, Enfidha and Zriba, respectively, are all positive, suggesting a deficit in heterozygotes in these populations. The mean index of FIS for the overall studied populations is 0.273; this value indicates a relatively important deficit of heterozygotes.
3.2 Interpopulation genetic diversity
3.2.1 Fixation index or F statistics
The fixation indices are calculated for all loci. They ranged from −0.0078 for CELMS 33 to 0.4103 for CyEM 182 and the FIT index ranged from 0.0981 for the locus CyEM 231 to 0.5828 for CyEM 182. The mean value of FIT = 0.1062 indicates a heterozygotes deficit less important in the populations taken in isolation than in the total population (FIT = 0.2752). In fact, the values of FIT indicate an overall heterozygote deficit of 27.52% according to the seven studied populations. As for the genetic differentiation FST, it is relatively high for CyEM 182, CyEM 210 and CyEM 42. In contrast, FST shows low values for CELMS 14 and CyEM 2.
The mean differentiation between the studied populations is FST = 0.1891, which can be considered as a high value and indicates the genetic variation origin of C. cardunculus L. We recall that the total genetic diversity is the sum of intrapopulation and interpopulation genetic diversity. The value FST = 0.1891 determines that a majority (81.09%) of the total genetic variation is explained by the intrapopulation genetic diversity and 18.91% of this variability is attributed to the differences between the studied populations.
This level of genetic differentiation is similar to the levels cited in other studies of Asteraceae populations: 14.1% for the island wild cardoon populations from Italy [4] and 17.9% for the populations of Ligularia sibirica [34].
FST is calculated between the studied populations; the parameter of genetic differentiation – (FST = 0.09) between Twirif and Enfidha, (FST = 0.08) between Bouficha and Bahra, between Bouficha and Twirif, between Bahra and Twirif, between Bahra and Zriba and between Twirif and Zriba, (FST = 0.07) between Bouficha and Wad mliz, between Bahra and Enfidha, between Wad mliz and Twirif, between Wad mliz and Zriba and (FST = 0.06) between Bahra and Wad mliz, between Bouficha and Zriba, between Bouficha and Enfidha and between Wad mliz and Enfidha – reflects the lack of geographical and genetic structure between these populations that appear homogeneous. This neat reconciliation assumes an exchange of genes between these regions.
However, there is a distinction between the cultivated cardoon and the six wild cardoon populations – (FST = 0.24) between Twirif and cultivated cardoon and between Zriba and cultivated cardoon, (FST = 0.23) between Enfidha and cultivated cardoon and (FST = 0.22) between Bouficha and cultivated cardoon, between Bahra and cultivated cardoon and between Wad mliz and cultivated cardoon; this result can be explained by the differentiation of cultivated cardoon from the wild one from a molecular point of view.
3.2.2 Genetic distance and construction of dendrograms
The matrix of estimated distances between individuals of the studied populations is used for the construction of dendrograms. These distances ranged from 0.29 to 1.22 (Table 4), this result indicates a large genetic variability among the studied populations of C. cardunculus L. The null distance between two individuals suggests a similarity using the studied loci.
Genetic distances matrix between the seven studied populations as per Nei's [29].
| Populations | Bouficha | Bahra | Wad mliz | Twirif | Zriba | Enfidha | Cultivated cardoon |
| Bouficha | **** | 0.6067 | 0.6071 | 0.5981 | 0.6707 | 0.6896 | 0.3669 |
| Bahra | 0.4996 | **** | 0.6755 | 0.5995 | 0.6198 | 0.6828 | 0.4029 |
| Wad mliz | 0.4991 | 0 | **** | 0.6326 | 0.5976 | 0.6622 | 0.3629 |
| Twirif | 0.5140 | 0.5117 | 0.4579 | **** | 0.5929 | 0.5577 | 0.2981 |
| Zriba | 0.3994 | 0.4783 | 0.5149 | 0.5227 | **** | 0.6078 | 0.2928 |
| Enfidha | 0.3717 | 0.3815 | 0.4121 | 0.5840 | 0.4979 | **** | 0.3623 |
| Cultivated cardoon | 1.0028 | 0.9091 | 1.0137 | 1.2103 | 1.2284 | 1.0154 | **** |
The examination of the studied population's dendrogram (Fig. 2) distinguishes five main groups. This distribution can be explained by the existence of a large common genetic basis among the studied populations despite their geographic and phenotypic divergence.
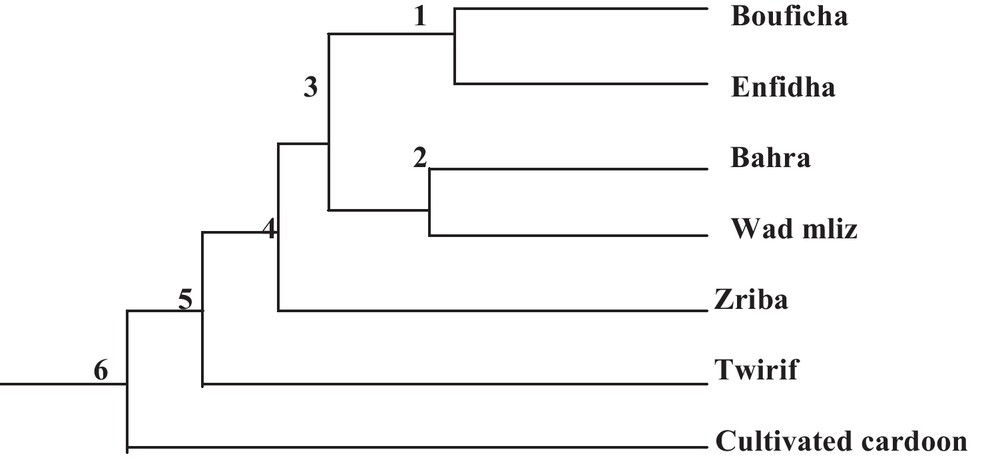
Phylogenetic relationships between the seven Cynara populations.
In order to study the genetic diversity structure between the studied populations, the distance of Nei is estimated between the pairs of populations; the genetic distances matrix (Table 4) indicates a variation from 0.29 to 1.22 between the pairs of the seven populations. These values indicate that the studied populations exhibit a significant genetic variability; in addition, we find that the genetic distance between the cultivated cardoon and the six wild cardoon populations is greater than 1 in most cases; this result shows that the cultivated cardoon is very different from the wild one from a molecular point of view.
During the examination of the dendrogram (Fig. 2), we can notice that the population's combinations are in relation with the geographical proximity. We note that the cultivated cardoon branch form an isolated group, Bouficha and Enfidha branch form another isolated group and Bahra and Wad mliz form another group, in addition, we find that the branch of Zriba and that of Twirif form an isolated group from the other studied populations. The same results were found in the AFC 3D (Factorial analysis of correspondence) of the studied populations, in this analysis, the axis 1 shows 29.74% of the total variability, the axis 2 shows 18.59% of the total variability, while the axis 3 shows 16.88% of the total variability (Fig. 3).
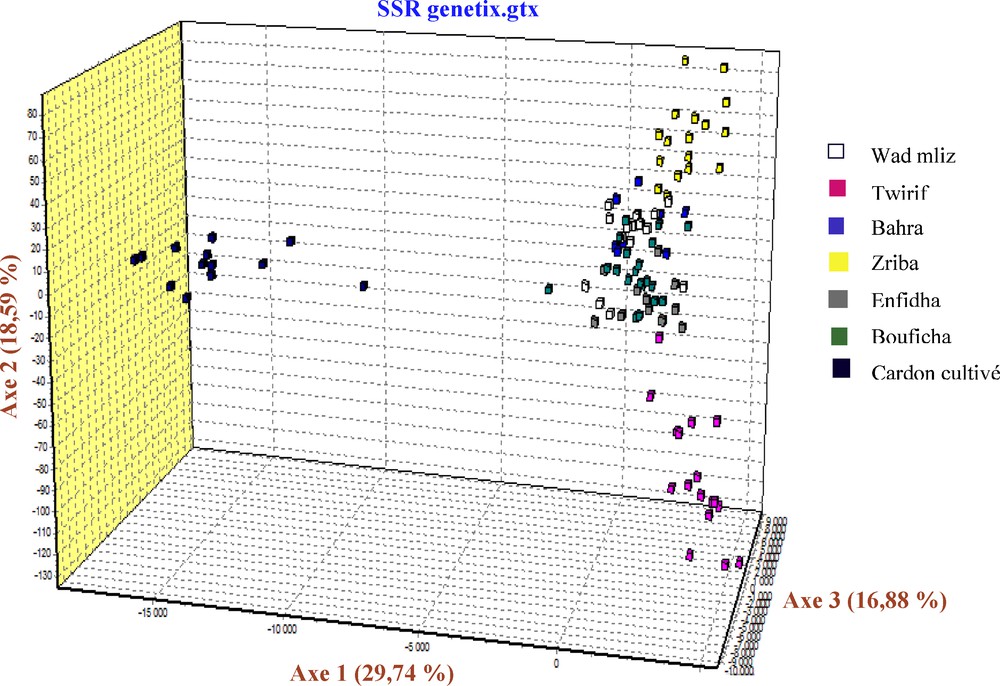
AFC 3D of the studied populations of Cynara cardunculus using Genetix version 4.05.2.
3.2.3 Gene flow
The gene flow (Nm) between the pairs of populations represents relatively significant values: (3.52) between Bouficha and Enfidha and (3.49) between Bahra and Wad mliz, whereas, the gene flow is less important in other populations: (0.87) between Bahra and cultivated cardoon and between Wad mliz and cultivated cardoon, (0.84) between Bouficha and cultivated cardoon, (0.79) between Enfidha and cultivated cardoon, (0.76) between Twirif and cultivated cardoon and (0.75) between Zriba and cultivated cardoon. Indeed, these values reflect a sizable gene exchange between the studied populations and confirm those of distance and genetic differentiation. In fact, this gene flow exists only between the six wild cardoon populations and not between the cultivated cardoon and the wild one, considering that the cultivated form of C. cardunculus is free to inter-mate with the wild one for the reason that they are collected from the fields before the flowering time (we have used only seedlings in our study). The globe artichoke is also free to inter-mate with the wild cardoon because it is propagated vegetatively in Tunisia and not by seeds.
4 Conclusion
The presented results are only a small contribution to the characterization of C. cardunculus L. They also represent a gain for the implementation of a development program of this specie in Tunisia; in addition, this work could serve as a basis for more substantial programs of genetic diversity studies of different C. cardunculus L. populations in Tunisia. In general, this study allowed demonstrating a high genetic diversity level in C. cardunculus L. in Tunisia, mainly intrapopulation diversity (81.09%). The differentiation indices show that the studied populations share a large genetic basis despite the emergence of differences according to the region; in addition, our results show that the cultivated cardoon is very different from the wild one from a molecular point of view. Indeed, the populations of C. cardunculus L. seems threatened by the lack of management and conservation. So, the maintenance of an existing genetic variation within the specie is an important step in the plant genetic resources conservation. Finally, the kind of intervention which could be adopted to fight against genetic erosion of the Tunisian C. cardunculus L. germplasm is to select among Tunisian local populations of this specie the promising genotypes, their evaluation under different culture conditions and collection of cardoon seeds and their conservation in the Tunisian gene bank.
Disclosure of interest
The authors declare that they have no conflicts of interest concerning this article.