

1 Introduction
The domestic grape represents one of the oldest crops in the world [1], with remarkable importance both from a cultural and economic point of view due to its transformation into wine [2–4]. According to the data published by FAO [5], currently 71% of world grape production is used for wine making, 27% as fresh fruit and 2% as dried fruit.
Such a product was once widespread only among the Mediterranean populations, while today it is a popular asset commonly traded in the global market [2,3].
Nevertheless, about 10,000 cultivars have been recorded among Vitis vinifera L.; substantial information has been gained by molecular studies regarding more than 5000 varieties, highlighting wrong nomenclatural attributions due to synonymy and/or homonymy cases for many cultivars [3].
Sardinia, with a dimension of 24,089 km2, is the second largest island in the Mediterranean Sea and represents an interesting laboratory, from biological, historical and cultural perspectives, where one can address studies on the characterization of the huge wine-producing heritance, currently attested on 151 cultivars [6].
Insular condition of Sardinia and the large population of wild grapevine coenoses distributed in the whole island [7] allowed the local populations to develop independent domestication processes. Similar phenomena have also been recorded in other regions of the Mediterranean basin, providing considerable support on the polycentric origin theory of the grape [8–10].
Unequivocal evidence that Sardinia is a secondary domestication area has been found in the countryside around Nuoro [11]. By molecular studies, these authors, emphasized how the genetic heritance of two autochthonous cultivars (Bovale Muristellu and Bovale Murru) is close to the wild grapevine found in the same locality [11].
The great amount of cultivars, analysed as local varieties, is not only the product of the direct domestication process of wild grapevine, but it is also the result of crosses among local varieties and plants of spontaneous flora, as well as of the introduction of farming techniques and the importation of cultivars by different foreign populations who landed on the island [12].
Grapevine seeds are highly polymorphic and have a fundamental role in the taxonomic study within the genus Vitis L. [13], in the distribution and domestication processes of the wild grapevine, in many archaeological discoveries [3], and in the study about the identification and grouping of diasporas of Vitis.
In recent years, many studies have been directed towards the identification and grouping of diasporas of Vitis on the basis of biometric features or morphometric analysis of the biometric parameters. Using an electronic calibre, Rivera et al. [13] measured 11 morphometric variables on 142 different types of grape: five taxa of Vitis, 92 cultivars of V. vinifera, 12 feral/wild populations and four hybrids rootstock cultivars. The obtained data were elaborated using a cluster analysis, placing feral/wild populations and related cultivars in their respective clusters, but missing a cluster of wild European grapevine. Applying the Elliptic Fourier Descriptors (EFDs) method, Terral et al. [14] compared well-preserved archaeological seeds, found in the southern France and dated back to the I B.C., with same European modern cultivars and wild individuals. Also Gong et al. [15] used digital images to analyze the morphometry of same fossil of Vitis seeds, dug up from the Gray Fossil Site (N-E Tennessee, USA) and dated to latest Miocene-earliest Pliocene, placing them in three different morphotaxa on the basis of 11 measured characters. Orrù et al. [16], through the Linear Discriminant Analysis (LDA) of the biometric parameters between the tree groups, proved the highest similarity of the archaeological seeds to the species of the V. vinifera, and in particular to the white berry cultivars rather than with the black berry cultivars. According to the authors, these findings suggest that the V. vinifera was probably already used to produce wine and/or to preserve foodstuffs as grape, also supporting the traditional production of white grapes in particular Sardinian areas.
Based on a previous work carried out by De Mattia et al. [12], whose aim was to genotype various Sardinian autochthonous cultivars using 13 Simple Sequence Repeat (SSR) markers, the goal of this article is to propose the characterization of the same varieties on the basis of morpho-colorimetric features and EFDs of the seed lots, measured by image analysis. In particular, the aims of this study are:
- • to generate a database of seed morphological parameters and EFDs to characterize some of V. vinifera varieties studied by De Mattia et al. [12];
- • to implement, on the basis of the developed database, a statistical classifier able to compare the analysed varieties;
- • to carry out hypothetical synonymy groups;
- • to compare the achieved groupings with those proposed by De Mattia et al. [12] using SSR markers.
This work represents the first tentative to validate a morphometric characterization method by direct comparison with molecular data.
2 Materials and methods
2.1 Seed material
The seeds of 18 black berry and 22 white berry Sardinian cultivars, among the 61 studied by De Mattia et al. [12], native of the whole Sardinian region, but grown in the Agris germplasm collections (Agenzia per la Ricerca in Agricoltura della Regione Sardegna) of Ussana (Sardinia, Italy), were collected during the harvest years 2008–2009 and 2009–2010, for a total of 40 seed accessions of grapevine (Table 1 and Fig. 1). Grapes have been collected at the time of maximum concentration of sugar in the pulp (ripeness) corresponding to the complete morphologic and chromatic seed development. For each cultivar, 10 bunches were collected from 10 different individuals and from the central part of each bunch, a variable number of berries (from 10 to 30), depending on bunch and barriers morphologic characteristics, were collected. Undeveloped seeds (stenospermocarpic) have been not considered [17].
Name code, grape variety name, colour (B: black; W: white), distribution and number of seeds of V. vinifera L. studied cultivars.
| Name code | Grape variety | Grape colour | Distribution | Amount of analysed seeds |
| ArB | Aregu Biancu | W | Barbagia di Seùlo | 600 |
| ArG | Aregu Giallo | W | Barbagia di Seùlo | 598 |
| ArM | Argu Mannu | W | Sardinia | 1192 |
| Cn | Cannonau | B | Barbagia di Seùlo, Ollolai e Belvì | 1776 |
| CnO | Cannonau Bianco di Oliena | W | Barbagia di Ollolai | 603 |
| CnT | Cannonau Bianco di Trieri | W | Ogliastra | 1200 |
| Cl | Culupuntu | W | Ogliastra | 601 |
| FlG | Falso Gregu | B | Campidano di Cagliari | 595 |
| GB | Gregu Bianco | W | Campidano di Cagliari e Oristano | 1049 |
| GNC | Gregu Nieddu del Campidano | B | Campidano di Cagliari e Oristano | 1199 |
| GNS | Gregu Nieddu di Serramanna | B | Campidano di Cagliari | 598 |
| Mz | Manzesu | B | Campidano di Cagliari | 2098 |
| ME | Monica di Escalaplano | B | Sarrabus e Gerrei | 600 |
| MSl | Monica di Seulo | B | Barbagia di Seùlo | 596 |
| MSr | Monica di Sorgono | B | Mandrolisai | 600 |
| MLd | Moscato di Lodine | W | Barbagia di Ollolai | 596 |
| MPt | Moscato di Pattada | W | Monteacuto | 600 |
| MT1 | Moscato di Tempio 1 | W | Gallura | 597 |
| MT2 | Moscato di Tempio 2 | W | Gallura | 600 |
| MSP | Moscato Su Pinu | W | Barbagia di Ollolai | 600 |
| NrT | Nera Tomentosa | B | Planargia | 599 |
| NrB | Nera di Bosa | B | Planargia | 600 |
| NPd | Nieddu Mannu di Padria | B | Meilogu | 596 |
| NPt | Nieddu Mannu di Pattada | B | Monteacuto | 595 |
| NPS | Nieddu Pedra Serra | B | Campidano di Sanluri | 599 |
| NPl | Nieddu Polchino | B | Monteacuto | 596 |
| Nr | Nuragus | W | Campidano di Cagliari | 888 |
| NrA | Nuragus Arrubiu | W | Campidano di Cagliari | 598 |
| Nrd | Nuragus Muscadeddu | W | Sarrabus e Gerrei | 600 |
| Nrt | Nuragus Moscatello | W | Sarcidano | 600 |
| NRR | Nuragus Rosso Rompizzolla | W | Campidano di Cagliari | 599 |
| PsC | Pascale di Caglairi | B | Campidano di Cagliari | 1766 |
| PsO | Pascale di Oliena | B | Barbagia di Ollolai | 599 |
| PrN | Primidivu Nieddu | B | Meilogu | 596 |
| Sn | Sinnidanu | W | Baronie | 1193 |
| Vr | Vernaccia | W | Campidano | 1193 |
| VrE | Vernaccia di Escalaplano | W | Sarrabus e Gerrei | 608 |
| VrR | Vernaccia di S. Rosalia | W | Ogliastra | 597 |
| VrS | Vernaccia di Solarussa | W | Campidano di Oristano | 1049 |
| Vrt | Vertudi | B | Sulcis | 1200 |
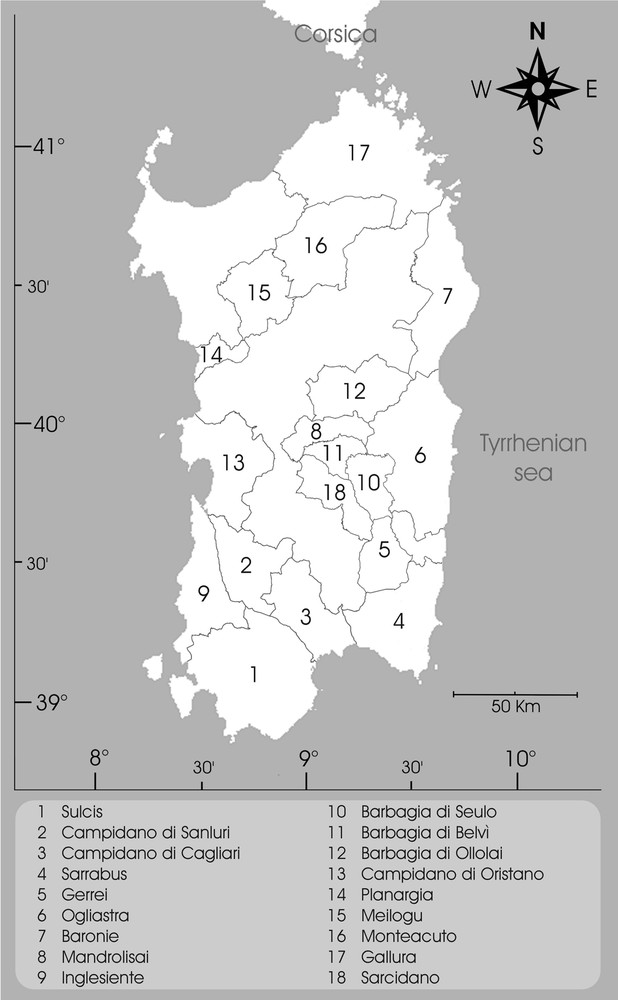
Sardinian historical distribution regions of V. vinifera L. studied cultivars.
2.2 Seed analysis
Digital images of seed samples were acquired using a flatbed scanner (Epson GT-15000) with a digital resolution of 400 dpi and a scanning area not exceeding 1024 × 1024 pixel. Image acquisition was performed before drying the seeds at 15 °C to 15% of R.H. to avoid spurious variation in dimension, shape and colour. Moreover, before image acquisition, the scanner was calibrated for colour matching, following the protocol of Shahin and Symons [18], as suggested by Venora et al. [19].
Samples, consisting of 100 seeds, were captured and used for the digital image analysis. In order to represent the whole variability of each accession, all the available seeds were captured and the seed samples were acquired three times, randomly disposing them on the flatbed tray. A total of 32,569 statistical cases was analysed.
Digital images of seeds were processed and analysed using the software package KS-400V. 3.0 (Carl Zeiss, Vision, Oberkochen, Germany). A macro specifically developed for the characterization of wild seeds [20] and later modified to measure further twenty morpho-colorimetric seed features [21], was adapted to perform automatically all the analysis procedures, reducing the execution time and contextual mistakes in the analysis process [22].
Moreover, the binary images obtained by the segmentation process during the image processing of the seeds, were used to apply the EFDs method, to increase the number of discriminant parameters [23,24] (Table 2). As described by Orrù et al. [16], this method allows one to describe the boundary of the seed projection, as an array of complex numbers which correspond to the pixels position of the seed boundary. According to Terral et al.’s findings [14] about the use of a number of harmonics for an optimal description of seed outlines, in order to minimize the measurement errors and optimize the efficiency of shape reconstruction, 20 harmonics were used to define the seed boundaries, obtaining further 80 parameters useful to discriminate among the studied cultivars of Vitis.
List of morpho-colorimetric features measured on seeds, excluding the 80 Elliptic Fourier Descriptors (EFDs).
| Feature | Description | |
| A | Area | Seed area (mm2) |
| P | Perimeter | Seed perimeter (mm) |
| P conv | Convex Perimeter | Convex perimeter of the seed (mm) |
| P Crof | Crofton's Perimeter | Perimeter of the seed calculated using the Crofton's formula (mm) |
| P conv /P Crof | Perimeter ratio | Ratio between convex and Crofton's perimeters |
| D max | Max diameter | Maximum diameter of the seed (mm) |
| D min | Min diameter | Minimum diameter of the seed (mm) |
| D min /D max | Feret ratio | Ratio between minimum and maximum diameters |
| Sf | Shape Factor | Seed shape descriptor = (4 × π × area)/perimeter2 (normalized value) |
| Rf | Roundness Factor | Seed roundness descriptor = (4 × area)/(π × max diameter2) (normalized value) |
| Ecd | Eq. circular diameter | Diameter of a circle with an area equivalent to that of the seed (mm) |
| EA max | Maximum ellipse axis | Maximum axis of an ellipse with equivalent area (mm) |
| EA min | Minimum ellipse axis | Minimum axis of an ellipse with equivalent area (mm) |
| R mean | Mean red channel | Red channel mean value of seed pixels (grey levels) |
| R sd | Red std. deviation | Red channel standard deviation of seed pixels |
| G mean | Mean green channel | Green channel mean value of seed pixels (grey levels) |
| G sd | Green std. deviation | Green channel standard deviation of seed pixels |
| B mean | Mean blue channel | Blue channel mean value of seed pixels (grey levels) |
| B sd | Blue std. deviation | Blue channel standard deviation of seed pixels |
| H mean | Mean hue channel | Hue channel mean value of seed pixels (grey levels) |
| H sd | Hue std. deviation | Hue channel standard deviation of seed pixels |
| L mean | Mean lightness channel | Lightness channel mean value of seed pixels (grey levels) |
| L sd | Lightness std. deviation | Lightness channel standard deviation of seed pixels |
| S mean | Mean saturation channel | Saturation channel mean value of seed pixels (grey levels) |
| S sd | Saturation std. deviation | Saturation channel standard deviation of seed pixels |
| D mean | Mean density | Density channel mean value of seed pixels (grey levels) |
| D sd | Density std. deviation | Density channel standard deviation of seed pixels |
| S | Skewness | Asymmetry degree of intensity values distribution (grey levels) |
| K | Kurtosis | Peakness degree of intensity values distribution (densitometric units) |
| H | Energy | Measure of the increasing intensity power (densitometric units) |
| E | Entropy | Dispersion power (bit) |
| D sum | Density sum | Sum of density values of the seed pixels (grey levels) |
| SqD sum | Square density sum | Sum of the squares of density values (grey levels) |
2.3 Statistical analysis
The acquired data were used to assemble a database of morpho-colorimetric and EFDs data. Using the SPSS software package release 15 (SPSS Inc. 1989–2006), data were statistically elaborated applying the stepwise LDA method, in order to compare the investigated cultivars. This approach is commonly used to classify/identify unknown groups characterized by quantitative and qualitative variables [25,26], finding the combination of predictor variables with the aim of minimizing the within-class distance and maximizing the between-class distance simultaneously, thus achieving maximum class discrimination [27,28]. On the basis of all measured features, the stepwise method identifies and selects the most statistically significant among them to use for the seed sample identification. This method starts with a model that does not include any of the variables, adding step by step one more, until no remaining variables are able to increase the discrimination ability, stopping the process [29,30].
Finally, a cross-validation procedure was applied to verify the performance of the identification system, testing individual unknown cases and classifying them on the basis of all others [31].
Due to the large number of data, the discriminatory steps were executed distinguishing between black and white berry cultivars, except a preliminary statistical comparison on the basis of the synonymy groups proposed by De Mattia et al. [12].
3 Results and discussion
Using the same approach that has been many times applied to solve cases of homonymy and synonymy on the basis of molecular markers, morpho-colorimetric features were used to identify hypothetic grapevine cultivar synonymy groups. A total of 113 morpho-colorimetric features was used to characterize the germplasm of the 40 studied Sardinian grapevine cultivars (Table 2).
In order to compare the results of genetic analysis achieved by De Mattia et al. [12] on Sardinian grapevine cultivars with the relative seed phenotypic expression, a preliminary morpho-colorimetric comparison among 40 of the 61 cultivars tested by De Mattia et al. [12] was executed on the basis of the 13 synonymy groups proposed by De Mattia et al. [12]. Table 3 shows the results of this preliminary comparison. Although the overall discrimination performance only reached 59.7%, because of the non-inclusion in any group of the 15 cultivars proposed by De Mattia et al. [12], the percentages of correct identification of each group show a certain correspondence to the phenotypic seed characters (Table 3), simultaneously suggesting some potential modifications to the proposed groupings.
Preliminary comparisons among the analysed cultivars, on the basis of the 13 synonymy groups proposed by De Mattia et al. [12]. In parentheses the number of seeds.
| G1 | G2 | G3 | G4 | G5 | G6 | G7 | G8 | G9 | G11 | Nr | NrA | VrE | |
| G1 | 81.9 (4379) |
2.2 (116) |
0.8 (44) |
0.6 (31) |
0.1 (4) |
0.3 (14) |
2.5 (132) |
1.2 (64) |
0.3 (15) |
0.5 (26) |
0.8 (44) |
0.2 (10) |
- |
| G2 | 8.8 (290) |
53.4 (1759) |
4.6 (151) |
1.9 (61) |
7.8 (257) |
0.3 (9) |
0.4 (14) |
3.8 (126) |
- | 0.1 (2) |
0.9 (30) |
1.1 (36) |
1.5 (51) |
| G3 | 14.6 (175) |
20.2 (242) |
43.1 (515) |
1.2 (14) |
3.3 (39) |
1.1 (13) |
2.1 (25) |
1.6 (19) |
- | - | 0.1 (1) |
0.6 (7) |
0.5 (6) |
| G4 | 4.0 (72) |
2.4 (43) |
0.4 (8) |
69.5 (1250) |
0.7 (12) |
1.6 (29) |
0.7 (12) |
0.3 (5) |
1.3 (23) |
0.7 (13) |
3.8 (68) |
2.7 (48) |
0.3 (6) |
| G5 | 0.4 (10) |
4.8 (114) |
2.2 (52) |
0.3 (7) |
76.9 (1839) |
0.5 (13) |
0.1 (3) |
0.0 (1) |
- | - | 0.3 (6) |
0.2 (5) |
9.4 (225) |
| G6 | 0.5 (8) |
1.4 (24) |
1.4 (24) |
1.9 (34) |
1.8 (32) |
69.0 (1226) |
7.4 (132) |
- | 2.0 (36) |
0.9 (16) |
1.0 (18) |
0.2 (4) |
0.1 (2) |
| G7 | 13.5 (243) |
1.3 (24) |
1.4 (26) |
0.1 (1) |
0.3 (5) |
4.0 (72) |
62.2 (1121) |
- | 3.1 (55) |
0.2 (4) |
0.1 (1) |
0.1 (2) |
- |
| G8 | 7.9 (95) |
4.4 (53) |
0.3 (4) |
0.1 (1) |
- | 0.2 (2) |
0.1 (1) |
80.4 (962) |
0.1 (1) |
0.5 (6) |
- | - | - |
| G9 | 7.2 (43) |
- | 0.2 (1) |
1.2 (7) |
- | 1.7 (10) |
3.2 (19) |
0.2 (1) |
45.6 (272) |
15.2 (91) |
- | - | - |
| G11 | 5.2 (31) |
0.3 (2) |
0.2 (1) |
3.9 (23) |
- | 1.5 (9) |
0.8 (5) |
1.7 (10) |
11.1 (66) |
48.5 (289) |
- | - | - |
| Nr | 4.1 (36) |
5.2 (46) |
1.6 (14) |
27.9 (248) |
1.7 (15) |
1.9 (17) |
0.5 (4) |
0.9 (8) |
0.9 (8) |
2.4 (21) |
35.2 (313) |
1.2 (11) |
0.2 (2) |
| NrA | 7.0 (42) |
4.7 (28) |
2.3 (14) |
48.3 (289) |
2.7 (16) |
1.0 (6) |
0.8 (5) |
0.3 (2) |
1.0 (6) |
- | 6.0 (36) |
12.2 (73) |
0.2 (1) |
| VrE | - | 3.9 (24) |
0.5 (3) |
1.5 (9) |
36.0 (219) |
0.5 (3) |
- | - | - | - | - | 0.2 (1) |
56.1 (341) |
| Sn | 3.5 (42) |
0.9 (11) |
1.1 (13) |
- | 0.3 (3) |
5.2 (62) |
18.0 (215) |
0.6 (7) |
0.9 (11) |
0.7 (8) |
0.6 (7) |
- | - |
| VrS | 11.3 (119) |
5.0 (52) |
1.8 (19) |
3.1 (33) |
1.0 (10) |
2.3 (24) |
5.8 (61) |
0.5 (5) |
0.6 (6) |
0.3 (3) |
0.3 (3) |
0.8 (8) |
0.3 (3) |
| Cl | 0.5 (3) |
0.5 (3) |
0.2 (1) |
7.0 (42) |
1.5 (9) |
1.8 (11) |
2.3 (14) |
0.2 (1) |
1.3 (8) |
- | - | 0.2 (1) |
0.3 (2) |
| MPt | 2.8 (17) |
3.2 (19) |
5.2 (31) |
6.5 (39) |
3.2 (19) |
2.3 (14) |
7.7 (46) |
0.3 (2) |
0.5 (3) |
0.5 (3) |
0.5 (3) |
0.7 (4) |
- |
| MT2 | 2.7 (16) |
0.2 (1) |
2.8 (17) |
5.2 (31) |
2.5 (15) |
1.2 (7) |
2.3 (14) |
- | 1.8 (11) |
0.3 (2) |
0.2 (1) |
0.2 (1) |
0.2 (1) |
| MSP | 2.0 (12) |
0.3 (2) |
0.2 (1) |
6.5 (39) |
- | 0.7 (4) |
2.7 (16) |
- | 12.0 (72) |
24.7 (148) |
- | 0.7 (4) |
- |
| GB | 13.1 (137) |
20.1 (211) |
1.1 (12) |
4.8 (50) |
5.2 (55) |
1.0 (10) |
0.4 (4) |
0.1 (1) |
- | 0.1 (1) |
2.6 (27) |
0.5 (5) |
1.0 (10) |
| ArG | 8.5 (51) |
0.8 (5) |
0.2 (1) |
0.2 (1) |
- | - | 0.2 (1) |
5.5 (33) |
- | - | - | - | - |
| ArM | 18.0 (214) |
6.3 (75) |
- | 0.2 (2) |
0.3 (3) |
0.3 (4) |
0.2 (2) |
8.6 (102) |
- | - | 0.3 (3) |
- | - |
| GNC | 7.7 (92) |
3.8 (45) |
1.5 (18) |
0.5 (6) |
1.3 (16) |
2.4 (29) |
2.9 (35) |
0.6 (7) |
1.8 (21) |
0.5 (6) |
0.1 (1) |
0.3 (3) |
- |
| GNS | 8.2 (98) |
7.6 (91) |
4.2 (50) |
1.3 (15) |
0.8 (9) |
2.8 (34) |
1.9 (23) |
1.3 (15) |
0.2 (2) |
1.3 (15) |
0.9 (11) |
0.3 (3) |
- |
| Vrt | 8.4 (50) |
6.2 (37) |
6.2 (37) |
0.2 (1) |
0.7 (4) |
1.0 (6) |
7.7 (46) |
4.5 (27) |
1.8 (11) |
2.5 (15) |
- | 0.2 (1) |
- |
| Overall | |||||||||||||
| Sn | VrS | Cl | MPt | MT2 | MSP | GB | ArG | ArM | GNC | GNS | Vrt | Total | |
| G1 | 0.7 (39) |
1.3 (70) |
0.02 (1) |
0.2 (12) |
0.3 (14) |
0.04 (2) |
1.3 (67) |
0.7 (36) |
1.7 (93) |
0.6 (29) |
1.4 (74) |
0.6 (31) |
100 (5349) |
| G2 | 0.9 (29) |
1.2 (39) |
0.1 (4) |
0.5 (15) |
0.5 (16) |
- | 2.6 (85) |
0.2 (7) |
3.8 (124) |
1.2 (40) |
4.1 (136) |
0.4 (13) |
100 (3294) |
| G3 | 1.2 (14) |
0.3 (4) |
0.0 (0) |
0.8 (10) |
1.7 (20) |
0.2 (1) |
0.2 (2) |
0.1 (1) |
0.2 (2) |
3.1 (37) |
2.4 (29) |
1.7 (20) |
100 (1196) |
| G4 | 0.9 (16) |
0.9 (17) |
1.0 (18) |
0.8 (15) |
1.2 (22) |
1.9 (35) |
1.2 (21) |
0.2 (4) |
- | 1.3 (23) |
1.7 (31) |
0.4 (8) |
100 (1799) |
| G5 | 0.1 (2) |
0.5 (13) |
0.8 (18) |
0.8 (19) |
0.5 (11) |
- | 1.0 (25) |
0.0 (1) |
0.1 (3) |
0.2 (4) |
0.5 (13) |
0.3 (6) |
100 (2390) |
| G6 | 1.8 (32) |
1.4 (24) |
0.8 (14) |
1.2 (22) |
0.8 (14) |
1.0 (18) |
- | - | 0.1 (2) |
3.3 (58) |
1.8 (32) |
0.2 (4) |
100 (1766) |
| G7 | 5.6 (101) |
2.2 (39) |
0.2 (4) |
0.6 (10) |
0.8 (15) |
1.6 (29) |
- | 0.1 (1) |
- | 1.8 (33) |
0.3 (6) |
0.6 (11) |
100 (1803) |
| G8 | 0.3 (3) |
1.2 (14) |
- | 0.4 (5) |
- | - | - | 1.4 (17) |
1.5 (18) |
- | 0.3 (4) |
0.8 (10) |
100 (1196) |
| G9 | - | - | 0.7 (4) |
0.5 (3) |
2.5 (12) |
19.1 (114) |
- | - | - | 1.3 (8) |
0.7 (4) |
1.3 (8) |
100 (597) |
| G11 | 0.2 (1) |
- | - | 0.2 (1) |
0.2 (1) |
23.2 (138) |
- | - | - | 1.0 (6) |
0.5 (3) |
1.7 (10) |
100 (596) |
| Nr | 1.8 (16) |
0.1 (1) |
0.6 (5) |
0.8 (7) |
0.7 (6) |
4.6 (41) |
4.6 (41) |
0.6 (5) |
1.0 (9) |
0.6 (5) |
1.0 (9) |
- | 100 (888) |
| NrA | 0.7 (4) |
2.3 (14) |
0.3 (2) |
1.7 (10) |
2.3 (14) |
1.5 (9) |
0.7 (4) |
0.3 (2) |
0.2 (1) |
1.0 (6) |
2.0 (12) |
0.3 (2) |
100 (598) |
| VrE | - | 0.2 (1) |
0.5 (3) |
- | - | - | 0.3 (2) |
- | - | 0.3 (2) |
- | - | 100 (608) |
| Sn | 51.7 (617) |
0.5 (6) |
0.1 (1) |
0.2 (2) |
0.2 (2) |
0.4 (5) |
- | 1.6 (19) |
1.3 (16) |
7.6 (91) |
3.2 (38) |
1.4 (17) |
100 (1193) |
| VrS | 1.0 (10) |
53.3 (559) |
0.4 (4) |
0.7 (7) |
0.3 (3) |
- | 1.5 (16) |
0.4 (4) |
2.4 (25) |
2.5 (26) |
2.9 (30) |
1.8 (19) |
100 (595) |
| Cl | 0.2 (1) |
0.7 (4) |
57.1 (343) |
13.6 (82) |
12.1 (73) |
- | 0.2 (1) |
- | - | - | 0.2 (1) |
0.2 (1) |
100 (601) |
| MPt | 0.5 (3) |
1.5 (9) |
10.8 (65) |
33.5 (201) |
13.5 (81) |
- | 0.2 (1) |
0.3 (2) |
- | 1.2 (7) |
3.0 (18) |
2.2 (13) |
100 (600) |
| MT2 | - | - | 5.0 (30) |
11.5 (69) |
61.3 (368) |
0.8 (5) |
0.2 (1) |
- | - | 0.3 (2) |
0.3 (2) |
1.0 (6) |
100 (600) |
| MSP | 0.2 (1) |
- | 0.5 (3) |
0.7 (4) |
0.2 (1) |
47.8 (287) |
- | 0.2 (1) |
- | 0.3 (2) |
0.3 (2) |
0.2 (1) |
100 (600) |
| GB | 0.5 (5) |
1.1 (12) |
0.3 (3) |
0.1 (1) |
0.1 (1) |
0.2 (2) |
39.0 (409) |
- | 2.2 (23) |
0.8 (8) |
5.8 (61) |
0.1 (1) |
100 (1049) |
| ArG | 0.5 (3) |
2.2 (13) |
- | 0.3 (2) |
- | 0.3 (2) |
- | 76.9 (460) |
4.0 (24) |
- | 0.2 (1) |
0.2 (1) |
100 (598) |
| ArM | 1.9 (23) |
1.2 (14) |
- | - | - | - | 1.1 (13) |
6.6 (79) |
53.8 (641) |
0.9 (11) |
0.3 (4) |
0.2 (2) |
100 (1192) |
| GNC | 4.2 (50) |
4.2 (50) |
0.6 (7) |
0.6 (7) |
0.5 (6) |
0.7 (8) |
1.2 (14) |
0.2 (2) |
0.7 (8) |
43.4 (520) |
11.3 (135) |
9.4 (113) |
100 (1199) |
| GNS | 4.3 (51) |
1.4 (17) |
0.1 (1) |
0.7 (8) |
0.8 (9) |
0.3 (4) |
0.4 (5) |
0.1 (1) |
0.3 (4) |
7.3 (87) |
44.7 (536) |
9.3 (111) |
100 (1200) |
| Vrt | 2.3 (14) |
2.0 (12) |
- | 1.3 (8) |
0.5 (3) |
0.7 (4) |
0.7 (4) |
- | - | 7.9 (47) |
18.1 (108) |
27.3 (163) |
100 (598) |
| Overall | 59.7 (32,569) |
From two separate comparisons among black and white berry cultivars (Tables 4 and 5), only considering the varietal name as grouping variable and excluding the synonymy group notations of De Mattia et al. [12], evaluating the percentages of correct identification and above all the mistakes made by the classification system, it was possible to identify new hypothetical synonymy groups. Tables 4 and 5 show the results of the comparisons among the analysed black berry and white berry cultivars, respectively. In the first case, an overall percentage of correct discrimination of 58.8% was reached, while white berry cultivars were correctly identified in the 60.1% of the cases. Figs. 2 and 3 show the graphical representations of the achieved groupings from the morpho-colorimetric comparisons among the black berry and white berry cultivars, respectively. Although the 3D plots were drawn using only three of the about 20 discriminant functions implemented to distinguish the varieties in both the cases, these graphical representations well-highlight the phenotypical differences among the membership groups, organizing little clearly identifiable groups. The three discriminant functions used to draw the plots were able to explain the 66.3% and the 70.7% of the whole statistical variability for the black berry and white berry cultivars comparisons, respectively (data not shown).
Statistical comparisons among the analysed black berry cultivars, on the basis of the morpho-colorimetical features. In parentheses the number of seeds.
| Cn | FlG | GNC | Mz | NrB | PsC | Vrt | GNS | ME | ||
| Cn | 84.3 (1498) |
0.2 (4) |
4.4 (78) |
3.5 (62) |
- | - | 2.5 (44) |
1.8 (32) |
0.2 (4) |
|
| FlG | 0.8 (5) |
42.0 (250) |
0.2 (1) |
5.2 (31) |
2.7 (16) |
18.0 (107) |
0.5 (3) |
0.5 (3) |
0.2 (1) |
|
| GNC | 3.6 (43) |
0.7 (8) |
54.8 (657) |
9.3 (111) |
0.5 (6) |
3.4 (41) |
12.8 (153) |
9.4 (113) |
- | |
| Mz | 0.6 (12) |
1.4 (30) |
0.9 (18) |
71.7 (1504) |
2.3 (48) |
3.1 (64) |
6.0 (126) |
0.6 (12) |
0.5 (10) |
|
| NrB | 0.5 (3) |
1.5 (9) |
- | 0.2 (1) |
65.5 (393) |
0.7 (4) |
0.8 (5) |
1.2 (7) |
5.5 (33) |
|
| PsC | 0.3 (6) |
6.3 (112) |
1.7 (30) |
5.7 (100) |
0.2 (4) |
60.6 (1070) |
2.9 (52) |
0.7 (12) |
0.8 (14) |
|
| Vrt | 2.8 (34) |
0.2 (2) |
9.3 (112) |
11.7 (140) |
1.3 (16) |
1.8 (22) |
55.2 (662) |
11.5 (138) |
- | |
| GNS | 2.0 (12) |
0.5 (3) |
11.5 (69) |
6.7 (40) |
2.8 (17) |
1.7 (10) |
27.1 (162) |
38.1 (228) |
- | |
| ME | - | - | - | 1.8 (11) |
1.8 (11) |
5.3 (32) |
0.2 (1) |
- | 79.8 (479) |
|
| MSl | - | 5.2 (31) |
1.0 (6) |
9.2 (55) |
1.0 (6) |
5.7 (34) |
2.2 (13) |
0.7 (4) |
7.6 (45) |
|
| MSr | 1.2 (7) |
1.0 (6) |
0.2 (1) |
13.7 (82) |
1.0 (6) |
0.2 (1) |
5.0 (30) |
3.7 (22) |
3.3 (20) |
|
| NrT | 1.2 (7) |
4.3 (26) |
0.5 (3) |
1.2 (7) |
0.8 (5) |
26.5 (159) |
0.2 (1) |
2.8 (17) |
- | |
| NPS | 0.2 (1) |
11.5 (69) |
- | 2.5 (15) |
0.7 (4) |
19.5 (117) |
1.0 (6) |
0.5 (3) |
- | |
| NPd | 1.2 (7) |
1.7 (10) |
4.0 (24) |
19.3 (115) |
0.3 (2) |
1.8 (11) |
5.9 (35) |
1.2 (7) |
- | |
| NPt | 1.0 (6) |
5.2 (31) |
- | 1.8 (11) |
- | 10.9 (65) |
3.5 (21) |
2.2 (13) |
0.2 (1) |
|
| NPl | - | 5.0 (30) |
- | 0.8 (5) |
22.0 (131) |
1.0 (6) |
- | 1.3 (8) |
1.5 (9) |
|
| PsO | 0.7 (4) |
8.5 (51) |
- | 2.5 (15) |
0.5 (3) |
23.0 (138) |
1.5 (9) |
1.3 (8) |
0.2 (1) |
|
| PrN | 0.5 (3) |
7.0 (42) |
1.8 (11) |
0.5 (3) |
0.2 (1) |
10.6 (63) |
1.3 (8) |
2.3 (14) |
- | |
| Overall | ||||||||||
| MSl | MSr | NrT | NPS | NPd | NPt | NPl | PsO | PrN | Total | |
| Cn | 0.1 (2) |
0.8 (14) |
- | - | 1.0 (18) |
0.3 (6) |
0.1 (2) |
- | 0.7 (12) |
100.0 (1776) |
| FlG | 1.3 (8) |
1.8 (11) |
1.7 (10) |
8.9 (53) |
1.3 (8) |
6.2 (37) |
3.2 (19) |
4.7 (28) |
0.7 (4) |
100.0 (595) |
| GNC | 0.7 (8) |
1.1 (13) |
0.5 (6) |
0.4 (5) |
0.6 (7) |
1.0 (12) |
0.2 (2) |
0.1 (1) |
1.1 (13) |
100.0 (1199) |
| Mz | 2.8 (58) |
3.4 (72) |
0.1 (2) |
0.8 (16) |
4.1 (86) |
0.6 (12) |
0.8 (16) |
0.5 (10) |
0.1 (2) |
100.0 (2098) |
| NrB | 1.5 (9) |
1.0 (6) |
1.2 (7) |
1.0 (6) |
0.2 (1) |
- | 17.5 (105) |
0.8 (5) |
1.0 (6) |
100.0 (600) |
| PsC | 2.0 (36) |
0.9 (16) |
3.1 (54) |
3.1 (54) |
0.5 (8) |
3.7 (66) |
1.1 (20) |
3.9 (68) |
2.5 (44) |
100.0 (1766) |
| Vrt | 0.6 (7) |
1.2 (14) |
0.6 (7) |
0.3 (4) |
1.3 (16) |
1.0 (12) |
0.2 (2) |
0.2 (2) |
0.8 (10) |
100.0 (1200) |
| GNS | 0.5 (3) |
2.2 (13) |
- | 0.2 (1) |
3.3 (20) |
0.5 (3) |
1.8 (11) |
0.3 (2) |
0.7 (4) |
100.0 (598) |
| ME | 8.2 (49) |
1.2 (7) |
- | 0.3 (2) |
- | 1.2 (7) |
- | 0.2 (1) |
- | 100.0 (600) |
| MSl | 56.5 (337) |
0.3 (2) |
0.2 (1) |
0.3 (2) |
2.5 (15) |
0.5 (3) |
6.7 (40) |
0.3 (2) |
- | 100.0 (596) |
| MSr | 0.7 (4) |
62.8 (377) |
0.2 (1) |
0.3 (2) |
1.2 (7) |
4.0 (24) |
- | 1.7 (10) |
- | 100.0 (600) |
| NrT | 0.2 (1) |
1.3 (8) |
25.7 (154) |
6.5 (39) |
0.7 (4) |
10.5 (63) |
0.3 (2) |
6.0 (36) |
11.2 (67) |
100.0 (599) |
| NPS | 0.5 (3) |
- | 3.8 (23) |
40.1 (240) |
0.8 (5) |
4.5 (27) |
0.8 (5) |
9.2 (55) |
4.3 (26) |
100.0 (599) |
| NPd | 1.7 (10) |
0.7 (4) |
- | 1.7 (10) |
58.6 (349) |
0.7 (4) |
1.3 (8) |
- | - | 100.0 (596) |
| NPt | - | 2.4 (14) |
8.2 (49) |
1.7 (10) |
- | 51.8 (308) |
0.3 (2) |
3.5 (21) |
7.2 (43) |
100.0 (595) |
| NPl | 3.0 (18) |
- | 0.8 (5) |
1.7 (10) |
1.0 (6) |
- | 60.7 (362) |
0.7 (4) |
0.3 (2) |
100.0 (596) |
| PsO | 0.3 (2) |
1.7 (10) |
8.2 (49) |
10.5 (63) |
- | 11.0 (66) |
0.3 (2) |
25.4 (152) |
4.3 (26) |
100.0 (599) |
| PrN | 0.2 (1) |
0.3 (2) |
9.2 (55) |
6.7 (40) |
0.2 (1) |
5.5 (33) |
- | 6.5 (39) |
47.0 (280) |
100.0 (596) |
| Overall | 58.8 (15,808) |
Statistical comparisons among the analysed white berry cultivars, on the basis of the morpho-colorimetical features. In parentheses the number of seeds.
| ArB | ArG | ArM | CnT | Cl | GB | MPt | Nr | Sn | Vr | VrR | VrS | |
| ArB | 68.5 (411) |
- | - | 0.2 (1) |
0.7 (4) |
- | 3.2 (19) |
- | - | 7.8 (47) |
6.7 (40) |
1.0 (6) |
| ArG | 0.3 (2) |
88.3 (528) |
5.7 (34) |
0.5 (3) |
- | 0.2 (1) |
0.5 (3) |
0.3 (2) |
0.8 (5) |
- | - | 2.3 (14) |
| ArM | 0.3 (4) |
9.4 (112) |
73.9 (881) |
1.1 (13) |
- | 4.4 (53) |
- | 1.0 (12) |
5.2 (62) |
0.5 (6) |
- | 3.7 (44) |
| CnT | 0.2 (2) |
0.3 (4) |
- | 73.2 (878) |
0.3 (4) |
0.2 (2) |
2.2 (26) |
- | 9.3 (112) |
0.2 (2) |
- | 5.3 (64) |
| Cl | 0.5 (3) |
- | - | 0.7 (4) |
63.6 (382) |
0.2 (1) |
15.6 (94) |
0.2 (1) |
- | 0.2 (1) |
0.3 (2) |
0.2 (1) |
| GB | 0.4 (4) |
- | 3.8 (40) |
0.9 (9) |
0.2 (2) |
69.7 (731) |
1.3 (14) |
5.9 (62) |
1.6 (17) |
4.7 (49) |
0.4 (4) |
3.2 (34) |
| MPt | 1.5 (9) |
0.7 (4) |
- | 7.5 (45) |
11.0 (66) |
1.2 (7) |
47.5 (285) |
1.3 (8) |
0.7 (4) |
0.8 (5) |
0.2 (1) |
2.0 (12) |
| Nr | 2.1 (19) |
0.5 (4) |
2.1 (19) |
0.5 (4) |
0.6 (5) |
6.8 (60) |
1.6 (14) |
49.7 (441) |
2.9 (26) |
1.1 (10) |
0.1 (1) |
0.6 (5) |
| Sn | 0.2 (2) |
1.4 (17) |
1.1 (13) |
11.1 (133) |
0.1 (1) |
0.4 (5) |
0.5 (6) |
1.3 (15) |
70.5 (841) |
0.3 (4) |
- | 1.0 (12) |
| Vr | 5.4 (64) |
- | 0.4 (5) |
0.2 (2) |
1.2 (14) |
3.5 (42) |
2.1 (25) |
0.3 (3) |
0.3 (3) |
63.6 (759) |
9.7 (116) |
0.9 (11) |
| VrR | 14.1 (84) |
- | - | 0.2 (1) |
1.3 (8) |
0.7 4() | 2.7 (16) |
0.3 (2) |
- | 17.8 (106) |
42.7 (255) |
0.3 (2) |
| VrS | 0.9 (9) |
0.6 (6) |
2.8 (29) |
6.0 (63) |
0.5 (5) |
3.3 (35) |
2.8 (29) |
0.8 (8) |
2.6 (27) |
0.4 (4) |
0.2 (2) |
69.6 (730) |
| MLd | - | 0.3 (2) |
- | 2.0 (12) |
0.2 (1) |
0.2 (1) |
1.0 (6) |
0.3 (2) |
0.8 (5) |
- | - | 0.3 (2) |
| MT1 | - | - | - | 2.3 (14) |
0.5 (3) |
- | 2.2 (13) |
0.7 (4) |
0.3 (2) |
- | - | 0.2 (1) |
| MT2 | 1.2 (7) |
- | - | 0.7 (4) |
7.0 (42) |
- | 12.3 (74) |
0.3 (2) |
0.3 (2) |
0.5 (3) |
- | 0.3 (2) |
| MSP | 0.2 (1) |
- | - | 0.8 (5) |
0.7 (4) |
- | 1.0 (6) |
0.2 (1) |
0.2 (1) |
- | - | - |
| NrA | 2.7 (16) |
0.3 (2) |
0.3 (2) |
1.0 (6) |
0.8 (5) |
2.8 (17) |
5.9 (35) |
5.7 (34) |
1.3 (8) |
0.8 (5) |
0.2 (1) |
4.2 (25) |
| Nrt | 1.7 (10) |
- | - | 0.3 (2) |
1.3 (8) |
1.3 (8) |
2.0 (12) |
6.3 (38) |
2.0 (12) |
0.3 (2) |
- | 4.0 (24) |
| Nrd | 0.2 (1) |
0.3 (2) |
0.5 (3) |
0.2 (1) |
1.3 (8) |
1.8 (11) |
1.7 (10) |
6.0 (36) |
0.2 (1) |
- | - | 2.7 (16) |
| NRR | 0.3 (2) |
1.2 (7) |
- | 0.2 (1) |
1.7 (10) |
3.2 (19) |
2.5 (15) |
5.3 (32) |
1.8 (11) |
- | 0.3 (2) |
2.2 (13) |
| VrE | 7.6 (46) |
- | - | - | 0.5 (3) |
1.0 (6) |
0.7 (4) |
- | - | 8.6 (52) |
11.2 (68) |
0.7 (4) |
| CnO | 0.5 (3) |
0.8 (5) |
0.2 (1) |
26.0 (157) |
0.5 (3) |
- | 3.2 (19) |
- | 8.5 (51) |
0.3 (2) |
- | 1.0 (6) |
| Overall | ||||||||||||
| MLd | MT1 | MT2 | MSP | NrA | Nrt | Nrd | NRR | VrE | CnO | Total | ||
| ArB | - | - | 0.8 (5) |
- | 1.3 (8) |
0.5 (3) |
0.3 (2) |
0.2 (1) |
8.8 (53) |
- | 100.0 (600) |
|
| ArG | - | - | - | 0.5 (3) |
- | - | 0.3 (2) |
0.2 (1) |
- | - | 100.0 (598) |
|
| ArM | 0.2 (2) |
0.1 (1) |
- | - | - | - | 0.1 (1) |
- | - | 0.1 (1) |
100.0 (1192) |
|
| CnT | 1.0 (12) |
0.8 (10) |
0.5 (6) |
1.3 (16) |
- | - | - | - | - | 5.2 (62) |
100.0 (1200) |
|
| Cl | 0.2 (1) |
1.2 (7) |
11.1 (67) |
- | 1.7 (10) |
0.7 (4) |
1.3 (8) |
1.3 (8) |
0.5 (3) |
0.7 (4) |
100.0 (601) |
|
| GB | - | - | 0.4 (4) |
0.3 (3) |
1.3 (14) |
2.0 (21) |
1.5 (16) |
0.2 (2) |
2.2 (23) |
- | 100.0 (1049) |
|
| MPt | 0.8 (5) |
0.3 (2) |
15.3 (92) |
- | 3.0 (18) |
2.5 (15) |
1.3 (8) |
0.3 (2) |
0.8 (5) |
1.2 (7) |
100.0 (600) |
|
| Nr | 2.9 (26) |
0.8 (7) |
0.8 (7) |
3.7 (33) |
3.2 (28) |
9.3 (83) |
5.0 (44) |
5.4 (48) |
0.2 (2) |
0.2 (2) |
100.0 (888) |
|
| Sn | 1.5 (18) |
1.8 (22) |
0.6 (7) |
0.3 (3) |
0.2 (2) |
0.2 (2) |
0.1 (1) |
- | - | 7.5 (89) |
100.0 (1193) |
|
| Vr | - | - | 0.7 (8) |
- | 0.6 (7) |
0.1 (1) |
- | 0.1 (1) |
11.1 (132) |
- | 100.0 (1193) |
|
| VrR | - | - | 0.8 (5) |
- | - | 0.2 (1) |
- | - | 18.9 (113) |
- | 100.0 (597) |
|
| VrS | 0.7 (7) |
1.0 (11) |
1.0 (10) |
0.2 (2) |
1.5 (16) |
1.0 (10) |
1.1 (12) |
0.8 (8) |
0.3 (3) |
2.2 (23) |
100.0 (1049) |
|
| MLd | 56.0 (334) |
11.4 (68) |
0.2 (1) |
23.3 (139) |
0.2 (1) |
2.2 (13) |
1.0 (6) |
0.2 (1) |
- | 0.3 (2) |
100.0 (596) |
|
| MT1 | 17.8 (106) |
49.9 (298) |
3.2 (19) |
19.3 (115) |
0.3 (2) |
0.2 (1) |
- | 0.3 (2) |
- | 2.8 (17) |
100.0 (597) |
|
| MT2 | 0.2 (1) |
1.5 (9) |
69.0 (414) |
0.3 (2) |
1.8 (11) |
0.3 (2) |
1.2 (7) |
0.7 (4) |
- | 2.3 (14) |
100.0 (600) |
|
| MSP | 24.5 (147) |
11.8 (71) |
0.5 (3) |
53.0 (318) |
2.2 (13) |
1.3 (8) |
0.7 (4) |
2.2 (13) |
- | 0.8 (5) |
100.0 (600) |
|
| NrA | 0.2 (1) |
1.0 (6) |
3.3 (20) |
1.7 (10) |
31.9 (191) |
11.7 (70) |
12.2 (73) |
11.2 (67) |
0.7 (4) |
- | 100.0 (598) |
|
| Nrt | 1.3 (8) |
1.0 (6) |
1.0 (6) |
0.3 (2) |
10.0 (60) |
49.7 (298) |
9.3 (56) |
8.0 (48) |
- | - | 100.0 (600) |
|
| Nrd | 1.2 (7) |
0.5 (3) |
2.3 (14) |
3.3 (20) |
10.7 (64) |
10.2 (61) |
40.5 (243) |
15.5 (93) |
1.0 (6) |
- | 100.0 (600) |
|
| NRR | 1.8 (11) |
2.7 (16) |
3.3 (20) |
4.0 (24) |
12.4 (74) |
7.3 (44) |
22.7 (136) |
25.5 (153) |
0.8 (5) |
0.7 (4) |
100.0 (599) |
|
| VrE | - | - | 0.2 (1) |
- | 1.2 (7) |
1.0 (6) |
0.2 (1) |
- | 67.4 (410) |
- | 100.0 (608) |
|
| CnO | 0.7 (4) |
6.3 (38) |
2.8 (17) |
0.8 (5) |
0.7 (4) |
0.2 (1) |
0.2 (1) |
- | - | 47.4 (286) |
100.0 (603) |
|
| Overall | 60.1 (16,761) |
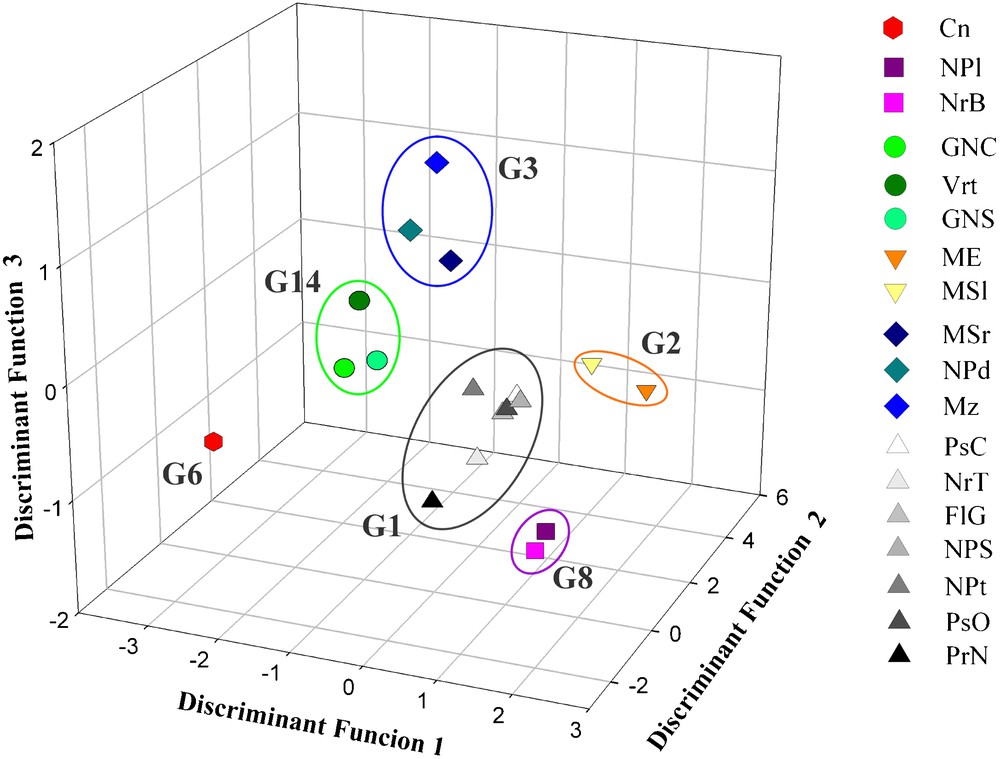
Graphical representation of the black cultivar barycentre discriminant scores.
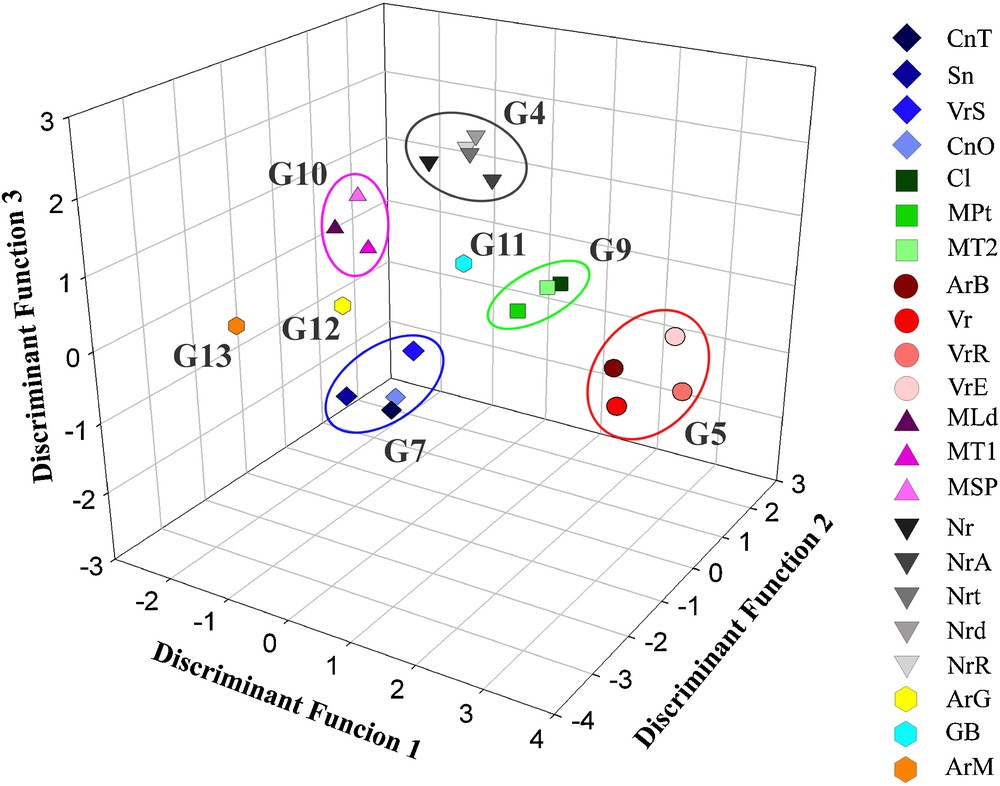
Graphical representation of the white cultivar barycentre discriminant scores.
Following the suggestions of the implemented classifiers, on the basis of the achieved results by the two discriminant statistical elaborations, two further discrimination analyses were carried out, moving some of cultivars from a group to another and hypothesizing new synonymy groups. It was possible to identify six black berry cultivar synonymy groups (Table 6) and eight white berry cultivar synonymy groups (Table 7). The black berry cultivar Manzesu (Mz) was moved from the group 2 (G2) proposed by De Mattia et al. [12], where it was considered synonym of Monica di Escalaplano (ME) and Monica di Seulo (MSl), to the G3 together with Monica di Sorgono (MSr) and Nieddu Mannu di Padria (NPd). The displacement of this black berry cultivar, brought to the increment of the percentages of correct identification of the two groups from 53.4% (Table 3) to 68.6% (Table 6) and 43.1% (Table 3) to 77.4% (Table 6) for G2 and G3 respectively (Fig. 2). According to De Mattia et al. [12], considering the wide diffusion of the Monica cultivars in Sardinia, the presence of the variety known as Monica di Sorgono (MSr) into the G3 rather than into the G2 together with the other Monica cultivars, suggests the possibility that a wrong name was historically attributed to this cultivar. Moreover, this modification allows one to suppose that probably the cultivar named Manzesu (Mz) should be the same variety of those currently known as Monica di Sorgono (MSr) and Nieddu Mannu di Padria (NPd) rather than of Monica di Escalaplano (ME) and Monica di Seulo (MSl) as reported by De Mattia et al. [12]. This supposition is also graphically supported by the spatial distance of the barycentre discriminant scores of these cultivars (Fig. 2).
Percentages of correct classification for the new hypothetical synonymy black cultivar groups. In parentheses the number of seeds.
| G2 | G3 | G6 | G8 | G14 | Total | ||
| G1 |
88.9
(4757) |
0.8 (41) |
4.5 (243) |
0.4 (21) |
1.4 (74) |
4.0 (213) |
100.0 (5349) |
| G2 | 12.3 (147) |
68.6
(820) |
9.9 (119) |
- | 5.5 (66) |
3.7 (44) |
100.0 (1196) |
| G3 | 8.7 (286) |
3.2 (104) |
77.4
(2551) |
0.7 (23) |
1.7 (56) |
8.3 (274) |
100.0 (3294) |
| G6 | 1.4 (24) |
0.2 (4) |
5.7 (102) |
82.3
(1462) |
0.1 (2) |
10.2 (182) |
100.0 (1776) |
| G8 | 8.8 (105) |
5.9 (70) |
1.7 (20) |
0.2 (2) |
81.3
(972) |
2.3 (27) |
100.0 (1196) |
| G14 | 7.2 (216) |
0.2 (5) |
12.9 (388) |
3.1 (92) |
1.6 (49) |
75.0
(2247) |
100.0 (2997) |
| Overall |
81.0
(15,808) |
Percentages of correct classification for the new hypothetical synonymy white cultivar groups. In parentheses the number of seeds.
| G5 | G7 | G9 | G10 | G11 | G12 | G13 | Total | ||
| G4 |
80.4
(2640) |
1.9 (64) |
4.9 (162) |
4.5 (148) |
3.8 (125) |
3.3 (108) |
0.5 (15) |
0.7 (23) |
100.0 (3285) |
| G5 | 1.7 (50) |
90.8
(2722) |
1.8 (55) |
3.3 (100) |
- | 2.1 (63) |
- | 0.3 (8) |
100.0 (2998) |
| G7 | 2.6 (105) |
1.1 (43) |
85.2
(3446) |
2.5 (102) |
4.1 (164) |
1.7 (67) |
1.0 (42) |
1.9 (76) |
100.0 (4045) |
| G9 | 8.2 (148) |
2.3 (42) |
8.9 (160) |
79.2
(1427) |
1.2 (21) |
0.1 (2) |
0.1 (1) |
- | 100.0 (1801) |
| G10 | 5.4 (97) |
0.1 (1) |
4.4 (79) |
2.6 (46) |
87.5
(1569) |
- | 0.1 (1) |
- | 100.0 (1793) |
| G11 | 14.6 (153) |
7.5 (79) |
7.4 (78) |
1.5 (16) |
0.3 (3) |
64.3
(675) |
0.1 (1) |
4.2 (44) |
100.0 (1049) |
| G12 | 2.0 (12) |
- | 4.5 (27) |
- | 0.3 (2) |
0.3 (2) |
85.8
(513) |
7.0 (42) |
100.0 (598) |
| G13 | 0.9 (11) |
0.9 (11) |
9.3 (111) |
- | 0.3 (4) |
4.3 (51) |
10.4 (124) |
73.8
(880) |
100.0 (1192) |
| Overall |
82.80
(16,761) |
Moreover, the white berry cultivars Nuragus (Nr) and Nuragus Arrubiu (NrA), considered as independent by De Mattia et al. [12], were moved into the G4 together with Nuragus Moscatello (Nrt), Nuragus Rosso Rompizzolla (NrR) and Nuragus Moscadeddu (Nrd). Similarly to the previous case, this modification gave a rise in the performance from 69.5% (Table 3) to 80.4% (Table 7) for this synonymy group (Fig. 3).
Also, the independent white berry cultivar Vernaccia di Escalaplano (VrE) was moved into the G5 together with Vernaccia di S. Rosalia (VrR), Vernaccia (Vr) and Aregu Biancu (ArB), producing the same effect on this synonymy group which percentage of correct identification increased from 76.9% (Table 3) to 90.8% (Table 7), allowing one to advance the hypothesis that these four grapevine varieties are the same cultivar (Fig. 3).
The G7, constituted by Cannonau bianco di Triei (CnT) and Cannonau bianco di Oliena (CnO) was enriched with Vernaccia di Solarussa (VrS) and Sinnidanu (Sn), both considered as independent by De Mattia et al. [12]. This arrangement shown an improvement of the discrimination performance, bringing to the increment of the percentages of correct identification of this group from 62.2% (Table 3) to 85.2% (Table 7).
Another interesting case of potential synonymy is represented by Moscato di Tempio 1 (MT1), Moscato di Lodine (MLd) and Moscato Su Pinu (MSP) (Fig. 3). Although these three cultivars were considered different by De Mattia et al. [12] even if genetically close one to the other, here they are included in a new synonymy group (here labelled as G10) on the basis of germplasm phenotypic characters. This group shows a correct identification percentage of equal to 87.5% (Table 7).
Similar considerations for the white berry cultivars Culupuntu (Cl), Moscato di Tempio 2 (MT2) and Moscato di Pattada (MPt) (here labelled as G9). The 79.2% of correct identification obtained for this group (Table 7), as well as the graphical representation of the spatial distance of the discriminant scores (Fig. 3) should confirm the advanced supposition.
The same observations were done for the independent black berry cultivars known as Vertudi (Vrt), Gregu Nieddu del Campidano (GNC) and Gregu Nieddu di Serramanna (GNS) (Tables 3 and 4). The new synonymy G14 was carried out, reaching 75.0% of correct identification (Table 6) and confirming the possibility that these three cultivars are the same (Fig. 2).
Finally, according to the findings of De Mattia et al. [12], the white berry cultivars Gregu Bianco (GB), Aregu Giallo (ArG) and Argu Mannu (ArM) (here labelled as G11, G12 and G13, respectively) seems to be phenotypically and genotipically different when compared with the other studied cultivars, showing percentages of correct discrimination included between 64.3% and 85.8% (Table 7 and Fig. 3).
Considering the new synonymy groupings here proposed, the overall percentages of correct identification risen up to 81.0% for the six black berry cultivar groups (Table 6) and 82.8% for the eight white berry cultivar groups (Table 7).
Table 8 shows the comparison between the synonymy groups proposed by De Mattia et al. [12] on the basis molecular data and the new hypothetical synonymy groups achieved on the basis of morpho-colorimetrical data. It is possible to notice that five of the 14 groups remained unchanged (G1, G6, G8, G12 and G13), five of the studied varieties were unified to groups proposed by De Mattia et al. [12] (Nuragus and Nuragus Arrubiu in G4, Vernaccia di Escalaplano in G5 and Sinnidanu and Vernaccia di Solarussa in G7), tree groups were modified (G2, G3 and G11) and three new groups were formed (G9, G10 and G14).
Comparison between synonymy group notations proposed by De Mattia et al. [12] on the basis molecular data and the new hypothetical synonymy groups achieved on the basis of morpho-colorimetrical data. In bold the modifications.
| Grape variety | Previous synonymy group according to De Mattia et al. [12] | New synonymy group |
| Falso Gregu | G1 | CG |
| Nera Tomentosa | G1 | CG |
| Nieddu Mannu di Pattada | G1 | CG |
| Nieddu Pedra Serra | G1 | CG |
| Pascale di Caglairi | G1 | CG |
| Pascale di Oliena | G1 | CG |
| Primidivu Nieddu | G1 | CG |
| Monica di Escalaplano | G2 | CG |
| Monica di Seulo | G2 | CG |
| Manzesu | G2 | G3 |
| Monica di Sorgono | G3 | CG |
| Nieddu Mannu di Padria | G3 | CG |
| Nuragus Moscadeddu | G4 | CG |
| Nuragus Moscatello | G4 | CG |
| Nuragus Rosso Rompizzolla | G4 | CG |
| Nuragus | IG | G4 |
| Nuragus Arrubiu | IG | G4 |
| Aregu Biancu | G5 | CG |
| Vernaccia | G5 | CG |
| Vernaccia di S. Rosalia | G5 | CG |
| Vernaccia di Escalaplano | IG | G5 |
| Cannonau | G6 | CG |
| Cannonau Bianco di Oliena | G7 | CG |
| Cannonau Bianco di Trieri | G7 | CG |
| Sinnidanu | IG | G7 |
| Vernaccia di Solarussa | IG | G7 |
| Nero di Bosa | G8 | CG |
| Nieddu Polchino | G8 | CG |
| Culupuntu | IG | G9 |
| Moscato di Pattada | IG | G9 |
| Moscato di Tempio 2 | IG | G9 |
| Moscato di Tempio 1 | G9 | G10 |
| Moscato di Lodine | G11 | G10 |
| Moscato Su Pinu | IG | G10 |
| Gregu Bianco | IG | G11 |
| Aregu Giallo | IG | G12 |
| Argu Mannu | IG | G13 |
| Gregu Nieddu del Campidano | IG | G14 |
| Gregu Nieddu di Serramanna | IG | G14 |
| Vertudi | IG | G14 |
4 Conclusions
As discussed above, Sardinian grapevines are characterized by a huge number of cultivars [6,7,11]. Some of these surely derive from different breeding events involving both local and out-coming material, as well as both domesticated and wild grapes, but despite the large and complex grapevine survey, many Sardinian varieties simply are the product of linguistic distortion, due to the wide historic-cultural heterogeneity of the island. This phenomenon generated a great assortment of grape names, that, together with the huge real number of cultivars, is the cause of the incredible current grapevine Sardinian panorama [12].
Many times molecular methods proved to be able to screen biodiversity genotyping and comparing different plant cultivars, allowing direct inferences about genetic diversity and interrelationships among organisms at the DNA level without the confounding effects of the environment and/or faulty pedigree records. Nevertheless, considering that the various molecular marker techniques are based on different principles, the importance of finding the right compromise between reliability and ease of analysis, statistical power and confidence of revealing polymorphisms, is extreme, and the solutions found not always satisfactory [32]. Moreover, frequently costs and execution times of these techniques are the undoubtedly disadvantageous [33]. Furthermore, it is important to consider a few inherent problems associated with the use of SSR markers. Sometimes, homoplasy is a phenomenon observed when a character present in two species is not derived from a common ancestry but rather, the similarity is a result of convergence, parallelism or reversion, so different copies of a locus are identical in state despite not being identical by descent [34]. Other times, in SSR analyses of a large number of samples from diverse germplasm, a few samples fail to produce PCR products, causing the impossibility to determine whether the absence of PCR products represents true null alleles of the SSR locus or is due to a failure of the PCR reaction [34]. Finally, depending from genome samples, the molecular analysis of restricted sequences and few alleles is not enough to discriminate among different cultivars, and the analysed alleles are not always related to varietal characters. For this reason, the potentialities of computer vision as complementary to the molecular methods, were here presented, highlighting how a wide gamma of phenotypic characters can be a valid choice to evaluate differences among cultivars also in a so complex scenario.
In the case of the synonymy study of grapevine cultivars, the 113 measured morpho-colorimetric features of the germplasm resulted enough to achieve a clear discrimination among the synonymy groups, as confirmed by the previous SSR analysis conducted by De Mattia et al. [12] on the same material. Finally, it could be very interesting to assess the contribute of a supporting ampelographic characterization, in particular using image analysis techniques on grapevine leaves, in the varietal identification, as well as in the synonyms and false attribution evaluations.
Disclosure of interest
The authors declare that they have no conflicts of interest concerning this article.
Acknowledgements
The authors thank Antonio Aru, Giampiero Piano and Mauro Sedda for the seeds collecting and cleaning work; Giacomo Piazza and Concetta Ravalli of the Stazione Sperimentale di Granicoltura per la Sicilia for their contribution on the seeds analysis; Paolo Atzeri, Davide Cocco, Maria Caterina Dettori, Efisio Mattana, Roberto Sarigu and Mariano Ucchesu of Centro Conservazione Biodiversità for their assistance in the management and conservation of materials in the Sardinian Germplasm Bank; Massimo Farci, Gianni Lovicu, Fabio Piras and Roberto Zurru of the AGRIS for technical support and for providing the ex situ experimental fields; Roberto Pilia for support to the data formatting. Many thanks to the “Regione Autonoma Sardegna” for the support to the realization of this work, on the basis of the Legge Regionale 7 agosto 2007, n. 7 “Promozione della ricerca scientifica e dell’innovazione tecnologica in Sardegna”, pubblica selezione per il conferimento di borse di ricerca destinate a giovani ricercatori - Bando 2008.