

1 Introduction
The genus Astragalus (Fabaceae) is estimated to contain 2300 (largely based on currently accepted names in [1]) to 2500 species in 245 sections [2]. The Astragalus tragacantha L. complex represents a taxonomically critical group, which deserves in-depth taxonomical investigations [3]. In addition to A. tragacantha, the complex includes A. balearicus Chater, A. tegulensis Bacch. and Brullo, A. terraccianoi Vals. and A. thermensis Vals. [4,5]. This complex is referred to the sect. Melanocercis Bunge of subgen. Cercidothrix Bunge [6,7] based on its spiny suffruticose habit, medifixed black and hyaline hairs, imparipinnate leaves with a spine-like rachis, stipules adnate to the petiole, flowers borne in racemes, tubular calyx, and legume exceeding the calyx [4]. These taxa have generally narrow distributions, scattered in the western Mediterranean area, where they grow in rocky or sandy places [4]. In particular, A. tragacantha is distributed along the coasts of Provence (France), Catalonia (Spain) and Algarve (Portugal) [5,8]; A. balearicus is endemic to the Balearic Archipelago (Mallorca, Menorca and Cabrera; [9]); A. thermensis is endemic to N Sardinia [8]; A tegulensis is known from a single population in SW Sardinia [4]; and A. terraccianoi is endemic to the NW part of Sardinia and southern Corsica [8,10].
The taxonomic treatment of A. terraccianoi is controversial. Jeanmonod and Schlüssel [11] suggested that Corsican populations of this taxon, should be considered as A. tragacantha subsp. terraccianoi (Vals.) Jeanm., due to the high similarity of these plants with those of A. tragacantha occurring in Provence.
Using seed image analysis techniques, Bacchetta et al. [10,12] were able to confirm the morphological differences between the Cyrno-Sardinian species of the A. tragacantha complex and in particular, the validity of the new species (A. tegulensis) proposed by Bacchetta and Brullo [4], as well as to detect the high variability of seed morphometric and colorimetric parameters among Sardinian and Corsican populations of A. terraccianoi.
The aims of the current study were to:
- • use discriminant analysis of seed morpho-colorimetric data in the A. tragacantha complex to determine if the samples cluster by region of provenance;
- • evaluate if differences in seed morphology support the current taxonomic treatment of the complex at issue among all Mediterranean taxa;
- • determine the patterns and levels of seed intra-specific variability, with particular focus on the widespread A. tragacantha and A. terraccianoi.
2 Materials and methods
2.1 Seed lot details
Seeds of two populations of A. balearicus, one of A. tegulensis, three of A. terraccianoi, two of A. thermensis and six of A. tragacantha, for a total of 1326 seeds, were collected in the field (Table 1 and Fig. 1), stored in the Sardinian Germplasm Bank (BG-SAR), and prepared for image analysis following the protocol of Bacchetta et al. [12].
Studied accessions.
| Code | Taxon | Locality | Mean elevation (m a.s.l.) |
Geographic coordinates | Seed number | |
| N | E | |||||
| BA1 | A. balearicus | Cala El Pilar (Balearic Islands) | 10 | 40° 03.043′ | 03° 58.706′ | 89 |
| BA2 | Cap de Favàritx (Balearic Islands) | 14 | 39° 59.785′ | 04° 15.481′ | 100 | |
| TEG | A. tegulensis | Capo Teulada (Sardinia) | 3 | 38° 53.750′ | 08° 38.607′ | 100 |
| TE1 | A. terraccianoi | Alghero (Sardinia) | 45 | 40° 36.355′ | 08° 09.062′ | 39 |
| TE2 | Stintino (Sardinia) | 37 | 40° 57.969′ | 08° 12.189′ | 100 | |
| TE3 | Bonifacio (Corsica) | 73 | 41° 22.678′ | 09° 10.731′ | 100 | |
| TH1 | A. thermensis | Badesi mare (Sardinia) | 5 | 40° 58.448′ | 08° 51.245′ | 100 |
| TH2 | Foci del Coghinas (Sardinia) | 11 | 40° 56.336′ | 08° 49.040′ | 100 | |
| TR1 | A. tragacantha | Les Goudes (France) | 15 | 43° 12.811′ | 05° 20.550′ | 98 |
| TR2 | Calanques de Marseilleveyre (France) | 5 | 43° 12.524′ | 05° 22.389′ | 100 | |
| TR3 | Maronaise (France) | 10 | 43° 17.592′ | 05° 21.236′ | 100 | |
| TR4 | Pomegues Island (France) | 12 | 43° 16.269′ | 05° 17.883′ | 100 | |
| TR5 | Mont Redon (France) | 180 | 43° 14.516′ | 05° 25.919′ | 100 | |
| TR6 | Colle Longue (France) | 130 | 43° 38.360′ | 07° 06.254′ | 100 |

Distribution of the Mediterranean taxa belonging to the Astragalus tragacantha complex (from [8] modified).
2.2 Image analysis
Digital images of seed samples were acquired using a flatbed scanner (Epson GT-15000) with a digital resolution of 200 dpi and a scanning area not exceeding 1024 × 1024 pixel. Image acquisition was performed before drying the seeds at 15 °C to 15% of relative humidity in order to avoid spurious variation in size, shape and colour. The scanner was calibrated for colour matching following the protocol of Shahin and Symons [13] before image acquisition, as suggested by Venora et al. [14]. Samples of 100 seeds, randomly disposed on the flatbed tray, were acquired and used for the digital image analysis. For accessions of fewer than 100 seeds, the analysis was performed on the whole batch.
Digital images of seeds were analysed using the software package KS-400 V. 3.0 (Carl Zeiss, Vision, Oberkochen, Germany). The accuracy and speed of measurements was maximized by running an automated macro specifically developed for the characterization of wild seeds (Bacchetta et al. [12]; with later enhancements by Mattana et al. [15]). Thirty-four morpho-colorimetric quantitative variables, describing seed size, shape and colour, were measured by computer vision. In addition, the mean seed weight of each accession (calculated from 20 seeds, each weighed 10 times, on a four decimal places scale) was included to increase the discriminant power of the statistical analysis [16] (Appendix A).
2.3 Data analysis
Statistical analyses were performed with the software SPSS release 15 [17], applying the same stepwise linear discriminant analysis (LDA) algorithm suggested by Grillo et al. [18]. This approach is commonly used to classify/identify unknown groups characterized by quantitative and qualitative variables [19,20], finding the combination of predictor variables with the aim of minimizing the within-class distance and maximizing the between-class distance simultaneously, thus, achieving maximum class discrimination [21,22]. A cross-validation procedure was applied to test the performance of the classifiers, as reported by Bacchetta et al. [23]. Following this approach, statistical classifiers were developed in order to distinguish sample clusters referred to the provenance regions of the seed accessions and the studied seed lots both at taxa and population level. To graphically highlight the differences among populations, a box plot was drawn using the Mahalanobis’ square distance values [24]. This measure of distance is defined by two or more discriminant functions and ranges from 0 to infinite. Samples are increasingly similar as Mahalanobis’ square distance approaches zero [12]. A Kruskal–Wallis test was performed to test for the differences in the Mahalanobis’ square distance median values among the studied groups. Linear regression was modeled considering the number of studied populations and the Mahalanobis’ square distance values in order to evaluate if the populations amount affects the intra-specific variability of Astragalus species and the number of discriminant steps (and consequently the number of used features).
3 Results
The analysis of seed characters was highly effective in grouping samples by region of provenance, with 95.3% overall accuracy (data not shown). Specifically, all the seeds from the Balearic Islands were correctly assigned, and no seeds from other regions were mistakenly assigned to this group (Fig. 2). Seeds from Provence were correctly discriminated with 98.7% accuracy, while only 1.3% was wrongly classified as Corsican. Contrastingly, seeds from Corsica showed the lowest percentage of correct assignment (69.0%), due to the assignment of 28.0% of them to Provence and 3.0% to Sardinia regions. Finally, seeds from Sardinia were correctly assigned with 94.6% accuracy, and errors distributed between Corsica (3.2%) and Provence (2.2%).
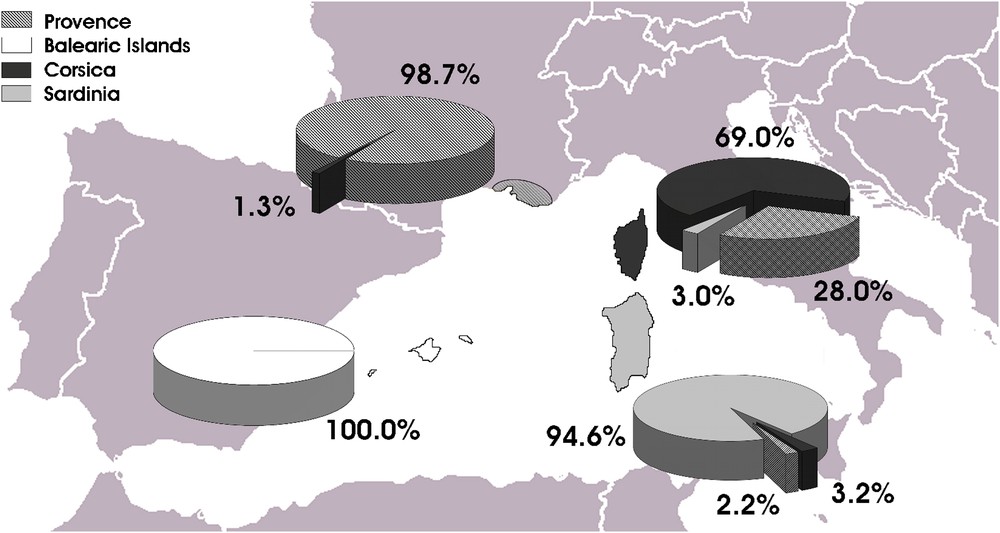
Discriminant analysis carried out for regions of provenance (without taking into account the taxa).
Applying the same statistical model, the five studied taxa of A. tragacantha group were analysed achieving, an overall cross-validated correct identification of 95.5% (Table 2). The seeds of A. balearicus, A. tegulensis and A. thermensis were perfectly identified; those of A. tragacantha were correctly recognized in 99.8% of the cases and only one of the 598 analysed seeds was mistaken for A. terraccianoi. Finally, the seeds of A. terraccianoi were correctly identified in 75.3% of the cases with most misclassifications due to attributions to A. tragacantha (23.4%).
Cross-validated percentages of correct classification for the Astragalus taxa classifier.
| Taxon | A. balearicus | A. tegulensis | A. terraccianoi | A. thermensis | A. tragacantha | Total |
| A. balearicus | 100.0 (189) | – | – | – | – | 100.0 (189) |
| A. tegulensis | – | 100.0 (100) | – | – | – | 100.0 (100) |
| A. terraccianoi | – | 0.8 (2) | 75.3 (180) | 0.4 (1) | 23.4 (56) | 100.0 (239) |
| A. thermensis | – | – | – | 100.0 (200) | – | 100.0 (200) |
| A. tragacantha | – | – | 0.2 (1) | – | 99.8 (597) | 100.0 (598) |
| Overall | 95.5 (1326) |
In order to compare populations of the two more widespread species and to evaluate their inter-population variability, a separate comparison was carried out among the three populations of A. terraccianoi (two from Sardinia and one from Corsica) and the six Provencal populations of A. tragacantha. The analysis achieved an overall cross-validated discrimination percentage of 60.5% (Table 3). The seeds of the two Sardinian populations of A. terraccianoi (Alghero and Stintino) were correctly identified in 61.5% and 90.0% of the cases, respectively, with misattributions mainly due to the mistakes between them. Sardinian seeds of A. terraccianoi were never wrongly assigned to populations of A. tragacantha. On the other hand, the Corsican population of A. terraccianoi was correctly discriminated at 82.0%, with misidentified seeds being assigned exclusively to the Provencal populations of A. tragacantha. The six populations of A. tragacantha achieved percentages of correct attribution ranging between 22.0% (Calanques de Marseilleveyre) and 89.8% (Les Goudes) and showed high intra-specific similarity with other populations (Table 3).
Cross-validated percentages of correct classification for the Astragalus tragacantha and Astragalus terraccianoi populations’ classifier.
| Population | TE1 | TE2 | TE3 | TR1 | TR2 | TR3 | TR4 | TR5 | TR6 | Total |
| TE1 | 61.5 (24) | 33.3 (13) | 5.1 (2) | – | – | – | – | – | – | 100.0 (39) |
| TE2 | 10.0 (10) | 90.0 (90) | – | – | – | – | – | – | – | 100.0 (100) |
| TE3 | – | – | 82.0 (82) | 6.0 (6) | 1.0 (1) | 1.0 (1) | 6.0 (6) | 1.0 (1) | 3.0 (3) | 100.0 (100) |
| TR1 | 5.1 (5) | – | – | 89.8 (88) | – | – | – | – | 5.1 (5) | 100.0 (98) |
| TR2 | – | – | – | – | 22.0 (22) | 23.0 (23) | 20.0 (20) | 14.0 (14) | 21.0 (21) | 100.0 (100) |
| TR3 | – | – | – | – | 12.0 (12) | 51.0 (51) | 16.0 (16) | 14.0 (14) | 7.0 (7) | 100.0 (100) |
| TR4 | 2.0 (2) | – | – | – | 19.0 (19) | 16.0 (16) | 30.0 (30) | 14.0 (14) | 19.0 (19) | 100.0 (100) |
| TR5 | 4.0 (4) | – | – | 1.0 (1) | 14.0 (14) | 6.0 (6) | 9.0 (9) | 47.0 (47) | 19.0 (19) | 100.0 (100) |
| TR6 | – | – | – | 1.0 (1) | 15.0 (15) | 12.0 (12) | 12.0(12) | 23.0 (23) | 37.0 (37) | 100.0 (100) |
| Overall | 60.5 (837) |
To evaluate the inter- and intra-specific morpho-colorimetric variability of the studied taxa, the Mahalanobis’ square distance values, among the discriminant functions achieved by the LDA and used to distinguish the analysed seed groups, were used to highlight the spatial dispersion among the compared populations. Fig. 3 shows the graphical representation of the variability of the data points for the analysed species distinguished for population. A. tegulensis was excluded from this analysis since it was represented by a single population. Intra-specific variability varied among taxa with Mahalanobis’ square distance values ranging from 0.0005 to 5.8576 (A. balearicus) and from 0.1010 to 21.5258 (A. tragacantha). The most variable A. tragacantha population was that of Les Goudes (France), with Mahalanobis’ square distance values ranging from 0.7648 to 21.5258 (data not shown). A highly significant correlation between the number of populations and the intra-specific variability was found (R2 = 0.998 and P < 0.001).
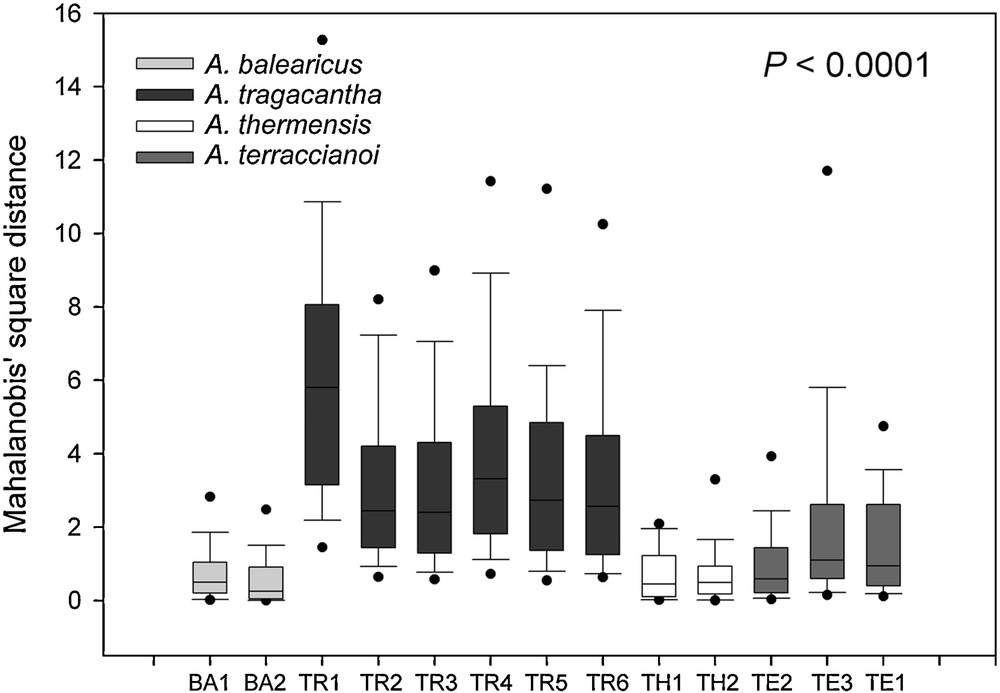
Spatial dispersion of intra-population data highlighted by Mahalanobis’ square distance for each population in comparison with the others of the same species (Astragalus tegulensis populations was not analysed). Dots represent 5th and 95th percentile outliers. P < 0.0001 by non-parametric Kruskal–Wallis test.
The best discriminating variables chosen by the stepwise method from among the 34 studied variables are shown in Table 4. Discrimination was achieved by colorimetric features (RGB and HLS channels) and densitometric descriptors, except for A. thermensis in which the fourth best discriminating parameter was the roundness factor (Rf), which also displayed the lowest F-to-remove value among the best five-discriminant parameters in the studied species. A significant linear correlation (R2 = 0.933 and P < 0.05) was found between the number of discriminant steps (and consequently the number of used features) and the number of investigated populations per species.
Number of populations, discriminant steps and performance of identification. Ranking of the best key discriminant parameters. Number of populations, number of steps required by LDA, the best discriminant parameters and the percentage of correct classification are reported.
| A. balearicus | A. tragacantha | A. thermensis | A. terraccianoi | |
| Number of populations | 2 | 6 | 2 | 3 |
| Number of steps | 3 | 14 | 4 | 9 |
| 1st discriminant parameter | Dmean (0.565; 196.279; 0.798) | K (0.882; 16.476; 0.140) | Dmean (0.008; 34.215; 0.369) | Bsd (0.110; 62.019; 0.056) |
| 2nd discriminant parameter | SqDsum (0.578; 56.437; 0.505) | Ssd 0.033; 8.460; 0.132) | Bmean (0.173; 32.980; 0.367) | Bmean (0.616; 24.015; 0.044) |
| 3rd discriminant parameter | Hsd (0.965; 38.003; 0.467) | Lsd (0.017; 5.375; 0.128) | Smean (0.010; 19.678; 0.346) | Dsd (0.014; 16.479; 0.042) |
| 4th discriminant parameter | – | Rsd (0.018; 4.818; 0.128) | Rf (0.964; 3.953; 0.320) | Lsd (0.023; 12.877; 0.041) |
| 5th discriminant parameter | – | Dsum (0.043; 4.454; 0.127) | – | Rsd (0.039; 10.694; 0.040) |
| Percentage of correct identification between populations | 89.9% | 51.8% | 93.5% | 91.6% |
4 Discussion
In this study, the analysis of seed features was generally supportive of the taxonomy of the A. tragacantha complex, as proposed by Valsecchi [8]. Moreover, seed morphology likely reflects the geographic provenance of seed collections (without considering taxonomy). Actually, in the western Mediterranean basin, high endemism is related to the age of the geological platform [25] previously reported for Sardinia, Corsica and the Balearic Islands for the Araceae [26]. In the current study, the observed pattern of strong morphological and colorimetric differentiation of the A. balearicus seeds is indicative of the relatively long period of geographic isolation of the Balearic Islands. The observed amount of colorimetric and morpho-metric overlap among the studied populations well explains the distribution of the seed misidentifications. The influence of Provencal populations on the other ones decreases with latitude, whereas the pressure of Sardinian populations increases with the same criterion, while the influence of the Corsican one seems to be directly proportional to the geographical distances in both directions.
Differentiation in seed characters at inter-specific level is likely driven by geographical isolation. A. balearicus, A. tragacantha, A. thermensis and A. tegulensis are all strongly differentiated, as recently highlighted by Bacchetta and Brullo [4]. The Sardo-Corsican population of A. terraccianoi is less distinct, supporting the findings of Jeanmonod and Schlüssel [11] and suggesting the need of additional taxonomic studies. Populations of this species from Provence and Corsica have recently been found to form two well supported subclades, within the monophyletic clade of A. tragacantha [27].
The wide geographical distribution and relatively larger population size of A. tragacantha and A. terraccianoi with respect to the three narrowly distributed species (A. balearicus, A. thermensis and A. tegulensis), is likely to be the driver of higher intra-specific morpho-colorimetric variability. This relatively high intra-specific variability explains the higher percentage of misassignment of A. terraccianoi seeds compared to those of all the other species in the study. The reduced genetic diversity is often found in populations of endemic and rare plant species [28,29], however, the degree to which phenotypic variability in the seed characters is correlated with genetic diversity remains to be investigated.
This study testifies the usefulness of discriminant analysis, based on morpho-colorimetric seed features, in taxonomic studies and sheds light on the effect of the number of sampled populations on the discriminatory power of the method.
By evaluating the contribution of the variables, using the discrimination algorithm (LDA), it was possible to identify the features that, more than others, were relevant for the discrimination of the Astragalus taxa included in this study, noting that the number of need steps, and consequently, the necessary parameters is proportional to the number of available populations and so the number of analysed seeds, affecting the sample variability and the performance of the identification systems.
Disclosure of interest
The authors declare that they have no conflicts of interest concerning this article.
Acknowledgements
The authors thank Alex Baumel and Pere Fraga, for kindly providing the seeds of Provencal and Balearic areas respectively; Paolo Atzeri and Roberto Sarigu of Centro Conservazione Biodiversità for their assistance in the management and conservation of materials in the Sardinian Germplasm Bank (BG-SAR). Many thanks to the “Regione Autonoma Sardegna” for the support to the realization of this work, on the basis of the Legge Regionale 7 agosto 2007, n. 7. This research was supported by the Ente Foreste della Sardegna (Regione Autonoma della Sardegna).
Appendix A List of morphometric and colorimetric measured features on seeds.
| Feature | Description | |
| A | Area | Seed area (mm2) |
| P | Perimeter | Seed perimeter (mm) |
| P conv | Convex perimeter | Convex perimeter of the seed (mm) |
| P Crof | Crofton's perimeter | Perimeter of the seed calculated using the Crofton's formula (mm) |
| P conv /P Crof | Perimeter ratio | Ratio between convex and Crofton's perimeters |
| D max | Max diameter | Maximum diameter of the seed (mm) |
| D min | Min diameter | Minimum diameter of the seed (mm) |
| Dmin/Dmax | Feret ratio | Ratio between minimum and maximum diameters |
| Sf | Shape factor | Seed shape descriptor = (4 π × area)/perimeter2 (normalized value) |
| Rf | Roundness factor | Seed roundness descriptor = (4 × area)/(π × max diameter2) (normalized value) |
| Ecd | Eq. circular diameter | Diameter of a circle with an area equivalent to that of the seed (mm) |
| EA max | Maximum ellipse axis | Maximum axis of an ellipse with equivalent area (mm) |
| EA min | Minimum ellipse axis | Minimum axis of an ellipse with equivalent area (mm) |
| R mean | Mean red channel | Red channel mean value of seed pixels (grey levels) |
| R sd | Red std. deviation | Red channel standard deviation of seed pixels |
| G mean | Mean green channel | Green channel mean value of seed pixels (grey levels) |
| G sd | Green std. deviation | Green channel standard deviation of seed pixels |
| B mean | Mean blue channel | Blue channel mean value of seed pixels (grey levels) |
| B sd | Blue std. deviation | Blue channel standard deviation of seed pixels |
| H mean | Mean hue channel | Hue channel mean value of seed pixels (grey levels) |
| H sd | Hue std. deviation | Hue channel standard deviation of seed pixels |
| L mean | Mean lightness channel | Lightness channel mean value of seed pixels (grey levels) |
| L sd | Lightness std. deviation | Lightness channel standard deviation of seed pixels |
| S mean | Mean saturation channel | Saturation channel mean value of seed pixels (grey levels) |
| S sd | Saturation std. deviation | Saturation channel standard deviation of seed pixels |
| D mean | Mean density | Density channel mean value of seed pixels (grey levels) |
| D sd | Density std. deviation | Density channel standard deviation of seed pixels |
| S | Skewness | Asymmetry degree of intensity values distribution (grey levels) |
| K | Kurtosis | Peakness degree of intensity values distribution (densitometric units) |
| H | Energy | Measure of the increasing intensity power (densitometric units) |
| E | Entropy | Dispersion power (bit) |
| D sum | Density sum | Sum of density values of the seed pixels (grey levels) |
| SqD sum | Square density sum | Sum of the squares of density values (grey levels) |
| SW | Seed mean weight | Mean value of seed weight (g) |